ASSESSING LAND COVER CHANGES CAUSED BY GRANITE QUARRYING USING
REMOTE SENSING
Moeletsi R.S. 1; 2*and Tesfamichael S.G. 1
1Department of Geography, Environmental Management and Energy Studies
University of Johannesburg, Auckland Park, 2006, Johannesburg, South Africa 2Mintek, 200 Malibongwe Drive, Randburg, South Africa, 2125
Email address: [email protected]; [email protected]
KEY WORDS: Remote sensing, Land cover changes, Granite quarries, Landsat, Supervised classification
ABSTRACT
Dimension stone quarrying in the area between Rustenburg and Brits in the North West Province of South Africa has been in existence for over 70 decades. The unique characteristics of the granite deposits in South Africa resulted in making the country a global producer of the granite rocks. This led to intensified quarrying activities between Rustenburg and Brits town. However, this surface mining method, has a potential to impact the environment in a negative way causing loss in vegetation, depletion of natural resources, loss of scenic beauty and contamination of surface water resources. To assess the land cover changes caused by granite quarrying activities, remotely sensed data in the form of Landsat images between 1998 and 2015 were used. Supervised classification was used to create maps. Accuracy assessment using Google EarthTM as a reference data yielded an overall accuracy of 78%. The post classification change detection method was used to assess land cover changes within the granite quarries. Granite quarries increased by 1174.86 ha while formation of quarry lakes increased to 5.3 ha over the 17-year period. Vegetation cover decreased by 1308 ha in area while 18.3 ha bare land was lost during the same period. This study demonstrated the utility of remote sensing to detect changes in land cover within granite quarries.
1. INTRODUCTION
The extraction of natural resources usually generates environmental impacts on water systems, natural vegetation, agricultural land and other natural resources (Paull et al., 2006). Quantifying the effects that mining activities have on ecosystems is vital for sustainable development and resource management (Latifovic et al., 2005). Since the launch of the first Earth Resources Technology Satellite in 1972 (ERTS-1, later renamed Landsat 1), there has been significant activities related to mapping and monitoring environmental changes caused by anthropogenic pressures and natural processes (Treitz and Rogan, 2004). As a result, remotely sensed data have become a useful tool to complement ground-based environmental monitoring methods that are otherwise confined to point, grid or traverse-based measurements (Lamb, 2000; Lillesand et al., 2014; Rawat and Kumar, 2015).
The main advantages of remote sensing are that it has an ability to cover large areas and reaches inaccessible areas (Cracknell and Hayes, 2007; Koruyan et al., 2012). It provides a relatively low cost means of data acquisition method (Loveland and Dwyer, 2012). Furthermore, remote sensing has spatial resolutions that are suitable for most environmental applications. Another advantage of remote sensing relates to the availability of historical digital data. Such data can be available for decades and thus allow for long-term time-series analysis (Wulder et al., 2008). The mining industry has been an extensive user of remote sensing , but the focus has primarily been on applying the technology to assist with mineral exploration and modelling (Sabins, 1999; Liu et al., 2000; Paull et al., 2006). There is a need to apply the technology for assessing the environmental impacts of mining activities such as quarrying. A number of published research papers have proven remote sensing a useful tool in monitoring and assessing environmental impacts caused by quarrying. Bonifazi et al. (2003) conducted a study to determine the capability of remote sensing to monitor abandoned limestone
quarries. The study proved remote sensing to be an effective tool for monitoring such quarries and for surveying their evolution over time. Similarly, Mouflis et al. (2008) assessed the visual impacts of marble quarry expansion from 1984-2000 on the landscape of Thasos island, North East Greece. The study estimated various landscape metrics before and after quarrying activities in the study area. Koruyan et al. (2012) examined the areal expansion of marble quarries and the change in vegetation around Mugla region from 2001-2009 using remote sensing. More lately, Borana et al., (2014) analysed land use and land cover changes associated with sandstone quarries in the city of Jodhpur in India using Landsat data over a period of 10 years, and showed considerable land cover changes due to mining activities. The above mentioned studies have demonstrated remote sensing to be an efficient and effective tool for mapping and assessing environmental impacts caused by quarrying activities. Even so, not much work has been done on impacts of granite quarries using remote sensing especially in South Africa. The aim of this study was to investigate the effectiveness of remote sensing in detecting land cover changes caused by granite quarries between Rustenburg and Brits area in the North West Province, South Africa.
1.1 History of granite quarrying in South Africa
must be free of imperfections such as veins, joints and spots and must have a consistent colour and texture (Maponga and Munyanduri, 2001; Ashmole and Motloung, 2008a). Dimensions stone mining in South Africa, most particularly granite started in the Bon-Accord area, near Pretoria in the late 1930s in the Main Zone of the Bushveld complex. The first quarry in Rustenburg region started in the farm Nooitgedacht 287Q in 1947 (Nex et al., 1998). This was followed by Kudu granite situated in the farm Boschpoort 284Q just 12 km northeast of Rustenburg. Taylor quarry is situated in the farm Tweedepoort 283Q approximately 3km north of Bospoort Dam. The Belfast black granite mining started in Kwaggaskop in 1961 (Ashmole and Motloung, 2008b). Improved mining techniques and increase in quarries has led to an increased production which contributes significantly to the
country’s economy and job creation (Maponga and Munyanduri,
2001; Ashmole and Motloung, 2008b). According to the Department of Mineral Resources, the South African dimension stone industry has established itself as a major player globally due to unique characteristics of some of the stones found in the North West province such as red granite, black granite and Rustenburg grey (DMR, 2015).
Figure 1: Top: Google EarthTM image showing granite quarry around Brits area (Google EarthTM).
2. STUDY AREA
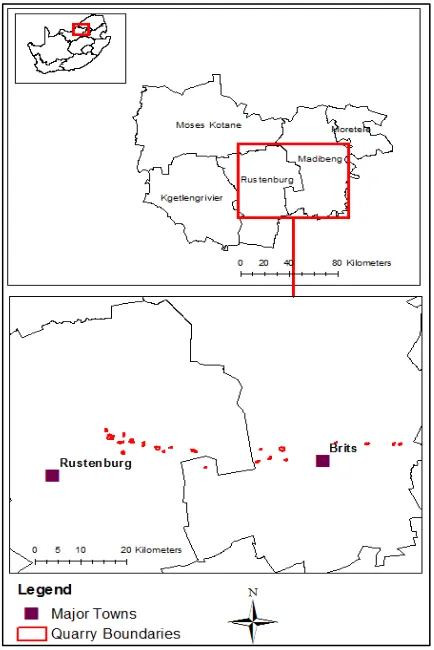
The study area was chosen based on the knowledge of quarrying activity in the area and presented in Figure 2. It is located between Rustenburg and Brits town in the North West Province, South Africa (Figure 3). Granite formations in the North West Province occur in the Main Zone of the Rustenburg Layered Suite in the Bushveld Complex (Nex et al., 1998; Kinnaird, 2005). The mining occurs between Brits and Rustenburg towns. The study area forms part of the Norite Koppies Bushveld vegetation type which extends from Rustenburg in the west to Pretoria in the east and forms part of the Savanna Biome of South Africa. Assessments conducted in the koppies in the study area have indicated that approximately 20 % of the koppies have been transformed mainly due to mining activities and urbanization of surrounding land. The mining activities in these koppies are mostly granite quarries which cause massive damage to vegetation (Lamprecht et al., 2011).
Figure 2: A map showing study area and location of granite quarries.
3. METHODOLOGY
3.1 Sampling and data acquisition
Quarries were sampled based on their spatial coverage and the distance between them. Quarries with spatial coverage of more than 1 hectare were considered for the study. This was to allow for affective comparison with remotely sensed data. A total of twenty quarries were sampled around the study area. A minimum distance of 1 km between quarries was specified when sampling in order to avoid an overlap of samples that may compromise independence of each sample. Granite quarries were located using geographical positioning system (GPS) coordinates acquired from the minerals data base of Council for Geoscience and by using Google EarthTM. After acquiring coordinates, Google Earth TM was used to verify the locations as well as to digitize quarry boundaries. Google Earth™ offers Digital Globe images at spatial resolution of 0.5 m and has been used as a source of reference data in remote sensing analysis (Hu et al., 2013; Singh et al., 2015). Landsat images were acquired from the United State Geological Survey (http://earthexplorer.usgs.gov/) given in Table 1. Attempts were made to use images acquired during the wettest months between December and March when vegetation is denser; however, the unavailability of suitable images necessitated the use of images outside of this time window. However both March and April are generally known as high vegetation vigour months in the summer rainfall regions of South Africa including the study area.
Location Sensor Image dates
Brits-Rustenburg
Landsat 5 Thematic Mapper
16 March 1998
Landsat 8 Operational Land Imager/Thematic Infrared Sensor
16 April 2015
Table 1: Landsat data used in the study
3.2 Image processing
Images were radiometrically calibrated by converting Digital Numbers (DN) to Top-of-Atmosphere (TOA) reflectance. Following radiometric calibration, multispectral image was created by combining all bands, except panchromatic band for each date. A preliminary comparison between supervised and unsupervised classification showed confusion in differentiating between granite quarries from other mines such as platinum mines as well as build up land using the latter approach; therefore supervised classification was applied in the study. A total of 50 randomly selected points were used to assess accuracy of classes created from the April 2015 image by using Google EarthTM as reference data. Commonly used classification statistics, including overall, producer’s and user’s accuracy were quantified for the accuracy assessment. Furthermore, kappa statistic was calculated using Equation 1 (Landis and Koch, 1977). Post classification change detection method was performed following accuracy assessment.
K =
Po− Pe1−Pe (1)where Po = observational probability of agreement
Pe= hypothetical expected probability of agreement
4. RESULTS
4.1 Image classification
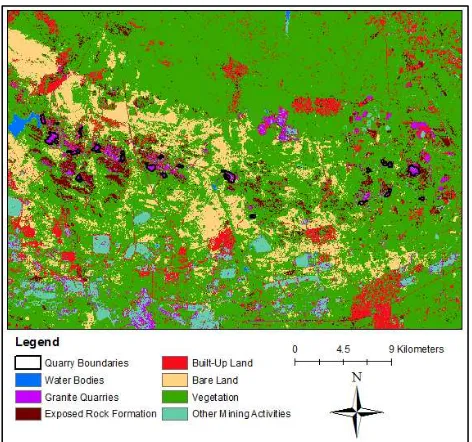
Seven land cover types were generated from the classification analysis (Figure 3). These include (1) water bodies which describe streams, rivers or dams, (2) vegetation which includes agricultural, natural or forest land surfaces, (3) other mining activities which refers to any other mine in the surrounding areas except for the quarries, (4) granite quarries, (5) exposed geological rock formation, (6) built-up land and (7) barren land.
Figure 3: Supervised classified image of 2015
Accuracy assessment was carried out on the 2015 supervised classified image. The results based on 50 random points is presented in Figure 4. The Overall accuracy was 78%, while
producer’s and user’s accuracies varied ~40-100% and
~50-100%, respectively (Figure 4). Kappa coefficient was 0.59, which according to Landis and Koch (1977) is a moderate strength of agreement.
Figure 4: Accuracy assessment results
4.2 Change Detection
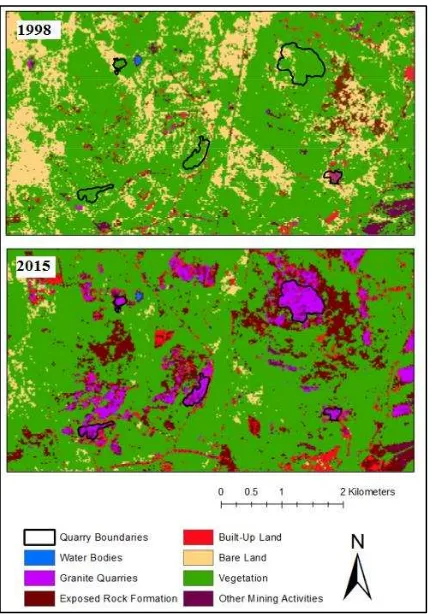
Figure 5 shows the difference in land cover in 1998 and 2015. In 1998 the land was covered mostly by vegetation and bare land while in 2015, the same area was covered mostly by granite quarries. Figure 6 shows a comparison between granite expansion from 1998 to 2015. It can clearly be seen from the 2015 image that the area covered by granite quarries has expanded relative to that in 1998.
0% 20% 40% 60% 80% 100%
Figure 5: Supervised classified image showing the difference in land cover in 1998 and 2015.
Figure 6: Supervised classified image showing the expansion of granite quarries from 1998 to 2015.
boundaries in the year 1998 and 2015 is given in Table 2. A significant change from vegetation and bare land to granite quarries was observed. In addition to this, water bodies were also detected within granite quarries. These water bodies are the result of granitic rock excavations that quarry lakes and accumulate water from rainfall and surface flows.
Land cover in 1998 Land cover in 2015
Vegetation Granite Quarries
Vegetation Vegetation
Granite Quarries Granite Quarries
Bare Land Granite Quarries
Granite Quarries Vegetation
Bare Land Vegetation
Vegetation Water Bodies
Granite Quarries Water Bodies
Water Bodies Water Bodies
Water Bodies Granite Quarries
Bare Land Bare Land
Granite Quarries Bare Land
Vegetation Bare Land
Table 2: Land cover comparison between 1998 and 2015 Images
Figure 7 quantifies the difference in land cover change around granite quarries from 1998-2015. An increase of 5.3 ha in water bodies within granite quarries indicates formation of quarry lakes as quarries expand. There has been a considerable increase (approximately 1174.68 ha) in granite quarries from the year 1998-2015. The increase in quarrying activity led to a significant decrease in vegetation with the loss of close to 1308.24 ha in vegetation. Bare land, too, decreased with 18.36 ha around the quarry areas.
Figure 7: Land cover change (difference) over the period of 17 years around granite quarries -14
-9 -4 1 6 11
Wa
ter B
o
d
ie
s
G
ra
n
ite
Q
u
a
rri
e
s
Ve
ge
ta
ti
o
n
Bare
L
an
d
A
rea
(
h
a)
Hu
n
d
red
5. DISCUSSION
Assessment of land cover change within granite quarries is very useful in monitoring and quantifying the impacts quarrying has on the environment. Land cover change caused by granite quarries between Rustenburg and Brits towns were effectively mapped using two Landsat images of 1998 and 2015. Landsat was preferred for this study because of its advantages of availability of data at no cost, moderate spatial resolution, higher temporal resolution, large spatial extend and the availability of long historic datasets. Landsat images were classified using supervised classification, this method was favourable because trained classes were able to better differentiate between features with spectral similarities such as quarries, platinum mines and build-up land. Accuracy classification of the 2015 image is 78%. The Kappa statistics was 0.58. The results of accuracy were affected by spectral similarities between granite quarries, other mines in the study area such as platinum mines as well as build-up land. Similar studies of mapping stone quarrying using remote sensing made use of Landsat and ASTER dataset. Even though most of these studies did not report on the accuracy of their classification, Mouflis et al. (2008) obtained overall classification accuracy of 85.7% using object based classification on Landsat imagery for mapping expansion of marble quarries. Most studies however reported, the effectiveness of Landsat imagery to assess land cover change caused by stone quarrying. This observation was confirmed by our findings in this study.
6. CONCLUSION
The results obtained in this study demonstrated that remote sensing is a valuable tool in detecting land cover changes within granite quarries. Supervised classification was found favourable for this study as it could better differentiate features with similar spectral properties like build-up land, quarries and other mining areas when compared to unsupervised classification. There was a significant loss of vegetation and increase in granite quarries between the year 1998 and 2015. It can be concluded that granite quarries like any other mining activity, has the potential to impact the environment negatively.
7. REFERENCES
Ashmole, I. and Motloung, M. (2008a) ‘Dimension stone: the latest trends in exploration and production technology.’, in Proceedings of the International Conference on Surface Mining. Johannesburg: Southern African Institude of Mining and Metallurgy, pp. 35–70.
Ashmole, I. and Motloung, M. (2008b) ‘Reclamation and
Environmental Management in’, in Chalenges, Technology,
Systems and Solutions Papers. Proceedings of International Conference on Surface Mining. Journal of the Southern African Institute of Mining and Metallurgy, pp. 155–178.
Bonifazi, G., Cutaia, L., Massacci, P. and Roselli, I. (2003) ‘Monitoring of abandoned quarries by remote sensing and in situ
surveying’, Ecological Modelling, 170(2–3), pp. 213–218.
Borana, S. L., Yadav, S. K., Parihar, S. K. and Palria, V. S. (2014) ‘Impact analysis of sandstone Mines on Environment and LU/ LC features using Remote Sensing and Gis Technique : A case
study of the Jodhpur City , Rajasthan , India’, Journal of
Environemntal Research and Development, 8(3), pp. 796–804.
Cracknell, A. P. and Hayes, L. (2007) Introduction to remote sensing. Boca Raton, New York: CRC Press.
DMR (2015) South Africa’s Mineral Industry. Department of Mineral Resources . South Africa. Pretoria, South Africa. Available at: http://www.dmr.gov.za/publications/south-africas-mineral-industry-sami.html (Accessed: 28 September 2016).
Hartman, H. L. and Mutmansky, J. M. (2002) Introductory Mining Engineering. Hoboken, New Jersey: John Wiley & Sons.
Hu, Q., Wu, W., Xia, T., Yu, Q., Yang, P., Li, Z. and Song, Q.
(2013) ‘Exploring the use of google earth imagery and object
-based methods in land use/cover mapping’, Remote Sensing,
5(11), pp. 6026–6042.
Khan, K. J., Jadoon, G. and Zaman, K. (2014) ‘Production
improvement plans for dimension stone quarrying: A case study of granite mine of kyber Pakhtunkhwa Province of Pakistan’, World Applied Sciences Journal, 29(2), pp. 262–270.
Kinnaird, J. (2005) ‘The Bushveld large igneous province’.
Available at:
http://www.largeigneousprovinces.org/sites/default/files/Bushve ldLIP.pdf (Accessed: 28 September 2016).
Koruyan, K., Deliormanli, a. H., Karaca, Z., Momayez, M., Lu, H. and Yalçin, E. (2012) ‘Remote sensing in management of
mining land and proximate habitat’, Journal of the Southern
African Institute of Mining and Metallurgy, 112(7), pp. 667–672.
Lamb, A. D. (2000) ‘Earth Observation technology applied to mining -related environmental issues’, Transactions of the Institution of Mining and Metallurgy, 109, pp. 152–156.
Lamprecht, A. J. H., Cilliers, S. S., Götze, A. R. and Du Toit, M. J. (2011) ‘Phytosociological description of norite koppies in the Rustenburg area, North-West Province and refinement of the distribution of the Norite Koppies Bushveld on the national
vegetation classification map of South Africa’, Bothalia, 41(2),
pp. 327–339.
Landis, J. R. and Koch, G. G. (1977) ‘The measurement of
observer agreement for categorical data.’, Biometrics, 33(1), pp.
159–174.
Latifovic, R., Fytas, K., Chen, J. and Paraszczak, J. (2005) ‘Assessing land cover change resulting from large surface mining
development’, International Journal of Applied Earth
Observation and Geoinformation, 7(1), pp. 29–48.
Lillesand, T., Kiefer, R. W. and Chipman, J. (2014) Remote Sensing and Image Interpretation. 7th edn. New York: John Wiley & Sons.
Liu, C. C., Sousa Jr, M. A. and Gopinath, T. R. (2000) ‘Regional Structural Analysis by Remote Sensing for Regional Structural Analysis by Remote Sensing for Mineral Exploration , Paraiba State , Northeast Brazil’, Geocarto International, 15(1), pp. 70– 77.
Loveland, T. R. and Dwyer, J. L. (2012) ‘Landsat: Building a
strong future’, Remote Sensing of Environment. Elsevier B.V.,
122, pp. 22–29.
Maponga, O. and Munyanduri, N. (2001) ‘Sustainability of the
dimension stone industry in Zimbabwe—challenges and
and Rieradevall, J. (2014) ‘Life cycle inventory analysis of granite production from cradle to gate’, International Journal of Life Cycle Assessment, 19(1), pp. 153–165.
Mouflis, G. D., Gitas, I. Z., Iliadou, S. and Mitri, G. H. (2008) ‘Assessment of the visual impact of marble quarry expansion (1984-2000) on the landscape of Thasos island, NE Greece’, Landscape and Urban Planning, 86(1), pp. 92–102.
Nex, P. A., Kinnaird, J. A., Ingle, L. J., Van Der vyver, B. A. and Cawthorn, R. G. (1998) ‘A new stratigraphy for the main zone of
the Bushveld Complex, in the Rustenburg area’, South African
Journal of Geology, 101(3), pp. 215–223.
Paull, D., Banks, G., Ballard, C. and Gillieson, D. (2006) ‘Monitoring the Environmental Impact of Mining in Remote
Locations through Remotely Sensed Data’, Geocarto
International, 21(1), pp. 33–42.
change using remote sensing and GIS techniques: A case study
of Hawalbagh block, district Almora, Uttarakhand, India’, The
Egyptian Journal of Remote Sensing and Space Science. Authority for Remote Sensing and Space Sciences, 18(1), pp. 77– 84.
Sabins, F. F. (1999) ‘Remote sensing for mineral exploration’, Ore Geol Rev, 14, pp. 157–183.
Singh, M., Evans, D., Friess, D., Tan, B. and Nin, C. (2015)
‘Mapping Above-Ground Biomass in a Tropical Forest in
Cambodia Using Canopy Textures Derived from Google Earth’, Remote Sensing, 7(5), pp. 5057–5076.
Treitz, P. and Rogan, J. (2004) ‘Remote sensing for mapping and monitoring land-cover and land-use change-an introduction’, Progress in Planning, 61(4), pp. 269–279.
Wulder, M. A., White, J. C., Goward, S. N., Masek, J. G., Irons, J. R., Herold, M., Cohen, W. B., Loveland, T. R. and Woodcock, C. E. (2008) ‘Landsat continuity: Issues and opportunities for
land cover monitoring’, Remote Sensing of Environment, 112(3),