www.elsevier.com/locate/jinsphys
Mini-Review
The role of glomeruli in the neural representation of odours:
results from optical recording studies
C. Giovanni Galizia
*, Randolf Menzel
Institut fu¨r Biologie–Neurobiologie, Fachbereich Biologie, Chemie, Pharmazie, Freie Universita¨t Berlin, Ko¨nigin Luise Strasse 28–30, 14195 Berlin, Germany
Received 13 March 2000; accepted 19 June 2000
Abstract
Odours are received by olfactory receptors, which send their axons to the first sensory neuropils, the antennal lobes (in insects) or the olfactory bulb (in vertebrates). From here, processed olfactory information is relayed to higher-order brain centres. A striking similarity in olfactory systems across animal phyla is the presence of glomeruli in this first sensory neuropil. Various experiments have shown that odours elicit a mosaic of activated glomeruli, suggesting that odour quality is coded in an ‘across-glomeruli’ activity code. In recent years, studies using optical recording techniques have greatly improved our understanding of the resulting ‘across-glomeruli pattern’, making it possible to simultaneously measure responses in several, often identifiable, glomeruli. For the honeybeeApis mellifera, a functional atlas of odour representation is being created: in this atlas, the glomeruli that are activated by different odorants are named. However, several limitations remain to be investigated. In this paper, we review what optical recording of odour-evoked glomerular activity patterns has revealed so far, and discuss the necessary next steps, with emphasis on the honeybee. 2000 Elsevier Science Ltd. All rights reserved.
Keywords:Olfactory glomeruli; Antennal lobe; Olfactory bulb; Optical imaging;Apis mellifera; Review
1. Introduction
Sensory stimuli are represented in the nervous system as activity patterns, which often reflect physical proper-ties of the stimulus. Retinotopy and tonotopy in the thalamus and the cortex are well-studied examples. The somatosensory map in the cortex is another example. The world of smell and its neural representation is less well understood. Other than in vision, hearing and touch, the receptors for odorants come in a large number of functional classes. For mammals it is estimated that more than 1000 different receptor types are expressed (Ressler et al., 1994; Vassar et al., 1994), for insects that
Abbreviations:AL, antennal lobe; LFP, local field potential; LN, local interneuron of the antennal lobe; MGC, macroglomerular complex; OB, olfactory bulb; ORN, olfactory receptor neuron; PN, projection interneuron; PTX, picrotoxin; T1 to T6, tract 1 to tract 6 of the antennal nerve; TTX, tetrodotoxin; VSD, voltage-sensitive dye.
* Corresponding author. Tel.: +49-30-838-56454; fax: + 49-30-838-55455.
E-mail address:[email protected] (C.G. Galizia).
0022-1910/00/$ - see front matter2000 Elsevier Science Ltd. All rights reserved. PII: S 0 0 2 2 - 1 9 1 0 ( 0 0 ) 0 0 1 0 6 - 2
number is probably well below 100 (Clyne et al., 1999; Rubin et al., 2000; Vosshall et al., 1999).
defined: first, the ‘external’ multidimensional stimulus space, i.e. the odour world, which has axes defined by the chemical and physical properties of the odorant mol-ecules. Some of these axes are easy to define, such as carbon chain length for simple hydrocarbons or elec-tronegativity for functional group residues. Molecular resonance frequencies, which are exploited in spectro-scopic analysis, also define a classification system (Turin, 1996). However, any organization of molecules in a multidimensional space is a matter of definition, rather than a natural order. The secondis a biologically defined input space, where each dimension is defined by the response properties of olfactory receptor neurons (ORNs). Its organization depends on the receptor genes expressed, and is thus different in different species. The mapping of the physico-chemical space onto the recep-tive space is the first step in olfactory coding; it can, of course, be subdivided into finer steps, these being the interactions with olfactory binding proteins, the olfactory receptor proteins, transduction and second messenger pathways. The third space consists of the glomerular activity patterns in the AL or OB. This space represents a transformation of the second one, where the neural net-work of the AL or the OB accomplishes the transform-ation. It should be noted that ‘glomerular activity pat-tern’ is a descriptive term with fuzzy boundaries, since it is sometimes used for the activity of the ORNs alone, sometimes for the output from the glomeruli, and some-times for a compound activity of all cells involved. In the fourth and biologically most relevant space, odours are arranged according to their perceptual similarity, i.e. odours that are perceived as being similar are close in the perceptual odour space. In order to experimentally map the position of odours in such a space, and to get a measure of the dimensionality of it, large matrices of mutual odour similarity must be produced and processed with multivariate statistical tools (Schiffman, 1981). Established experimental procedures to behaviourally measure odour similarity can be used for this purpose (Laska et al., 1999a; Laska and Freyer, 1997; Laska and Teubner 1998, 1999).
In mammals, the axons of ORNs project in an orderly and highly specific pattern into the primary sensory neur-opil, the OB (Mombaerts et al., 1996; Wang et al., 1998). Here, ORNs that express the same receptor gene all pro-ject into the same glomerulus of each half-OB (Mombaerts, 1996). The expressed receptor gene influ-ences the position of the target glomerulus (Mombaerts et al., 1996; Wang et al., 1998), but it is unknown whether additional rules define the arrangements of the glomeruli into a functional map of odour representation. In the vomeronasal organ ORNs expressing a particular receptor gene innervate more than one glomerulus (Belluscio et al., 1999; Rodriguez et al., 1999).
In insects, the rules governing receptor innervation of ordinary glomeruli are unknown. The receptor gene
fam-ily ofDrosophila, which was first estimated at more than 100 genes (Clyne et al., 1999; Vosshall et al., 1999), is now believed to consist of 57 genes (Rubin et al., 2000). This compares to about 43 glomeruli (Laissue et al., 1999), which presents the possibility that some glomeruli are innervated by more than one type of ORN. Further-more, on the maxillary palp there are six physiological response types of ORNs, housed as three stereotyped pairs in the sensilla (de Bruyne et al., 1999). If these innervate only three glomeruli of the AL (Stocker, 1994), that would suggest a numerical relationship of 2:1; however, the glomeruli innervated by receptors from the maxillary palp may also be five (Singh and Nayak, 1985).
In order to understand the olfactory code, it is neces-sary to understand the rules of glomerular organization both at the neuroanatomical and functional level. Neu-roanatomical data based on the selective staining of receptor molecule expression in ORNs are being accumulated for the mammalian system (Bulfone et al., 1998; Mombaerts et al., 1996; Tsuboi et al., 1999; Wang et al., 1998), and will soon also be available for insects (Clyne et al., 1999; Vosshall et al., 1999). However, tracing studies and single cell markings still provide the main basis upon which neuroanatomical data are based in insects. For example, in the macroglomerular complex (MGC) of the heliothine moth Heliothis virescens, the glomerular projection patterns and physiological response profiles of both ORNs and projection neurons (PNs) have been mapped (Berg et al., 1998; Vickers et al., 1998). Functional studies of odour-induced activity patterns in the OB and AL have recently added insight into the organization of the first olfactory neuropil (see Table 1).
2. Optical imaging of glomerular activities
Table 1
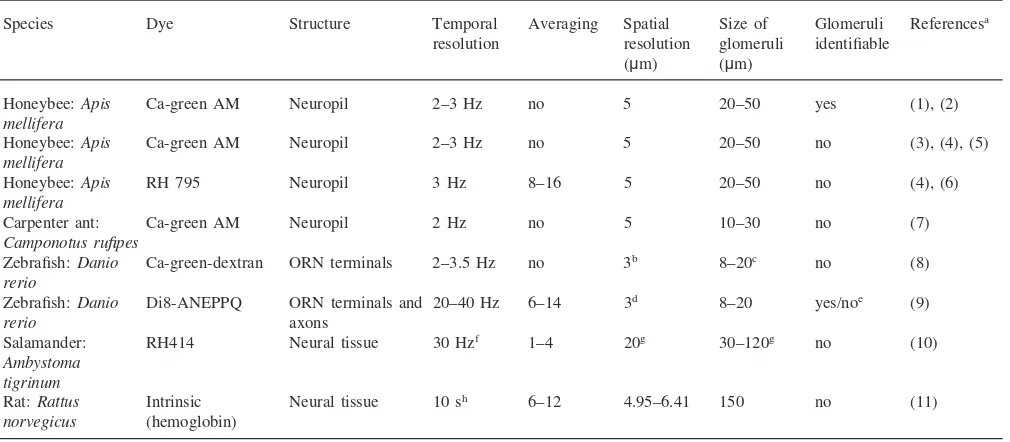
Summary of imaging studies of the olfactory bulb or the antennal lobe, in which spatial activity patterns of glomeruli were recorded as responses to olfactory stimuli
Species Dye Structure Temporal Averaging Spatial Size of Glomeruli Referencesa
resolution resolution glomeruli identifiable (µm) (µm)
Honeybee:Apis Ca-green AM Neuropil 2–3 Hz no 5 20–50 yes (1), (2)
mellifera
Honeybee:Apis Ca-green AM Neuropil 2–3 Hz no 5 20–50 no (3), (4), (5)
mellifera
Honeybee:Apis RH 795 Neuropil 3 Hz 8–16 5 20–50 no (4), (6)
mellifera
Carpenter ant: Ca-green AM Neuropil 2 Hz no 5 10–30 no (7)
Camponotus rufipes
Zebrafish:Danio Ca-green-dextran ORN terminals 2–3.5 Hz no 3b 8–20c no (8) rerio
Zebrafish:Danio Di8-ANEPPQ ORN terminals and 20–40 Hz 6–14 3d 8–20 yes/noe (9)
rerio axons
Salamander: RH414 Neural tissue 30 Hzf 1–4 20g 30–120g no (10)
Ambystoma tigrinum
Rat:Rattus Intrinsic Neural tissue 10 sh 6–12 4.95–6.41 150 no (11)
norvegicus (hemoglobin)
a(1) Sachse et al., 1999; (2) Galizia et al., 1999a; (3) Joerges et al., 1997; (4) Galizia et al., 1997; (5) Galizia et al., 1998. (6) Galizia et al.,
2000; (7) Galizia et al., 1999c; (8) Friedrich and Korsching, 1997; (9) Friedrich and Korsching, 1998; (10) Cinelli et al., 1995; (11) Rubin and Katz, 1999.
b Images were taken with the 20× objective, and 128×128 or 170×170 resolution. Assuming a field of view of about 460µm×460µm, this
gives a spatial resolution or 2.5–3.5µm. In some cases, the 40×objective was used, giving a spatial resolution of 1.3–2µm. 1.33µm in Fig. 2C.
cFrom Fig. 2C, Fig. 3C (8). Signals were prominent in the ‘lateral chain’, which is not as clearly parcellated into glomeruli as many other
regions of the OB. The authors therefore refer to ‘glomerular modules’.
d Resolution differed in individual measurements between 1.33 and 10µm.
eIn this study, some glomeruli were clearly identifiable on the basis of their responses. f Sometimes 60 Hz were achieved.
g J. Kauer, personal communication.
h Images were acquired at video rate, but analysed in 10-s blocks.
to be killed after a single and long-lasting stimulation, and therefore only one map of a chronic sensory stimulation can be created from each individual, thus losing temporal information and precluding within-animal comparisons.
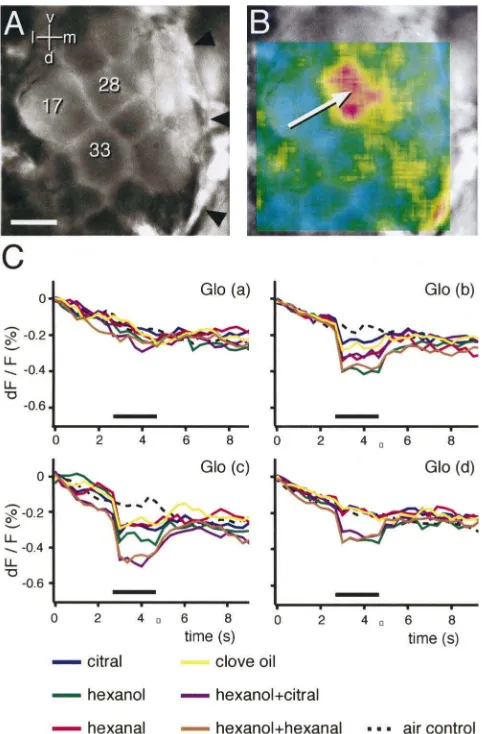
Optical recording techniques have been developed to overcome these problems. Changes of intrinsic signals, due to different oxygenation levels of haemoglobin in active and non-active brain regions, were used in the rat OB (Rubin and Katz, 1999). Intrinsic signals were also measured in honeybee AL (Lieke, 1993). Voltage-sensi-tive dyes (VSDs) have given good results in salamanders (Cinelli et al., 1995; Kauer et al., 1987; Kauer, 1991), zebrafish (Friedrich and Korsching, 1998), frogs (Shah et al., 1999), turtles (Lam et al., 2000) and molluscs (Kleinfeld et al., 1994). In some of these studies the sig-nals were not related to the glomerular units (Delaney et al., 1994; Gelperin et al., 1996; Gervais et al., 1996; Lieke, 1993; Shah et al., 1999). In honeybees, staining with VSDs allows the glomerular layout to be recog-nized very clearly in the staining pattern (Galizia et al. 1997, 2000); this shows that the activity patterns are indeed of glomerular origin, i.e. that the boundaries of
highly active regions coincide with the boundaries of individual glomeruli (Fig. 1).
inter-Fig. 1. Imaging voltage-sensitive dyes in the AL of the honeybee. Optical recording of odour-evoked responses in the antennal lobe of the honeybee using voltage-sensitive dyes. (A) Staining with the RH795 dye gives a clear view of the glomerular structure of the AL. Scale bar is 50 µm. Arrowheads indicate the limits of the AL. d, dorsal; v, ventral; l, lateral; m, medial. Three glomeruli are marked with their identity: ‘28’ (T1-28), ‘17’ (T1-17), ‘33’ (T1-33). (B) Same view as in A, but with a superimposed false colour-coded activity map of the response to hexanal. Red indicates strong membrane depolarization; blue indicates no change in membrane potential. Only part of the view field has been activity-measured in this experiment. The glomerulus with the strongest response is marked with an arrow. This is glomerulus T1-28, which is the glomeru-lus which also shows the strongest response to hexanal in calcium imag-ing (Fig. 3). A and B adapted from Galizia et al. (1997). (C) Examples of response curves to odours and binary mixtures for four glomeruli in a single individual. Different individual from A and B. The curves show the changes in relative fluorescence (DF/F) in % over time (s) in an average of eight consecutive stimulations. The bar indicates the odour stimulus (2 s). Fluorescence decreases continually due to dye bleaching. Membrane depolarization leads to reduced fluorescence (the curve drops). Note that different glomeruli show different response properties in terms of both single-odour response and odorant mixtures. (a) No response to any of the tested odours. (b) Response to all odours; strongest response to hexanol (green curve). Odorant mixtures give a response equal to that of the largest component. (c) Responses to mixtures correspond to the sum of the components (purple and brown curve). (d) Glomerulus selective to hexanol (green curve), with no response to the other odours tested, responds to both binary mixtures containing hexanol with the same response as to the single component. Adapted from Galizia et al. (2000).
neurons (LNs), projection interneurons (PNs) and poss-ibly glial cells was measured.
This review focuses on optical imaging studies where ‘general’ odours (as opposed to sexual pheromones) were used as stimuli. Studies where electrical stimu-lations were used to analyse the olfactory pathway are not included. Table 1 gives a summary of studies pub-lished so far, in which odour-evoked activity patterns could be related to glomeruli. The main results from these studies are the following (see also the figures with examples from the honeybee, Apis mellifera):
1. Each odour evokes activity in several glomeruli, and each glomerulus participates in the evoked pattern of several odours. Different odours elicit different patterns (Figs. 1 and 2). This observation is common to all studies in Table 1, irrespective of the species used, and confirms several studies which mapped odour responses using radioactive markers (see above). The variability between repeated odour stim-uli is low (Galizia et al., 1998). This confirms that odours are coded in an ‘across-glomeruli’ pattern, as has long been shown on the basis of several studies in various species (Hildebrand and Shepherd, 1997; Mori et al., 1999). The ‘across-glomeruli’ pattern in the AL or the bulb is probably translated into an ‘across-fibre’ pattern in the PNs or mitral/tufted cells. The ‘read-out system’, i.e. higher-order brain centres, must have access to the whole pattern, because the individual glomeruli are not sufficient for odour identification (but see below for a dis-cussion of the redundancy in this code).
2. The response intensity is graded (Figs. 1, 3 and 4), both for the same odour, where stimulus concen-tration is reflected in stronger excitation, and for dif-ferent odours, where one glomerulus with a weak response for one odour may well give a strong response to stimulation with another odour (Cinelli et al., 1995; Friedrich and Korsching, 1997; Joerges et al., 1997; Rubin and Katz, 1999).
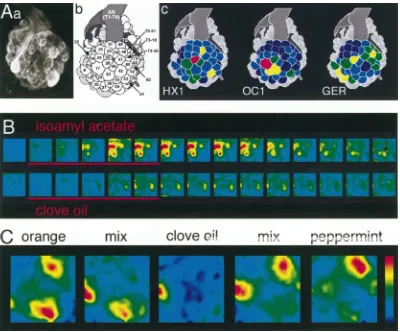
pro-Fig. 2. Calcium imaging of odour-evoked activity in the honeybee AL. Optical recording of odour-evoked responses in the antennal lobe of the honeybee using calcium-sensitive dyes. (A) (a) Confocal reconstruction of the AL, obtained as extended focus of confocal sections from a preparation where receptor cell axons have been fluorescently labelled. The antennal nerve points up. (b) schematic view of the AL, with those glomeruli labelled which have so far been identified in optical imaging studies of odour-evoked activity. (c) False-colour-coded response patterns as obtained from averaging the responses in several animals, and displayed using a schematic view of the AL. Responses to 1-hexanol (HX1,n=21), 1-octanol (OC1,n=21) and geraniol (GER,n=9). Response strength is coded in five steps (red–yellow–green–blue–dark blue, see bar in Fig. 4); grey glomeruli could not be physiologically mapped. The spatial patterns of the perceptually more similar odours octanol and hexanol have more of the activity pattern in common with each other than either does with geraniol, though there is some overlap between the three. Based on data from Galizia et al. (1999a), compare with Fig. 4. (B) Temporal sequence of activity. Two frames per second, with the red bar giving the stimulus period. Both sequences are shown with the false-colour map scaled to the same range. Note the strong and spatially more widespread response to isoamyl acetate, and the later and weaker response to clove oil, which is limited to two non-contiguous glomeruli, one to the middle of the left margin, one to the middle of the right margin of the field of view. Also note that the response to isoamyl acetate is temporally complex: the pattern still active at the end of the sequence is not identical to the initial activity pattern, and includes an additional glomerulus (arrow). (C) Mixture interactions show additive and inhibitory effects. Responses to orange, clove oil and peppermint are shown with the responses to two of their binary mixtures in between them. Note that the response pattern to clove oil+peppermint corresponds to the sum of the components, whereas the response to orange+clove oil lacks the upper glomerulus which is part of the response to orange. Far right: sequence of colours for B and C.
ducing blend-specific excitation patterns (Joerges et al., 1997).
4. The representation of odours is symmetrical in the right and the left AL. This has been shown in honey-bees by statistically comparing the response varia-bility for repeated stimulation in one AL with the variability between right and left AL (Galizia et al., 1998). Therefore, rules leading to the functional identity of a glomerulus in development are equal on the two body sides, suggesting that these rules are genetically encoded.
5. Patterns are equal between individuals, which means that the code is conserved within a species.
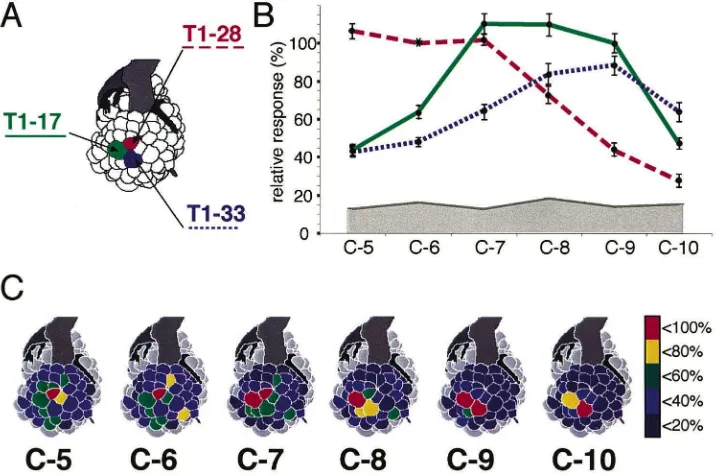
Fig. 4. Increasing alcohol chain length leads to a shift of the activity pattern. (A) Schematic view of the honeybee AL. The names of three glomeruli are given (T1-17, T1-28, T1-33). (B) Response curves of the three glomeruli given in A to a series of homologous alcohols from C5 (1-pentanol) to C10 (1-decanol). Response to hexanol in T1-28 is set to 100% for standardization (asterisk). Note that each glomerulus has a broad response profile. (C) Spatial patterns of the responses to a homologous series of aliphatic alcohols from C5 (1-pentanol) to C10 (1-decanol). Averaged data, false-colour coded on a schematic view of the honeybee AL. Response strength is coded in five steps (red–yellow–green–blue– dark blue, see colour bar at right), grey glomeruli could not be physiologically mapped. The strongest response to 1-decanol is in T1-33, with a weaker response in T1-17. As the carbon chain shortens, activity shifts along the series T1-33, T1-17, and T1-28. Note that here six chemical substances which can be ordered on the basis of their physical properties are processed in a series of three glomeruli, i.e. only half as many. However, the spatial representation of aliphatic alcohols is not limited to these three glomeruli, because other glomeruli also respond to these stimuli. Adapted from Galizia and Menzel (2000) and Sachse et al. (1999).
responses were equal between individuals (Friedrich and Korsching, 1998). In honeybees, glomeruli can be morphologically identified using a three-dimen-sional, digital atlas of the AL (Galizia et al., 1999b). This is possible because in many insects individual glomeruli have characteristic shapes, sizes and rela-tive positions, thus making them readily identifiable (Flanagan and Mercer, 1989a; Laissue et al., 1999; Rospars, 1988; Rospars and Hildebrand, 1992). In this way, glomerular identification was based on independent data from their physiological response profile. We showed that responses are equal within the species at the level of identified glomeruli; it was possible to predict, from the observed glomerular activity patterns, the odour which elicited the pattern with an accuracy of over 85% (Galizia et al., 1999a). This extends the finding of bilateral symmetry and corroborates the interpretation that the physiological identity of individual glomeruli may be genetically determined. Homologous glomeruli in different indi-viduals have the same molecular response profile, and by measuring such profiles it is possible to cre-ate a functional atlas of odour representations in the AL of honeybees (Fig. 3). Nevertheless, there is also variability between individuals, indicating that not all is hardwired in the AL. Indeed, learning can
influence odour representation in the AL (see point 10, below).
humans (Laska et al., 1999b; Laska and Freyer, 1997; Laska and Teubner 1998, 1999). This indi-cates that the transformation from the multidimen-sional odour space in the antennal lobe to the percep-tive space may keep the topology intact, at least for aliphatic hydrocarbons.
Note, however, that at least some receptor cells are not broadly tuned, but respond with high selec-tivity to only a few compounds if stimulated with biologically relevant volatiles at low concentrations, as demonstrated by linked gas chromatography– electrophysiology (Blight et al., 1995; de Bruyne et al., 1999; Imamura et al., 1992; Malnic et al., 1999; Røstelien et al., 2000; Tømmera˚s and Mustaparta, 1987). Future research will have to evaluate the neu-ral strategies underlying processing of highly spe-cific and more general chemosensory input.
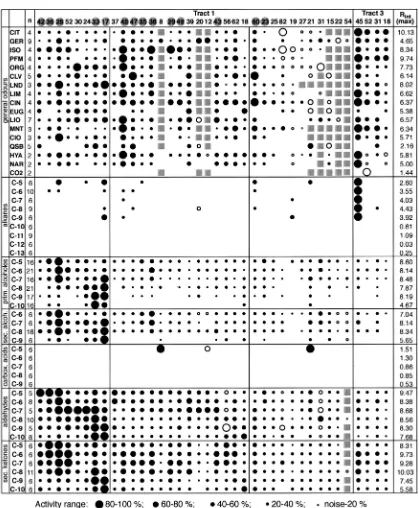
7. In honeybees, there may not be particular glomeruli for functional groups (Sachse et al., 1999). When tested for different functional groups (aldehydes, ketones, alcohols, carbon acids and alkanes), glo-meruli preferentially responded to one functional group rather than to another. However, these glo-meruli always also responded to other functional groups, even though that response was weaker. Fur-thermore, they always had a particular preferred range of carbon chain lengths to which they responded. Therefore, the response profile of indi-vidual glomeruli is not determined by functional groups, such as ‘ketone group’ or ‘aldehyde group’, and the olfactory code is not a building set, where 1-heptanol would be coded in the ‘alcohol glomeru-lus’ plus the ‘C7 aliphatic chain glomeruglomeru-lus’. Rather, response profiles are best described as broadly tuned to the whole ‘best molecule’: for example, glomeru-lus T1-17 best responds to 1-heptanol, but is also activated by other alcohols with similar carbon chain length, as well as ketones and aldehydes of the same carbon chain-length range (Figs. 3 and 4B). This shows the importance of an across-glomeruli code: from the activity of T1-17 alone, it is not possible to distinguish a weak stimulation with 1-heptanol from a strong stimulation with heptanone. By means of a comparison with the other glomeruli this identi-fication is, however, unambiguous.
This is in contrast to what has been proposed for rats (Johnson et al., 1998), where 2DG measure-ments suggest that the identity of the odorant may be determined by a simultaneous decoding of the combination of molecular features represented in the glomerular layer. These features have been called odotopes (Shepherd, 1987). No imaging data of dif-ferent functional groups are available from rats so far.
8. The spatial arrangement of glomeruli is related to their response profile for some glomeruli. When
zebrafish are stimulated with different amino acids, the response patterns in the OB cluster into four groups for amino acids with common molecular fea-tures: basic, acidic, neutral with short aliphatic resi-dues and neutral with long non-polar resiresi-dues (Friedrich and Korsching, 1997). This clustering was confirmed using factor analysis, showing that ORNs with similar response properties tend to innervate adjoining regions of the bulb. In honeybees, glom-erulus T1-17 preferentially responds to 1-heptanol (Fig. 4). Its direct neighbours, T1-28 and T1-33, preferentially respond to 1-pentanol and 1-nonanol, respectively (Sachse et al., 1999). In mammals, close mitral cells have similar response profiles (Mori et al., 1992). In rats, using a homologous series of ali-phatic carbon acids as stimuli, a similar shift was found using 2DG (Johnson et al., 1999). This has not yet been confirmed in imaging studies (Rubin and Katz, 1999), possibly because the relevant part of the OB was not within the area that was imaged. Close neighbourhood may reflect an optimal spatial arrangement for a lateral inhibition mechanism to sharpen broadly tuned response profiles, which would result in a sharper tuning of the responses in PNs. Such a mechanism has been shown in rabbit mitral cells (Katoh et al., 1993; Yokoi et al., 1995). However, this is not a general rule. The odour-spe-cific glomerular activity patterns are generally dis-tributed, i.e. in most response patterns there are sev-eral activated glomeruli which are not direct neighbours, as can be seen in almost any spatial activity map from the references listed in Table 1. In insects, LNs interconnect glomeruli from wide areas of the AL; therefore, physically distant glo-meruli may also be physiological neighbours. 9. The olfactory code is redundant. Rats have been
though it does not prove that the animal makes use of it.
10. In honeybees, associative learning of odours leads to changes in the glomerular activity pattern for the learned odour. Activity patterns evoked by two odours were measured in the naive bee, and then one odour was trained in an appetitive classical con-ditioning paradigm, while the other was presented without reward. After this differential conditioning, the rewarded odour led to a response pattern with increased activity, and this pattern was less corre-lated with that of the non-rewarded odour than before training (Faber et al., 1999). Interestingly, in intracellular recordings of PNs, an increased fre-quency was found in the response to an odour after single-trial appetitive training (Abel, 1997). Thus, the across-glomerular and across-fibre code is not stereotypical, but plastic. The range of plasticity, however, appears to be rather narrow, because only subtle differences were found in both the glomeruli and PNs as a consequence of learning. Nevertheless, these findings show that within the stereotype spec-ies-specific glomerular code (see above, point 5), there is a plastic component. They corroborate the observation that the AL houses an olfactory memory trace, and this trace can control learned olfactory behaviour (Hammer and Menzel, 1998). It is yet unknown whether the olfactory memory in the AL develops under the feedback control of the MB, another site of olfactory memory (Menzel and Mu¨ller, 1996), and whether the contents of the mem-ory traces in the AL and MB are different.
Developmental plasticity has also been shown for odour representation in the vertebrate bulb using 2DG staining. Early learning of an odour (peppermint from postnatal day 1 to 18) led to increased 2DG uptake and c-fos-expression in the posterior half of the midlateral portions of the OB (Johnson et al., 1995; Johnson and Leon, 1996). Interestingly, some areas responding to peppermint were not enhanced following the early learning pro-cedure, suggesting that not the entire response pat-tern but a selected subpatpat-tern is affected. Further-more, early learning also led to morphological changes, in that the plastic glomeruli increased in size (Woo et al., 1987). Morphological plasticity has also been shown in honeybee ALs: individually identified glomeruli change in relative size depending on the task of the worker bee in the hive (Sigg et al., 1997; Winnington et al., 1996). 11. The glomerular activity patterns are dynamic.Each
odour does not only elicit a static pattern that is switched on or off depending on the presence of the odour. Rather, the representation of an odour is a spatio-temporalpattern (Fig. 2C). We found that the difference between the representations of two odours
increased within the 2 s of stimulus presentation, which suggests that odour representations became more characteristic over time (Galizia et al., 2000). Thus, interglomerular connections sharpen the spa-tial response patterns. In optical recording studies of the OB with VSDs and higher temporal resolution, complex response patterns consisting of a brief, small hyperpolarization, followed by a period of depolarization, and then a longer-lasting hyperpolar-ization can be observed in salamander (Cinelli et al., 1995) but not in zebrafish (Friedrich and Korsching, 1998). Since in the experiments with zebrafish only the ORNs were stained, but in salamander all cells of the bulb contributed to the signal, these complex response patterns are likely to originate in the bulb network. Indeed, similar response patterns are reported for PNs in moths and salamander (Christensen et al. 1996, 1998; Hamilton and Kauer, 1989). The role of temporal patterns in odour responses is discussed below.
are those innervated by the antennal tracts T1 to T4, respectively. There are about 70 glomeruli each in the T1 and T3 groups, and 7 each in T2 and T4).
Ants also have a well-developed intraspecific communication system based on pheromones, which they use to communicate food-sources, trails, alarm, and so on (Ho¨lldobler and Wilson, 1990). In the ALs of the antCamponotus rufipeswe compared activity elicited by environmental odours and by non-sexual pheromone substances, and were able to show that some glomeruli are activated by both substance groups, suggesting that—as in bees—the two sys-tems overlap in this species (Galizia et al., 1999c).
3. Unanswered questions when interpreting optical imaging data
3.1. Which components contribute to ‘glomerular activity’?
The glomerular activity pattern is at the interface between the primary biological olfactory space (defined by the ORNs) and the perceptive space. In order to understand the function of the AL or OB for the neural representation of odours, it would therefore be ideal to— separately—have access to the activity patterns of ORNs alone (as has been done in zebrafish (Friedrich and Korsching 1997, 1998) and to the output from the glo-meruli (which was so far only successful for single-cell recordings, e.g. Yokoi et al., 1995; Christensen et al., 1996; Christensen and Hildebrand, 1987; Flanagan and Mercer, 1989b; Hamilton and Kauer, 1989; MacLeod and Laurent, 1996; Stopfer and Laurent, 1999; Sun et al., 1993). The transformation between the two is the result of the local network of the bulb or lobe. With exception of the zebrafish work, all imaging studies so far measured composite signals, where all cells partici-pated in the activity patterns. These patterns therefore comprise input, processing activity, and output of the glomerular circuitry. How the compound activities relate to input and output depends on the neuronal wiring, on the relative contribution of the different compartments, and the sensitivity of the optical signal.
Focusing on neuronal wiring, let us consider the sim-plest case: each glomerulus would receive input from only one family of ORNs, and output neurons would be uniglomerular. In this case, the glomerular input would be an isomorphism of ORN families, and the glomerular output pattern would be an isomorphism of the across-fibre pattern in the output neurons. If the network’s task is to sharpen the glomerular odour representation, and to reduce noise by collecting signals from thousands of ORNs, then the output pattern should be very similar to the input pattern, but sharper, and lacking the weak
glomeruli of the input. In this case, the measured activity maps would broadly mirror the ORN input. In the MGC of the heliothine mothHeliothis virescens, such a scen-ario appears to be realized: response profiles of ORNs to individual glomeruli match those of PNs (Berg et al., 1998; Vickers et al., 1998). However, this match between input and output is not found in other moth species (Anton and Hansson, 1999). Furthermore, since this is an example of a sex-pheromone coding system, it is unknown whether the same rules apply to general odour processing networks.
In insects it is possible that more than one ORN fam-ily innervates individual glomeruli (see Section 1). Fur-thermore, some of the PNs are multiglomerular. There-fore, the isomorphism to glomeruli is broken both on the input and the output side. In addition, LNs interconnect the glomeruli. How does a compound activity pattern comprising all AL cells compare to the output pattern? Glomeruli that are seen to be active in the compound signal may not excite their output neurons for two reasons. First, the glomerulus could receive ORN input (which would be the source the signal measured), but this activity would be inhibited along its way to the out-put neurons. Alternatively, a glomerulus, though not receiving ORN input, could be inhibited by local neu-rons, and the optical signal would monitor this input to the glomerulus from inhibitory cells. Consequently, an activated glomerulus in the compound signal does not guarantee excitation in its output. On the other hand, if the output of a glomerulus is active, there must be active synapses in that glomerulus to activate it, and thus other neurons active in that glomerulus. Therefore, it is unlikely that a glomerulus that appears silent in the com-pound signal contributes to the output pattern. Taken together, these signals may represent an overestimation of the output pattern in terms of participating glomeruli. Another unanswered question relates to the calcium source in calcium imaging studies. How much of the observed calcium concentration increase is due to extra-cellular calcium, and how much comes from intraextra-cellular stores? This question has not been addressed so far.
3.2. Subglomerular compartments
(Schu¨rmann et al., 1989). Consequently, each glomeru-lus is concentrically organized into two subsets, and the cap may serve a different function than the core. In our imaging studies of the worker honeybee, temporal and spatial resolution were not sufficient to analyse a poss-ible within-glomerulus organization of the activity sig-nal. If the cap of a glomerulus—which is the target of the receptor cells—were active just a few milliseconds before the core, this could not be resolved with our tem-poral resolution of 300–500 ms. The limitation in spatial resolution of the glomerular substructure is mainly determined by the reduced focal discrimination, because for each pixel depicting part of a glomerulus, layers above and below the focal plane will add to the signal. This gives a signal that is the compound of the glomeru-lar cap and the core. Thus, data with higher temporal and spatial resolution are necessary. The confocal micro-scope, or the two-photon approach, will be of particular help in studying the functional differences between cap and core.
Core and outer cap may not be the only subcompart-ments of a glomerulus. For example, in honeybees the spatial position of receptor cells along the antenna is also concentrically mapped within the outer cap (Boeckh et al., 1970; Pareto, 1972, C.G. Galizia, unpublished observations). Furthermore, within the glomerulus small modules are detectable, either as dense knots in morpho-logical stainings of ORNs (C.G. Galizia, unpublished observations), or in immunostainings (U. Mu¨ller, per-sonal communication). A subcompartmentalization of glomeruli has also been proposed forDrosophila(Halter et al., 1998). In locusts glomeruli are better described as microglomeruli, with ORNs and PNs often innervating non-adjoining groups of glomeruli (Anton and Hansson, 1996; Ernst et al., 1977). Possibly, glomeruli are not the smallest functional unit of the insect olfactory code.
3.3. Temporal components of the olfactory code
The dynamic aspects of the olfactory code are cer-tainly among the most challenging ones. Not all glo-meruli respond simultaneously at stimulus onset, but rather in a sequence, and the pattern at the end may be different from the initial one (see Fig. 2B). Therefore, odours do not just elicit a fixed pattern but rather a ‘mel-ody’ of activated glomeruli.
Glomerular activity patterns evolve within 2 s after stimulus onset. This leads to a sharper representation of the odours, i.e. the differences in the representation of, say, hexanal and citral are greater 2 s after stimulus onset than right at the beginning of the stimulus (Galizia et al., 2000). Intracellular recordings from AL neurons have also indicated dynamic neural assemblies in the insect AL (Laurent, 1996), which evolve in the range of 2–3 s. However, odour recognition can also be much faster. In behavioural experiments, bees are able to
recognize an odour within 0.5 s (J. Klein, personal communication), but it is not known whether discrimi-nation improves for longer stimuli. Two seconds may be too long for some tasks that the animal has to perform in nature (e.g. in the honeybee discrimination of a hive mate from an intruder, detection of odours eddying from flowers at a distance). On the other hand, two seconds are usually well within the range of olfactory processing when it comes to the task of recognizing an odour and making a final decision close to the odour source. In contrast to floral odours, pheromones may require rapid processing. Moths flying upwind have been shown to respond behaviourally to single pheromone pulses of only a few tens of a millisecond duration (Kaissling, 1997). In moths, some PNs responding to pheromones can follow stimulus pulses up to 10 Hz (Christensen and Hildebrand 1988, 1997; Heinbockel et al., 1999; Lei and Hansson, 1999). The specialized MGC, where ORN responses and glomerular responses indicate a labelled-line system of odour coding, may also have evolved by optimizing temporal resolution. Coding odours in lab-elled lines—as apparent for the coding of sexual phero-mone substances—may allow for higher temporal resol-ution than across-glomeruli coding, because only hardwired and short-ranging inhibitory interactions between subcompartments of the AL are needed. There-fore, for the recognition of floral odours, and possibly also for non-sexual pheromones, more time may be necessary for a firm identification of the stimulus.
spatial representation of odours. Although Stopfer et al. did not find differences on the basis of the spike rate in PNs, we have recently seen effects of PTX on the glom-erular activity patterns (A. Schlick, C.G. Galizia and S. Sachse, unpublished observations). The results from the PTX experiment can also be interpreted in terms of a spatial code hypothesis: two perceptually more similar odours may excite overlapping ORN populations. These project to different glomeruli, which are therefore also activated by both odours (though not necessarily to the same extent). This is particularly apparent with chemi-cally related odours (Fig. 4). If the AL then sharpens the representation (Mori and Yoshihara, 1995) with the aid of interglomerular inhibition (Yokoi et al., 1995), this could be the mechanism—by itself independent of the oscillatory nature of the signal—being disrupted after PTX infusion. More experiments are needed to find out whether odours are coded in temporal or spatial patterns, or in a combination of the two. Ideally, such experiments would involve creating the percept of an odour by arti-ficially eliciting the appropriate temporal (but not spatial) or spatial (but not temporal) pattern.
4. Deciphering the code: what needs to be addressed next
The optical imaging studies reviewed here pose new questions, and more research is needed to solve them. Of course, technical progress will improve the data: improving temporal resolution (mainly limited by the signal-to-noise ratio of the dyes) will allow investigating the relationship between the temporal and the spatial code, better spatial resolution (mainly limited by z-axis resolution, and therefore to be overcome with confocal or two-photon microscopy) will give access to the within-glomerulus organization, selective measurements of particular cell populations (for example, selectively staining PNs, as has been done for ORNs by Friedrich and Korsching) will give access to the components of the olfactory network, more glomeruli measured (mainly limited by the optical access to the structure) will give a more comprehensive picture of the spatial code. Fur-thermore, molecular biology and optical imaging can certainly join forces. For example, labelling glomeruli innervated by ORNs expressing a particular receptor gene with a tauGFP construct in mice and Drosophila will allow glomeruli to be morphologically identified prior to imaging, and allow their specific molecular response profile to be measured. Furthermore, express-ing activity-dependent gene products in selected cell populations should allow the physiological mechanisms involved in olfactory processing to be dissected further using optical imaging.
Finally, it is important to relate the combinatorial code of glomerular activity to odour discrimination, odour
evaluation and the hedonic nature of an odour. A behav-ioural analysis of the perceptual space of the honeybee has been started (Laska et al., 1999a). Discrimination matrices with many odours could be established effec-tively, allowing us to create the necessary data sets for multidimensional scaling methods and factor extraction. The multidimensional representation of odours in per-ceptual space could then be mathematically compared to the multidimensional representation of odours in the glomerular space. Is there an isomorphic function between the two spaces? Together with data from ORNs, it will become possible to describe and interpret the indi-vidual steps of the olfactory code on a neural basis—a far-ranging goal in odour research in general.
5. Note added in proof
The projection patterns of olfactory receptor neurons to the AL has now been described in Drosophila (Vosshall et al., 2000; Gao et al., 2000). The number of known expressed receptor genes is now 41. Each recep-tor neuron is likely to only express a single receprecep-tor gene. Axons from receptor cells expressing the same gene all converge onto a single or two identified glo-meruli in each AL.
Calcium imaging has now also been reported from the Als of the moth Heliothis virescens (Galizia et al., in press); and also from the moth species Spodoptera lit-toralis (Hansson et al., 2000). “Notes added in proof” are too short to report the details.
Acknowledgements
We thank Silke Sachse, Ju¨rgen Rybak, Dirk Mu¨ller, Anke Friedrich, Angelika Rappert, Ulrike Schro¨ter, Dan-iel Wu¨stenberg, Jasdan Joerges and Armin Ku¨ttner for help in the discussions on an earlier version of the manu-script, and Mary Wurm for help with the English.
References
Abel, R., 1997. Das olfaktorische System der Honigbiene: elektrophy-siologische und morphologische Charakterisierung von Antennal-lobus Neuronen und deren Beteiligung beim olfaktorischen Lernen. Ph.D. thesis, Freie Universita¨t Berlin, Berlin.
Anton, S., Hansson, B., 1999. Physiological mismatching between neu-rons innervating olfactory glomeruli in a moth. Proc. R. Soc. Lon-don, Ser. B 266, 1813–1820.
Anton, S., Hansson, B.S., 1996. Antennal lobe interneurons in the desert locustSchistocerca gregaria(Forskal): processing of aggre-gation pheromones in adult males and females. J. Comp. Neurol. 370, 85–96.
Belluscio, L., Koentges, G., Axel, R., Dulac, C., 1999. A map of phero-mone receptor activation in the mammalian brain. Cell 97, 209– 220.
Berg, B.G., Almaas, T.J., Bjaalie, J.G., Mustaparta, H., 1998. The mac-roglomerular complex of the antennal lobe in the tobacco budworm moth Heliothis virescens: specified subdivision in four compart-ments according to information about biologically significant com-pounds. J. Comp. Physiol. A 183, 669–682.
Blight, M.M., Pickett, J.A., Wadhams, L.J., Woodcock, C.M., 1995. Antennal perception of oilseed rape,Brassica napus(Brassicacea), volatiles by the cabbage seed weevil Ceuthorynchus assimilis
(Coeoptera: Curcullionidae). J. Chem. Ecol. 21, 1649–1664. Boeckh, J., Sandri, C., Akert, K., 1970. Sensorische Einga¨nge und
syn-aptische Verbindungen im Zentralnervensystem von Insekten. Z. Zellforsch. 103, 429–446.
Brockmann, A., Bru¨ckner, D., 1995. Projection pattern of poreplate sensory neurones in honey bee worker, Apis mellifera L. (Hymenoptera: Apidae). Int. J. Insect Morphol. Embryol. 24, 405–411.
Bulfone, A., Wang, F., Hevner, R., Anderson, S., Cutforth, T., Chen, S. et al., 1998. An olfactory sensory map develops in the absence of normal projection neurons or GABAergic interneurons. Neuron 21, 1273–1282.
Christensen, T.A., Heinbockel, T., Hildebrand, J.G., 1996. Olfactory information processing in the brain: encoding chemical and tem-poral features of odors. J. Neurobiol. 30, 82–91.
Christensen, T.A., Hildebrand, J.G., 1987. Male-specific, sex phero-mone-selective projection neurons in the antennal lobes of the moth
Manduca sexta. J. Comp. Physiol. A 160, 553–569.
Christensen, T.A., Hildebrand, J.G., 1988. Frequency coding by central olfactory neurons in the sphinx mothManduca sexta. Chem. Senses 13, 123–130.
Christensen, T.A., Hildebrand, J.G., 1997. Coincident stimulation with pheromone components improves temporal pattern resolution in central olfactory neurons. J. Neurophysiol. 77, 775–781. Christensen, T.A., Waldrop, B.R., Hildebrand, J.G., 1998. Multitasking
in the olfactory system: context-dependent responses to odors reveal dual GABA-regulated coding mechanisms in single olfac-tory projection neurons. J. Neurosci. 18, 5999–6008.
Cinelli, A.R., Hamilton, K.A., Kauer, J.S., 1995. Salamander olfactory bulb neuronal activity observed by video rate, voltage-sensitive dye imaging. III. Spatial and temporal properties of responses evoked by odorant stimulation. J. Neurophysiol. 73, 2053–2071. Clyne, P.J., Warr, C.G., Freeman, M.R., Lessing, D., Kim, J., Carlson,
J.R., 1999. A novel family of divergent seven-transmembrane pro-teins: candidate odorant receptors in Drosophila. Neuron 22, 327–338.
Coopersmith, R., Leon, M., 1984. Enhanced neural response to familiar olfactory cues. Science 225, 849–851.
de Bruyne, M., Clyne, P.J., Carlson, J.R., 1999. Odor coding in a model olfactory organ: theDrosophilamaxillary palp. J. Neurosci. 19, 4520–4532.
Delaney, K.R., Gelperin, A., Fee, M.S., Flores, J.A., Gervais, R., Tank, D.W. et al., 1994. Waves and stimulus-modulated dynamics in an oscillating olfactory network. Proc. Natl. Acad. Sci. U. S. A. 91, 669–673.
Delaney, K.R., Hall, B.J., 1996. An in vitro preparation of frog nose and brain for the study of odour-evoked oscillatory activity. J. Neu-rosci. Methods 68, 193–202.
Distler, P.G., Bausenwein, B., Boeckh, J., 1998. Localization of odor-induced neuronal activity in the antennal lobes of the blowfly Calli-phora vicina: a [3H] 2-deoxyglucose labeling study. Brain Res. 805,
263–266.
Eckman, F.H., Freeman, W.J., 1990. Correlations between unit firing and EEG in the rat olfactory system. Brain Res. 528, 238–244. Ernst, K.D., Boeckh, J., Boeckh, V., 1977. A neuroanatomical study
on the organization of the central antennal pathways in insects. II.
Deutocerebral connections inLocusta migratoriaandPeriplaneta americana. Cell Tissue Res. 176, 285–308.
Faber, T., Joerges, J., Menzel, R., 1999. Associative learning modifies neural representations of odors in the insect brain. Nat. Neurosci. 2, 74–78.
Flanagan, D., Mercer, A.R., 1989a. An atlas and 3-D reconstruction of the antennal lobes in the worker honey bee,Apis melliferaL. (Hymenoptera: Apidae). Int J. Insect Morphol. Embryol. 18, 145–159.
Flanagan, D., Mercer, A.R., 1989b. Morphology and response charac-teristics of neurones in the deutocerebrum of the brain in the hone-ybeeApis mellifera. J. Comp. Neurol. 164, 483–494.
Fonta, C., Sun, X.J., Masson, C., 1993. Morphology and spatial distri-bution of bee antennal lobe interneurones responsive to odours. Chem. Senses 18, 101–119.
Free, J.B., 1987. Pheromones of Social Bees. Chapman & Hall, Lon-don.
Friedrich, R.W., Korsching, S.I., 1997. Combinatorial and chemotopic odorant coding in the zebrafish olfactory bulb visualized by optical imaging. Neuron 18, 737–752.
Friedrich, R.W., Korsching, S.I., 1998. Chemotopic, combinatorial, and noncombinatorial odorant representations in the olfactory bulb revealed using a voltage-sensitive axon tracer. J. Neurosci. 18, 9977–9988.
Galizia, C.G., Joerges, J., Ku¨ttner, A., Faber, T., Menzel, R., 1997. A semi-in-vivo preparation for optical recording of the insect brain. J. Neurosci Methods 76, 61–69.
Galizia, C.G., Ku¨ttner, A., Joerges, J., Menzel, R., 2000. Odour rep-resentation in honeybee olfactory glomeruli shows slow temporal dynamics: an optical recording study using voltage sensitive dyes. J. Insect Physiol. 46, 877–886.
Galizia, C.G., McIlwrath, S.L., Menzel, R., 1999b. A digital three-dimensional atlas of the honeybee antennal lobe based on optical sections acquired using confocal microscopy. Cell Tissue Res. 295, 383–394.
Galizia, C.G., Menzel, R., 2000. Odor perception in honeybees: coding information in glomerular patterns. Curr. Opin. Neurobiol. 10, 504–510.
Galizia, C.G., Menzel, R., Ho¨lldobler, B., 1999c. Optical imaging of odour-evoked glomerular activity patterns in the antennal lobes of the antCamponotus rufipes. Naturwissenschaften 86, 533–537. Galizia, C.G., Na¨gler, K., Ho¨lldobler, B., Menzel, R., 1998. Odour
coding is bilaterally symmetrical in the antennal lobes of honeybees (Apis mellifera). Eur. J. Neurosci. 10, 2964–2974.
Galizia, C.G., Sachse, S., Rappert, A., Menzel, R., 1999a. The glom-erular code for odor representation is species-specific in the hone-ybeeApis mellifera. Nat. Neurosci. 2, 473–478.
Galizia, C.G., Sachse, S., Mustaparta, H., in press. Calcium responses to pheromones and plant odours in the antennal lobe of the male and female mothHeliothis virescens. J. Comp. Physiol. A. Gao, Q., Yuan, B., Chess, A., 2000. Convergent projections of
Droso-phila olfactory neurons to specific glomeruli in the antennal lobe. Nat. Neurosci. 3, 780–785.
Gelperin, A., 1994. Nitric oxide mediates network oscillations of olfac-tory interneurons in a terrestrial mollusc. Nature 369, 61–63. Gelperin, A., Kleinfeld, D., Denk, W., Cooke, I.R.C., 1996.
Oscil-lations and gaseous oxides in invertebrate olfaction. J. Neurobiol. 30, 110–122.
Gervais, R., Kleinfeld, D., Delaney, K.R., Gelperin, A., 1996. Central and reflex neuronal responses elicited by odor in a terrestrial mol-lusk. J. Neurophysiol. 76, 1327–1339.
Giurfa, M., 1993. The repellent scent-mark of the honeybeeApis melli-fera ligusticaand its role as communication cue during foraging. Insect Soc. 40, 59–67.
Giurfa, M., Nunez, J.A., 1992. Honeybees mark with scent and reject recently visited flowers. Oecologia 89, 113–117.
increases in c-fos mRNA expression reveal an anatomical ‘unit’ for odor processing in olfactory bulb. Proc. Natl. Acad. Sci. U. S. A. 90, 3329–3333.
Guthrie, K.M., Gall, C.M., 1995. Functional mapping of odor-activated neurons in the olfactory bulb. Chem. Senses 20, 271–282. Halter, S., Laissue, P.Ph., Stocker, R.F., 1998. The complex inner life
of a glomerulus in the antennal lobe of Drosophila. ECRO XIII Siena Proceedings, p. 182.
Hamilton, K.A., Kauer, J.S., 1989. Patterns of intracellular potentials in salamander mitral/tufted cells in response to odor stimulation. J. Neurophysiol. 62, 609–625.
Hammer, M., Menzel, R., 1998. Multiple sites of associative odor learning as revealed by local brain microinjections of octopamine in honeybees. Learn. Mem. 5, 146–156.
Hansson, B.S., Carlsson, M.A., Anton, S., 2000. Olfactory coding in the moth antennal lobe. 13th ISOT and 14th ECRO Brighton, pro-ceedings pp. 107–108.
Heinbockel, T., Christensen, T.A., Hildebrand, J.G., 1999. Temporal tuning of odor responses in pheromone-responsive projection neu-rons in the brain of the sphinx moth Manduca sexta. J. Comp. Neurol. 409, 1–12.
Heinbockel, T., Kloppenburg, P., Hildebrand, J.G., 1998. Pheromone-evoked potentials and oscillations in the antennal lobes of the sphinx mothManduca sexta. J. Comp. Physiol. A 182, 703–714. Hildebrand, J.G., Shepherd, G.M., 1997. Mechanisms of olfactory
dis-crimination: converging evidence for common principles across phyla. Annu. Rev. Neurosci. 20, 595–631.
Ho¨lldobler, B., Wilson, E.O., 1990. The Ants. Springer Verlag, Berlin. Imamura, K., Mataga, N., Mori, K., 1992. Coding of odor molecules by mitral/tufted cells in rabbit olfactory bulb. I. Aliphatic com-pounds. J. Neurophysiol. 68, 1986–2002.
Joerges, J., Ku¨ttner, A., Galizia, C.G., Menzel, R., 1997. Represen-tations of odours and odour mixtures visualized in the honeybee brain. Nature 387, 285–288.
Johnson, B.A., Leon, M., 1996. Spatial distribution of [14
C]2-deoxyg-lucose uptake in the glomerular layer of the rat olfactory bulb fol-lowing early odor preference learning. J. Comp. Neurol. 376, 557–566.
Johnson, B.A., Woo, C.C., Duong, H., Nguyen, V., Leon, M., 1995. A learned odor evokes an enhanced Fos-like glomerular response in the olfactory bulb of young rats. Brain Res. 699, 192–200. Johnson, B.A., Woo, C.C., Hingco, E.E., Pham, K.L., Leon, M., 1999.
Multidimensional chemotopic responses to n-aliphatic acid odor-ants in the rat olfactory bulb. J. Comp. Neurol. 409, 529–548. Johnson, B.A., Woo, C.C., Leon, M., 1998. Spatial coding of odorant
features in the glomerular layer of the rat olfactory bulb. J. Comp. Neurol. 393, 457–471.
Jourdan, F., Duveau, A., Astic, L., Holley, A., 1980. Spatial distri-bution of [14C]2-deoxyglucose uptake in the olfactory bulbs of rats
stimulated with two different odours. Brain Res. 188, 139–154. Kaissling, K.-E., 1997. Pheromone-controlled anemotaxis in moths. In:
Lehrer, M. (Ed.), Orientation and Communication in Arthropods. Birkhauser Verlag, Basel, pp. 343–374.
Katoh, K., Koshimoto, H., Tani, A., Mori, K., 1993. Coding of odor molecules by mitral/tufted cells in rabbit olfactory bulb. II. Aro-matic compounds. J. Neurophysiol. 70, 2161–2175.
Kauer, J.S., 1991. Contributions of topography and parallel processing to odor coding in the vertebrate olfactory pathway. Trends Neuro-sci. 14, 79–85.
Kauer, J.S., Senseman, D.M., Cohen, L.B., 1987. Odor-elicited activity monitored simultaneously from 124 regions of the salamander olfactory bulb using a voltage-sensitive dye. Brain Res. 418, 255–261.
Kleinfeld, D., Delaney, K.R., Fee, M.S., Flores, J.A., Tank, D.W., Gel-perin, A., 1994. Dynamics of propagating waves in the olfactory network of a terrestrial mollusk: an electrical and optical study. J. Neurophysiol. 72, 1402–1419.
Kreissl, S., Eichmueller, S., Bicker, G., Rapus, J., Eckert, M., 1994. Octopamine-like immunoreactivity in the brain and suboesophageal ganglion of the honeybee. J. Comp. Neurol. 348, 583–595. Laissue, P.P., Reiter, CH., Hiesinger, P.R., Halter, S., Fischbach,
K.-F., Stocker, R.K.-F., 1999. Three-dimensional reconstruction of the antennal lobe inDrosophila melanogaster. J. Comp. Neurol. 405, 543–552.
Lam, Y.W., Cohen, L.B., Wachowiak, M., Zochowski, M.R., 2000. Odors elicit three different oscillations in the turtle olfactory bulb. J. Neurosci. 20, 749–762.
Lancet, D., Greer, C.A., Kauer, J.S., Shepherd, G.M., 1982. Mapping of odor-related neuronal activity in the olfactory bulb by high-resol-ution 2-deoxyglucose autoradiography. Proc. Natl. Acad. Sci. U. S. A. 79, 670–674.
Laska, M., Freyer, D., 1997. Olfactory discrimination ability for ali-phatic esters in squirrel monkeys and humans. Chem. Senses 22, 457–465.
Laska, M., Galizia, C.G., Giurfa, M., Menzel, R., 1999a. Olfactory discrimination ability and odor structure–activity relationships in honeybees. Chem. Senses 24, 429–438.
Laska, M., Teubner, P., 1998. Odor structure–activity relationships of carboxylic acids correspond between squirrel monkeys and humans. Am. J. Physiol. 274, R1639–R1645.
Laska, M., Teubner, P., 1999. Olfactory discrimination ability for hom-ologous series of aliphatic alcohols and aldehydes. Chem. Senses 24, 263–270.
Laska, M., Trolp, S., Teubner, P., 1999b. Odor structure–activity relationships compared in human and nonhuman primates. Behav. Neurosci. 113, 998–1007.
Laurent, G., 1996. Dynamical representation of odors by oscillating and evolving neural assemblies. Trends Neurosci. 19, 489–496. Laurent, G., Davidowitz, H., 1994. Encoding of olfactory information
with oscillating neural assemblies. Science 265, 1872–1875. Laurent, G., Naraghi, M., 1994. Odorant-induced oscillations in the
mushroom bodies of the locust. J. Neurosci. 14, 2993–3004. Laurent, G., Wehr, M., Davidowitz, H., 1996a. Temporal
represen-tations of odors in an olfactory network. J. Neurosci. 16, 3837– 3847.
Laurent, G., Wehr, M., MacLeod, K., Stopfer, M., Leitch, B., Davi-dowitz, H., 1996b. Dynamic encoding of odors with oscillating neuronal assemblies in the locust brain. Biol. Bull. 191, 70–75. Lei, H., Hansson, B.S., 1999. Central processing of pulsed pheromone
signals by antennal lobe neurons in the male mothAgrotis segetum. J. Neurophysiol. 81, 1113–1122.
Lieke, E.E., 1993. Optical recording of neuronal activity in the insect central nervous system: odorant coding by the antennal lobes of honeybees. Eur. J. Neurosci. 5, 49–55.
Lu, X.-C.M., Slotnick, B.M., 1998. Olfaction in rats with extensive lesions of the olfactory bulbs: implications for odor coding. Neuro-science 984, 849–866.
MacLeod, K.M., Laurent, G., 1996. Inhibitory mechanisms underlying oscillatory synchronization of projection neurons in the locust olfactory system. Soc. Neurosci. Abstr. 22, 1076–1076.
Malnic, B., Hirono, J., Sato, T., Buck, L.B., 1999. Combinatorial receptor codes for odors. Cell 196, 713–723.
Mellon, D.J., Wheeler, C.J., 1999. Coherent oscillations in membrane potential synchronize impulse bursts in central olfactory neurons of the crayfish. J. Neurophysiol. 81, 1231–1241.
Menzel, R., Mu¨ller, U., 1996. Learning and memory in honeybees: from behavior to neural substrates. Annu. Rev. Neurosci. 19, 379–404.
Mombaerts, P., 1996. Targeting olfaction. Curr. Opin. Neurobiol. 6, 481–486.
Mori, K., 1995. Relation of chemical structure to specificity of response in olfactory glomeruli. Curr. Opin. Neurobiol. 5, 467–474. Mori, K., Mataga, N., Imamura, K., 1992. Differential specificities of single mitral cells in rabbit olfactory bulb for a homologous series of fatty acid odor molecules. J. Neurophysiol. 67, 786–789. Mori, K., Nagao, H., Yoshihara, Y., 1999. The olfactory bulb: coding
and processing of odor molecule information. Science 286, 711– 715.
Mori, K., Yoshihara, Y., 1995. Molecular recognition and olfactory processing in the mammalian olfactory system. Prog. Neurobiol. 45, 585–619 [published erratum appears in Prog. Neurobiol. 46 (1995) 462].
Nunez, J., Almeida, L., Balderrama, N., Giurfa, M., 1997. Alarm pher-omone induces stress analgesia via an opioid system in the hone-ybee. Physiol. Behav. 63, 75–80.
Pareto, A., 1972. Die zentrale Verteilung der Fu¨hlerafferenz bei Arbei-terinnen der Honigbiene Apis mellifera L. Z. Zellforsch. 131, 109–140.
Rappert, A., Sachse, S., Galizia, C.G., Menzel, R., 1998. Represen-tation of odour mixtures and their components in antennal lobes of Apis mellifera: results from chemically related stimuli. Eur J. Neurosci. (Suppl.) 10, 359.
Ressler, K.J., Sullivan, S.L., Buck, L.B., 1994. Information coding in the olfactory system: evidence for a stereotyped and highly organized epitope map in the olfactory bulb. Cell 79, 1245–1255. Rodrigues, V., 1988. Spatial coding of olfactory information in the antennal lobe ofDrosophila melanogaster. Brain Res. 453, 299– 307.
Rodrigues, V., Buchner, E., 1984. [3H]2-deoxyglucose mapping of
odor-induced neuronal activity in the antennal lobes ofDrosophila melanogaster. Brain Res. 324, 374–378.
Rodriguez, I., Feinstein, P., Mombaerts, P., 1999. Variable patterns of axonal projections of sensory neurons in the mouse vomeronasal system. Cell 97, 199–208.
Rospars, J.P., 1988. Structure and development of the insect antenno-deutocerebral system. Int. J. Insect Morphol. Embryol. 17, 243– 294.
Rospars, J.P., Hildebrand, J.G., 1992. Anatomical identification of glo-meruli in the antennal lobes of the male sphinx moth Manduca sexta. Cell Tissue Res. 270, 205–227.
Røstelien, T., Borg-Karlson, A.K., Fa¨ldt, J., Jacobsen, U., Mustaparta, H., 2000. The plant sesquiterpene germacrene D specifically acti-vates a major type of antennal receptor neurons of the tobacco budworm mothHeliothis virescens. Chem. Senses 25, 141–148. Rubin, B.D., Katz, L.C., 1999. Optical imaging of odorant
represen-tations in the mammalian olfactory bulb. Neuron 23, 499–511. Rubin, G.M., Yandell, M.D., Wortman, J.R., Gabor Miklos, G.L.,
Nel-son, C.R., Hariharan, I.K. et al., 2000. Comparative genomics of the eukaryotes. Science 287, 2204–2215.
Sachse, S., Rappert, A., Galizia, C.G., 1999. The spatial representation of chemical structures in the antennal lobe of honeybees: steps towards the olfactory code. Eur. J. Neurosci. 11, 3970–3982. Sallaz, M., Jourdan, F., 1993. C-fos expression and 2-deoxyglucose
uptake in the olfactory bulb of odour-stimulated awake rats. Neuro-Report 4, 55–58.
Sallaz, M., Jourdan, F., 1996. Odour-induced c-fos expression in the rat olfactory bulb: involvement of centrifugal afferents. Brain Res. 721, 66–75.
Schiffman, S.S., 1981. Characterization of odor quality utilizing multi-dimensional scaling techniques. In: Moskowitz, H.R., Warren, C.B. (Eds.), Odor Quality and Chemical Structure. American Chemical Society (ACS) Symposium Series 148. ACS, Washington, DC, pp. 1–21.
Schu¨rmann, F.W., Elekes, K., Geffard, M., 1989. Dopamine-like immunoreactivity in the bee brain. Cell Tissue Res. 256, 399–410. Schu¨rmann, F.W., Klemm, N., 1984. Serotonin-immunoreactive neu-rons in the brain of the honeybee. J. Comp. Neurol. 225, 570–580.
Shah, M., Persaud, K.C., Polak, E.H., Stussi, E., 1999. Selective and reversible blockage of a fatty acid odour response in the olfactory bulb of the frog (Rana temporaria). Cell. Mol. Biol. 45, 339–345. Sharp, F.R., Kauer, J.S., Shepherd, G.M., 1975. Local sites of activity related glucose metabolism in rat olfactory bulb during olfactory stimulation. Brain Res. 98, 596–600.
Shepherd, G.M., 1987. A molecular vocabulary for olfaction. Ann. New York Acad. Sci. 510, 98–103.
Sigg, D., Thompson, C.M., Mercer, A.R., 1997. Activity-dependent changes to the brain and behavior of the honey bee,Apis mellifera
(L.). J. Neurosci. 17, 7148–7156.
Singh, R.N., Nayak, S.V., 1985. Fine structure and primary sensory projections of sensilla on the maxillary palp of Drosophila mel-anogasterMeigen (Diptera: Drosophilidae). Int. J. Insect Morphol. Embryol. 14, 291–306.
Slotnick, B.M., Graham, S., Laing, D.G., Bell, G.A., 1987. Odor detec-tion in rats with lesions of areas identified using the 2-deoxyglucose method. Ann. New York Acad. Sci. 510, 630–631.
Stewart, W.B., Kauer, J.S., Shepherd, G.M., 1979. Functional organi-zation of rat olfactory bulb analysed by the 2-deoxyglucose method. J. Comp. Neurol. 185, 715–734.
Stocker, R.F., 1994. The organization of the chemosensory system in
Drosophila melanogaster: a review. Cell Tissue Res. 275, 3–26. Stopfer, M., Bhagavan, S., Smith, B.H., Laurent, G., 1997. Impaired
odour discrimination on desynchronization of odour-encoding neu-ral assemblies. Nature 390, 70–74.
Stopfer, M., Laurent, G., 1999. Short-term memory in olfactory net-work dynamics. Nature 402, 664–668.
Strausfeld, N.J., Hildebrand, J.G., 1999. Olfactory systems: common design, uncommon origins? Curr. Opin. Neurobiol. 9, 634–639. Sun, X.-J., Fonta, C., Masson, C., 1993. Odour quality processing by
bee antennal lobe interneurones. Chem. Senses 18, 355–377. Tank, D.W., Gelperin, A., Kleinfeld, D., 1994. Odors, oscillations, and
waves: does it all compute? Science 265, 1819–1820.
Teicher, M.H., Stewart, W.B., Kauer, J.S., Shepherd, G.M., 1980. Suckling pheromone stimulation of a modified glomerular region in the developing rat olfactory bulb revealed by the 2-deoxyglucose method. Brain Res. 194, 530–535.
Tømmera˚s, B.A˚ ., Mustaparta, H., 1987. Chemoreception of host vol-atiles in the bark beetleIps typographus. J. Comp. Physiol. A 161, 705–710.
Tsuboi, A., Yoshihara, S., Yamazaki, N., Kasai, H., Asai-Tsuboi, H., Komatsu, M. et al., 1999. Olfactory neurons expressing closely linked and homologous odorant receptor genes tend to project their axons to neighboring glomeruli on the olfactory bulb. J. Neurosci. 19, 8409–8418.
Turin, L., 1996. A spectroscopic mechanism for primary olfactory reception. Chem. Senses 21, 773–791.
Vassar, R., Chao, S.K., Sitcheran, R., Nunez, J.M., Vosshall, L.B., Axel, R., 1994. Topographic organization of sensory projections to the olfactory bulb. Cell 79, 981–991.
Vickers, N.J., Christensen, T.A., Hildebrand, J.G., 1998. Combina-torial odor discrimination in the brain: attractive and antagonist odor blends are represented in distinct combinations of uniquely identifiable glomeruli. J. Comp. Neurol. 400, 35–56.
Vosshall, L.B., Amrein, H., Morozov, P.S., Rzhetsky, A., Axel, R., 1999. A spatial map of olfactory receptor expression in the Droso-philaantenna. Cell 96, 725–736.
Vosshall, L.B., Wong, A.M., Axel, R., 2000. An olfactory sensory map in the fly brain. Cell 102, 147–159.
Wang, F., Nemes, A., Mendelsohn, M., Axel, R., 1998. Odorant recep-tors govern the formation of a precise topographic map. Cell 93, 47–60.
plas-ticity of identified glomeruli in the antennal lobes of the adult worker honey bee. J. Comp. Neurol. 365, 479–490.
Woo, C.C., Coopersmith, R., Leon, M., 1987. Localized changes in olfactory bulb morphology associated with early olfactory learning. J. Comp. Neurol. 263, 113–125.