This art icle was dow nloaded by: [ Universit as Dian Nuswant oro] , [ Ririh Dian Prat iw i SE Msi] On: 29 Sept em ber 2013, At : 20: 31
Publisher: Rout ledge
I nform a Lt d Regist ered in England and Wales Regist ered Num ber: 1072954 Regist ered office: Mort im er House, 37- 41 Mort im er St reet , London W1T 3JH, UK
Accounting and Business Research
Publicat ion det ails, including inst ruct ions f or aut hors and subscript ion inf ormat ion: ht t p: / / www. t andf online. com/ loi/ rabr20
Occupational differentiation and exclusion in early
Canadian accountancy
John Richard Edwards a & St ephen P. Walker a a
Cardif f Business School, Cardif f Universit y, Aberconway Building, Colum Drive, Cardif f , CF10 3EU, UK E-mail:
Published online: 06 Jan 2011.
To cite this article: John Richard Edwards & St ephen P. Walker (2008) Occupat ional dif f erent iat ion and exclusion in early
Canadian account ancy, Account ing and Business Research, 38: 5, 373-391, DOI: 10. 1080/ 00014788. 2008. 9665772
To link to this article: ht t p: / / dx. doi. org/ 10. 1080/ 00014788. 2008. 9665772
PLEASE SCROLL DOWN FOR ARTI CLE
Taylor & Francis m akes every effort t o ensure t he accuracy of all t he inform at ion ( t he “ Cont ent ” ) cont ained in t he publicat ions on our plat form . How ever, Taylor & Francis, our agent s, and our licensors m ake no
represent at ions or warrant ies w hat soever as t o t he accuracy, com plet eness, or suit abilit y for any purpose of t he Cont ent . Any opinions and view s expressed in t his publicat ion are t he opinions and view s of t he aut hors, and are not t he view s of or endorsed by Taylor & Francis. The accuracy of t he Cont ent should not be relied upon and should be independent ly verified w it h prim ary sources of inform at ion. Taylor and Francis shall not be liable for any losses, act ions, claim s, proceedings, dem ands, cost s, expenses, dam ages, and ot her liabilit ies w hat soever or how soever caused arising direct ly or indirect ly in connect ion w it h, in relat ion t o or arising out of t he use of t he Cont ent .
This art icle m ay be used for research, t eaching, and privat e st udy purposes. Any subst ant ial or syst em at ic reproduct ion, redist ribut ion, reselling, loan, sub- licensing, syst em at ic supply, or dist ribut ion in any
1. Introduction
A recent review of the literature on accountancy’s professionalisation has drawn attention to plen-teous studies of the formation, operation and geo-graphical spread of professional bodies in the late-19th and early 20th centuries (Poullaos, 2008). Leading figures within the accountancy profession have also proved a popular subject for study either as individuals (Lee, 1996) or groups (Carnegie et al., 2003). However, a proper under-standing of the accountancy profession post-or-ganisational formation, and the difficulties it has faced such as boundary definition and ‘problemat-ical institutional configurations’, requires a ‘holis-tic frame of reference’ which extends ‘the scope of historical studies to the occupational populace as a whole, beyond the memberships of the elite pro-fessional bodies’ (Edwards and Walker, 2007a: 64, 65; see also Cooper and Taylor, 2000).
A start has been made towards studying entire accounting communities both pre- and post-organ-isational formation. Lee (2007: 333), for example, has drawn attention to the fact that ‘little is known about the community of American accountants
that existed prior to the main foundational events of the 1880s and 1890s’, and his paper is intended to help fill that space. Britain is another country where the emergent accounting occupational group has been the subject of attention: Walker (2002) investigates the social standing of account-ants in certain parts of England in the early-Victorian period; Edwards et al. (2007) examine the creation of a jurisdiction for the public ac-countant in England during the 19th century; Edwards and Walker (2007a) supply a spatial, de-mographic and occupational profile of profession-al and non-professionprofession-al accountants in Britain in 1881.
The present investigation, located in time just two years after the formation of professional bod-ies in Montreal and Toronto, has similaritbod-ies with Edwards and Walker (2007a), given that most ac-countants in each location then remained free from institutional affiliation.1 The Association of Accountants of Montreal, formed on 11 June 1879, secured the CA credential for its members through a charter granted by the Quebec legislature on 24 July 1880 (Collard, 1980: 18), while The Institute of Accountants and Adjusters of Canada, based in Toronto, came into being in December 1879 (Creighton, 1984: 6).2 Numbers for the initial membership of these bodies appear not to be
avail-Accounting and Business Research,Vol. 38. No. 5. pp. 373-391. 2008 373
Occupational differentiation and exclusion
in early Canadian accountancy
John Richard Edwards and Stephen P. Walker*
Abstract—Canada’s 1881 census enumerators posed a range of questions that provide scope for an in-depth inves-tigation of the identity of its accounting functionaries (accountants and bookkeepers) in that year. The significance of our findings is explained by applying the concept of closure through exclusion and occupational differentiation. We discover that Canada’s accounting community, at the dawn of professional organisation, was dominated by peo-ple originating from Great Britain & Ireland. The rural/urban divide for Canada’s accountants is the inverse of that for the population as a whole and, as in Britain, congregation occurs around the major commercial ports. Significant differentiation exists between the demographic profile of Canada’s accounting functionaries compared with its en-tire population and between that of accountants compared with bookkeepers. Strong evidence of exclusionary clo-sure is revealed through an analysis of the demographic characteristics of the initial leaderships of Canada’s early accounting associations. The paper concludes by identifying opportunities for further research.
Keywords: accountants; bookkeepers; closure; census; Canada
*The authors are professors at Cardiff Business School. They are grateful for financial support from the ESRC. The paper is based on research conducted under the project entitled ‘Exclusion and identity. A late 19th century comparative study of accountants’ (Award Reference: RES-000-22-0626). They also wish to thank: Claire Carullo and Paul Mcgeoghan for re-search assistance; Trevor Boyns, Peter Morgan and two anonymous referees for comments on earlier drafts of this paper.
Correspondence should be addressed to: John Richard Edwards, Cardiff Business School, Aberconway Building, Colum Drive, Cardiff, CF10 3EU. E-mail: edwardsjr@ Cardiff.ac.uk
1Qualified accountants comprised just 7.3% (1,189 out of
16,180) of the British accounting community in 1881 (Edwards and Walker, 2007a: 83).
2It was reconstituted as a specialist organisation for
ac-countants called the Institute of Acac-countants, Province of Ontario, in May 1882 (Institute of Accountants, Province of Ontario, 1882), receiving royal assent for its act of incorpora-tion on 1 February 1883.
able (Collard, 1980; Creighton, 1984), but they certainly accounted for a relatively small propor-tion of known accountants and a minute fracpropor-tion of the nation’s accounting functionaries in 1881.
Central to this paper is an examination of the spatial and demographic (nativity, ethnicity, reli-gion and gender) characteristics of those included and, by comparison with the profile of the popula-tion from which they were drawn, those excluded from the accounting occupational group. Given the difference in economic and social status typically enjoyed by accountants and bookkeepers, the data will also be interrogated for evidence of variations in the common characteristics of these two com-ponents of the accounting occupational group. The broader significance of our findings is explained by applying the concept of closure through exclu-sion and occupational differentiation.
The remainder of the paper is organised as fol-lows. First, we consider how the concept of clo-sure can aid our understanding of the shifting occupational landscape inhabited by accounting functionaries in the late-19th century. To contextu-alise our study, we next examine the economic and social environment within which Canada’s ac-counting community became visible. Then we consider the background to the 1881 census, how it was conducted, and the way in which census data has been exploited for the purpose of the pres-ent study. Subsequpres-ent sections contain an in-depth, empirical analysis of the profile of accounting functionaries in Canada, in 1881, so far as these can be discovered from the available census records. In doing so, we identify the characteristics of those who gained admission to the accounting occupational group and, by comparison with the profile of the community as a whole, those des-tined to remain outside. Concluding remarks sum-marise our findings and identify opportunities for further research.
2. Closure in a shifting occupational
landscape
The history and transformation of occupational and professional groups has been the subject of significant study within the sociology literature (Abbott, 1988, ch. 1; Macdonald, 1995, ch. 1). Writers have adopted a range of different and com-peting interpretive lenses (such as critical, ecolog-ical, functionalist, interactionist and positivist) to better understand the history and state of the occu-pational landscape. Their rival explanations, in the market for academic hegemony, intersect in key areas such as occupational trajectory, closure and conflict, though the protagonists sometimes appear unwilling to recognise this to be the case (Macdonald, 1995: 14–17).
Larson (1977: 66) believes that ‘the structure of professions results from two processes: the
process of organisation for a market of services, and a process of collective mobility by which the early modern professions attached status and so-cial standing to their transformed occupational roles’. Randall Collins, who cautions against clas-sifying writers on the basis of theoretical stand-points (Maclean and Yocom, 2000), makes similar points: ‘Instead of seeing occupations as having fixed positions on a market, we see that occupa-tions themselves can become status groups in the realm of work’ (Collins, 1990: 25). The upward trajectory of certain occupational groups produces a history of work marked by a continuously chang-ing landscape and a ‘graveyard’ of failed ‘occupa-tional and professional groups’ due to changes in technology and in the ‘broader organization of so-ciety’ (Krause, 1971: 1–2). Abbott’s (1988: xiii) distinctive paradigmatic framework similarly ‘aims to show [and understand] professions grow-ing, splittgrow-ing, joining and dying’.
To help underpin a strategy of upward trajectory, occupational and professional groups attempt to exploit opportunities for exclusionary closure; see, for example, Richardson (1997) for a closure-based study of the Canadian public accounting profession from the early 19th century through to recent times. A strong and explicit form of closure occurs when the practice of a discipline, e.g. med-icine, is restricted by law to a group of ‘eligibles’. It might also be the case that performance of a specific task (e.g. company audit) is confined to identified practitioners. The ‘critical’ literature on professionalisation is marked by a Weberian-inspired focus on social closure that has highlight-ed the role of organisations (Willmott, 1986) in progressing professional projects through the ex-clusion of undesirable ‘others’, often on the basis of perceived status within an occupational group (Walker, 2004). Such bodies have also used cre-dentials such as CA and CPA to signal fitness to practice to the general public and business com-munity. Often, however, exclusionary closure op-erates in a more subtle manner and not only through the agency of professional organisations.
Macdonald (1995: 28, emphasis added) reports that ‘Weber’s analysis [of occupational trajectory] draws attention to the way in which groups with interests in common, or even people who share a religious belief, or have racial or other character-istics in common, can act in such a way as to cir-cumscribe their membership’ in order to ‘pursue their collective interest’. Whereas early commen-tators such as Previts and Merino (1979: 332) wrote that ‘opportunities for individuals, regard-less of sex, race, religion, or creed, to advance in the ranks of professional accounting and to gain significant status has been characteristic of the [US accountancy] profession from the earliest years’, subsequent ‘students of the accounting profession
374 ACCOUNTING AND BUSINESS RESEARCH
have connected with, and drawn inspiration from, theoretical advances in the historiography and so-ciology of professions’ (Walker, 1999: 1) to prob-lematise the notion of an absence of barriers to entry.
The professionalisation literature on accounting has successfully employed the concept of social closure3 to demonstrate inter-occupational differ-entiation between respectable and skilled account-ants on the one hand and ‘counterfeit accountaccount-ants’ on the other (Walker, 2004: 153). Within the same branch of the professionalisation literature, Kirkham and Loft (1993) reveal that demographic characteristics have been formally applied to achieve exclusionary closure on the basis of gen-der, and this has since become an important area of study (e.g. McKeen and Richardson, 1998; Walker, 2003; Khalifa and Kirkham, 2008). However, Davie (2005: 553) has expressed con-cern that, ‘[w]hilst racial and ethnic differentiation and discrimination themes have traversed social science analysis of everyday life, accounting re-searchers have been mostly remarkably silent on such issues’. But some work has been done. Hammond and Streeter (1994) use theories of racism to challenge the idea that public accountan-cy firms in the US have provided equality of op-portunity, while Sian (2006) has shown how, following independence, Kenya’s government en-abled inclusionary usurpation through structural changes in professional organisation designed to transfer leadership from expatriate accountants to African Kenyans. Sian (2006: 297) also points out that ‘more informal sanctioning at various points in a [professional] project (by powerful constituent groups) can also result in exclusion on the basis of race, gender, social class and wealth’. In the cur-rent paper we seek to demonstrate the operation of informal social closure to achieve exclusion through differentiation both within and between the occupational groups of accountants and book-keepers.
Before we embark upon a study of the spatial and demographic characteristics of the accounting community in Canada in 1881, Sections 3–5 re-view the economic and business environment within which Canada’s accounting functionaries worked in the period up to 1881, explain how the census was conducted and outline the research ap-proach that we employ.
3. Economic and business environment
The early development of Canada’s economy is predominantly associated with the fur trade and, in particular, the activities of the Hudson’s Bay Company incorporated in 1670. It is certainly the case that fur was the single most important factor in the initial population of Canada’s interior, but the earliest European settlements arose fromfish-ing off the coast of Newfoundland and Nova Scotia. In the early 19th century, lumber became the dominant staple export to meet the require-ments of a Britain that had exhausted local sup-plies. The timber ships fulfilled a further key role in Canada’s history through the carriage of immi-grants on their return voyage from the British Isles. The timber industry was in turn an important factor in the development of agriculture because, in contrast to the fur trade, the exploitation of woodlands entailed large numbers of people based in a single location for a substantial time-period. These lumber camps and towns needed to be sup-plied with food and other provisions. As the log-gers pushed westwards, farmers followed to form the basis of new communities that often became permanent settlements.
In 1881, almost three-quarters of Canada’s pop-ulation was located in rural areas (Urquhart and Buckley, 1965: 14), and most of the workforce re-mained engaged in farming and other primary in-dustries (Urquhart and Buckley, 1965: 59). Part of the reason for this orientation was because, histor-ically, British mercantilist policies had discour-aged Canada from developing its processing and manufacturing sectors:
‘Under the French and for long under the British regime, it remained the kind of colony that had been envisaged by seventeenth century mercan-tilist philosophers, acting as both a source of raw materials for the Old Country and a market for its manufactures’ (Woodcock, 1989: 315). The repeal of the Corn Laws (1846) gave rise to ‘a cumulative series of political and economic changes in Britain [which] precipitated the aban-donment of the system of colonial preferences’ (Easterbrook and Aitken, 1956: 377). This com-pelled Canadian industry to become more efficient and to try to cultivate new markets, necessitating the development of innovative strategies funda-mental among which ‘was the manipulation of the tariff and the construction of railways’ (Easterbrook and Aitken, 1956: 377). What was later captioned ‘old industrialism’ (Easterbrook, 1959: 77) first appeared in Canada in the form of improvements to the transportation network through canal and railway construction capable of lowering transportation costs and converting the maritime provinces’ seaports into outlets for west-ern trade.
Despite the continued, overwhelming focus on primary industries through to 1881, the economic activities of Canada’s provinces showed
signifi-Vol. 38 No. 5. 2008 375
3Occupation-based cases are of course micro-illustrations
of much broader societal developments where, historically, ‘exclusionary forms typically arose as a result of the conquest of one collectivity by another’ (Murphy, 1988: 219).
cant variation. Staple extraction dominated in the three Maritime provinces – New Brunswick, Nova Scotia, and Prince Edward Island. There, the ‘ex-port of fish, wood, and coal provided the region with exchange to purchase food and manufactured imports from abroad’ (Taylor and Baskerville, 1994: 109). Woodcock (1989: 300) explains the fragmented nature of Canada’s provinces until Confederation (1867):
‘disparate colonies … did not have the social and commercial infrastructures that could pro-duce large cities. On the Atlantic seaboard the Maritime colonies carried on their commercial activities more or less independently of the more inland provinces, to which they had no year-round transportation links until the Intercontinental Railway was completed in 1876. They traded with the United States, Britain and the West Indies rather than with the two Canadian provinces, and acted largely as en-trepôts for trades that were dominated by mer-chants in London.’
The continued focus on trade among the Maritime Provinces was not only a consequence of British trading priorities. As noted above, the British mercantilist philosophy had, by 1881, been long replaced by one of free trade. However, a sus-tained mercantilist orientation was favoured by the indigenous merchant class in leading commercial centres such as Halifax, Nova Scotia and St John, New Brunswick. Initiatives to encourage industri-alisation were resisted by merchants as likely to create unwelcome ‘potential competition in the sense that local production would diminish the flow of imported manufactured goods and thus cut into their profits’ (Taylor and Baskerville, 1994: 112). The industries that were allowed to develop – shipbuilding, lumber, coal and fisheries – did so under the aegis of merchant capital.
The overall level of industrialisation was greater in Ontario and Quebec, but the rural/farming com-munity remained dominant even there. In 1870, two-thirds of all workers in Ontario remained in farming, but ‘old industrialism’ was underway through continued railway building and ongoing improvements to the waterway network linking major urban sites adjacent to the St Lawrence sea-way through to Lake Erie. In 1870, Ontario was home to 51.8% of Canada’s industrial production, much of which was located in Toronto and Hamilton. Businesses were normally small scale; 18,600 of Ontario’s 21,730 industrial establish-ments employed five or fewer workers (Taylor and Baskerville, 1994: 177). There were exceptions, however, with the Grand Trunk and Great Western railways’ repair and locomotive-building plants ‘the first large integrated – manufacturing, trans-portation, communication – industrial corporations
to operate in Canada’ (Taylor and Baskerville, 1994: 180).
Manufacturing activity was also beginning to surface in Quebec by 1870, and it occurred on a more centralised basis than at its western neigh-bour. Thirty-nine of Canada’s top 150 industrial firms were located in Montreal compared with 14 in Toronto. Indeed, Montreal was responsible for 43%, in value, of the province’s industrial output, Quebec City for 9% and all other urban centres just 12%. Some of its businessmen were highly ambitious. By using the latest American steam-powered technology, for example, the Montreal Rolling Mills’ directors hoped to ‘bid defiance to all foreign competition’ (quoted in Taylor and Baskerville, 1994: 223). Such instances remained important exceptions to the continued agrarian focus until the implementation of the National Policy that Sir John A. Macdonald trumpeted dur-ing the federal election of 1878. This was ‘direct-ed towards bringing the Industrial Revolution into Canada and making it something more than a na-tion devoted to the primary industries of farming, fishing, mining and logging’ (Woodcock, 1989: 302; see also McDougall, 1971). To help this process, the government quickly put in place ‘a more complex tariff structure in which particular attention was given to protection of goods which were manufactured or which could be manufac-tured in Canada’ (Easterbrook and Aitken, 1956: 393).
Canada’s two remaining provinces in 1881 – Manitoba and British Columbia – remained re-mote from the Maritime Provinces and the more urbanised areas of the two Canadas. Indeed, they were not part of the initial Confederation; Manitoba being ceded to Canada by the Hudson’s Bay Company in 1870 and British Columbia join-ing in 1871. Both these areas were for many years controlled by the North West Company or the Hudson’s Bay Company, with their economies dominated by the fur trade until the Fraser Canyon Gold Rush of 1858 began to change the character of British Columbia.
From this review, we might conclude that ac-countants and bookkeepers in Canada, in 1881, were unlikely to have been heavily involved in servicing the accounting needs of manufacturing industry either directly, as employees, or indirect-ly as public practitioners.4 Canada was still pre-dominantly a rural-based, agrarian economy, under the control of its wealthy merchants, with its primary industries providing the source of external trade. As the social historian George Woodcock (1989: 305) put it, even ‘Canada’s largest cities
376 ACCOUNTING AND BUSINESS RESEARCH
4Even in 1891, 46% of the workforce was engaged in
agri-culture with just 14% classified as manufacturing and me-chanical workers (Urquhart and Buckley, 1965: 59).
have really been mercantile ones characterised by the concentration of economic power and social function’. The merchants’ wealth and power was expressed in conspicuous consumption. In Montreal, for example, from 1850 onwards, builders began constructing large mansions at the foot of Mount Royal in an area known as the Golden Square Mile as merchant families began to migrate out of Montreal to settle in the suburbs (Rémillard and Merrett, 1987).5
It was within this economic and social context that Canada’s census takers undertook their work in the second half of the 19th century.
4. 1881 Canadian census
The first population census for New France was conducted in 1666 and revealed 3,215 inhabitants of European descent.6An Act of 1851 provided for a census of Canada in 1852, another in 1861 and decennially thereafter (Urquhart and Buckley, 1965: 1). When the British colonies in North America were united under the British North America Act to become the Dominion of Canada in 1867, census taking became a constitutional re-quirement. Also in that year, the Province of Canada was divided into Ontario and Quebec so that each linguistic group (English and French) could have its own geographical identity. As further provinces joined the Confederation – Manitoba (1870), British Columbia (1871) and Prince Edward Island (1881) – they were included in federal census returns.
When planning the 1881 British census, its ad-ministrators commented as follows:
‘The success of the coming Census of the Motherland will be hailed with interest not only by her own people, but by the growing millions in her Colonies across the Atlantic, or in the Southern hemisphere where a like Census is taken to fill up the roll of the English race’ (RG27/5, fol. 43; see also, Goldscheider, 2002: 79–83).
Canada’s ‘like Census’ was held on the same date as its British counterpart – 4 April 1881. Care was taken in the Instructions to Enumerators (1881) to try to ensure their accuracy and to com-bat possible bias, with the enumerator ‘going per-sonally from house to house, and writing in the schedules, in the most scrupulous manner, the an-swers given to the questions arising out of the headings, in order of their numbering’ (http:// www.prdh.umontreal.ca/1881/en/enum.html). Schedule 1, entitled ‘Nominal return of the living’, contained 20 questions, with answers to questions 11–14 central to this study because of their poten-tial for identifying possible bases for occupational differentiation and exclusion. These questions dealt with: country or province of birth, religion, ethnic origin, profession, occupation or trade.7
5. Sources and method
According to Lisa Dillon (2000: 185) of the Institute of Canadian Studies: ‘At the beginning of the twenty-first century, the field of historical de-mography has acquired new energy through the proliferation of historical census micro data proj-ects’. A key first step in improving accessibility to information about Canada’s population occurred when approximately 1,500 volunteers, most of whom were members of The Church of Jesus Christ of Latter-day Saints, extracted Canadian census information from microfilm and photo-copies of the original census forms. A team of ge-nealogists from the Church and the Institute of Canadian Studies ‘cleaned’ the data – a process of standardising names and localities, and organising the material for easy retrieval. The Church re-leased the database as a set of five CD-ROMs (Family History Resource File, FHRF Canada 1881)8in March 2002 and, later that year, the on-line version was made available on the FamilySearch Internet Genealogy Service Web site. The transcribed database contains 4.3 million individuals.
For the purposes of this study, FHRF Canada 1881 was interrogated using the search words ‘ac-countant’ and ‘comptable’ together with possible variations in spelling. This identified 876 individ-uals. Comparable data for the 3,698 bookkeepers (occupation code 33210) were extracted from the database constructed as part of the North Atlantic Population Project (NAPP, 2004). The stated pur-pose of this project is ‘to develop a web-based col-laboration that will maximize the usefulness of these data for understanding the North Atlantic world as it entered [sic] the industrial age’.9
The remainder of this paper presents an in-depth, empirical analysis of the characteristics of ac-counting functionaries in Canada in 1881. Therein, it reveals the potential provided by Canada’s cen-sus records for uncovering socio-demographic characteristics that formed the basis for informal closure practices. We start by examining the pres-ence, and relative incidpres-ence, of accountants and bookkeepers in Canada’s provinces and cities, and then proceed to consider their distribution between
Vol. 38 No. 5. 2008 377
5 A similar pattern of relocation occurred in Britain
(Thompson, 1988: 165).
6 Statistics Canada, http://www.statcan.ca/english/about/
jt.htm.
7It is recognised that census data does not provide an
un-problematic representation of the population (Edwards and Walker, 2007b; Inwood and Reid, 2001; Mills and Schürer, 1996).
8Edwards and Walker (2007b) study the scope and
limita-tions of information about accountants contained in the tran-scribed version of the British census enumeration books for 1881. Many of their findings apply equally to the content of FHRF Canada 1881.
9http://www.nappdata.org/napp/proposal_p2.shtml
378
A
CCO
U
N
T
IN
G
A
N
D
BU
S
IN
E
S
S
RE
S
E
A
RCH
Table 1
Numbers and densities of accountants and bookkeepers in Canada’s provinces in 1881
British Manitoba New Northwest Nova Ontario Prince Quebec Total Columbia Brunswick Territories Scotia Edward Is.
Population 48,885 64,845 321,248 10,978 440,560 1,924,271 108,911 1,358,650 4,278,348
Accountants 33 36 53 0 45 441 54 214 876
ranking 7 6 4 8 5 1 3 2
Per 100,000 68 56 16 0 10 23 50 16 20
ranking 1 2 5= 8 7 4 3 5=
Bookkeepers 43 56 193 4 289 2,051 54 1,008 3,698
ranking 7 5 4 8 3 1 6 2
Per 100,000 88 86 60 36 66 107 50 74 86
ranking 2 3 6 8 5 1 7 4
Ratio: Bookkeepers/Accountants 1.3 1.6 3.6 6.4 4.7 1.0 4.7 4.2
Sources: FHRF Canada 1881; NAPP; http://www.prdh.umontreal.ca/1881/en/1881freqs.html
the Dominion’s urban and rural areas. Next, we ex-plore the birthplace and ethnic origin of account-ing functionaries. To further enhance our profile of Canadian accountants and bookkeepers, in 1881, we examine their religious denomination and re-late religious conviction to ethnic origin. The posi-tion of women accounting funcposi-tionaries is then reported. Before presenting our concluding re-marks, we offer a case study that reveals evidence of both formal and informal exclusionary closure implicit within the demographic profile of the founders of Canada’s early professional associa-tions.
6. Spatial distribution of the accounting
community in 1881
Table 1 gives numbers for accountants and book-keepers living and working in Canada in 1881 analysed by province,10and relates those figures to population size.11Table 1 shows that accountants were most populous in the Provinces of initial or-ganisational formation in 1879, with 441 (50% of all accountants) in Ontario and 214 (24%) in Quebec. When the distribution of accountants is related to population, the pattern changes marked-ly. The highest densities are found in British Columbia, Manitoba and Prince Edward Island, all with 50 or more accountants per 100,000 popula-tion. Ontario has just 23 accountants per 100,000 population and Quebec 16. Ontario (2,051, 55% of all bookkeepers) and Quebec (1,008, 27%) were also the Provinces with the highest numbers of bookkeepers and, together, they were the location of 82% of all bookkeepers compared with 74% of all accountants. Ontario was also home to the highest density of bookkeepers – 107 per 100,000 population, but both British Columbia and Manitoba exhibited higher levels of concentration than did Quebec.
Variations in the density of accountants in dif-ferent locations12 is likely to be attributable to a range of variables that include relative levels of commercial and industrial maturity and the social composition of particular neighbourhoods, with the middle class more likely to require the servic-es of accountants than the working class. Other local-specific factors no doubt explain the relative-ly high density in certain places. For example, 27 of British Columbia’s 33 accountants lived in towns (Vancouver, Victoria and Yale) to which tens of thousands of people flocked during the 1858 and 1861–62 gold rushes. The 29 (out of 36) Manitoban-based accountants resident in Winnipeg (FHRF Canada 1881) probably included many working for the province’s thriving Hudson’s Bay Company.13 Between 1871 and 1885, the company’s administration had moved from its historic York Factory site on Hudson Bay to Winnipeg as steamboats, then a railway (1878),
linked it with the US. The company also opened its first departmental store in Winnipeg in 1881.
Table 1 also reveals considerable geographic variation in the numbers of bookkeepers compared with accountants, ranging from unity (54 of each) on Prince Edward Island to 6.4 in Nova Scotia. Such differences may well reflect variation be-tween provinces in the nature of the work per-formed by bookkeepers and accountants. Alternatively, they might be attributable, at least partly, to etymological variation in the application of those descriptions to accounting functionaries’ calculative tasks.14
Table 2 adds a further dimension to this analysis by focusing on the urban/rural divide. Whereas 74% of Canada’s population lived in rural areas in 1881, each category of accounting functionary re-veals a converse distribution – 75% of its 87515 ac-countants and 74% of its 3,698 bookkeepers lived in urban areas. Ontario and Quebec were the most urbanised provinces (30% and 28% of their popu-lations respectively) and it is where we also find, Manitoba accountants apart, the largest propor-tions of urban-located accountants and bookkeep-ers (NAPP, 2004). Moreover, within these two provinces, the vast majority of accounting func-tionaries were located on the St Lawrence Seaway through to Lake Ontario.16Quebec City, Montreal, Toronto and Hamilton, for example, being the home of 250 (29% of total) accountants and 1,444 (39%) bookkeepers (NAPP, 2004). It is likely, of course, that in rural areas, in particular, accounting and bookkeeping functions were often not under-taken by specialists.
The figures for accountants reported in Tables 1 and 2 included an unknown number who were
Vol. 38 No. 5. 2008 379
10 The 1881 census revealed a population of 4,324,810
(Urquhart and Buckley, 1965: 14) compared with the 4,278,174 entries in the NAPP database. The main cause of the discrepancy is that The Church of Jesus Christ of Latter-day Saints failed to enter the Northwest Territories in full.
11Northwest Territories are included in the tables, for
com-pleteness, but ignored for analytical discussion given that only four accounting functionaries were located there.
12The null hypotheses that accountants and bookkeepers
were distributed, by province, in the same proportions as the general population were overwhelmingly rejected in a chi-squared test (P < 0.0001).
13Forty of Manitoba’s 56 bookkeepers were also resident in
Winnipeg.
14There is evidence to suggest that, by 1881, less progress
had been made in Canada, and the US, than in Britain in de-veloping an effective linguistic distinction between the terms bookkeeper and accountant (‘American book-keepers’, 1880: 11; The Book-keeper, 1882 quoted in Webster, 1944: 369; ‘Canadian accountants’, 1881b: 4).
15Differs from 876 used elsewhere in this paper due to a
small number of cases where NAPP and ourselves reached dif-ferent conclusions about whether particular individuals should be classified as accountants.
16For Britain, Edwards and Walker (2007a: 69) also found
that centres of high density were usually sea or inland ports.
380 ACCOUNTING AND BUSINESS RESEARCH
Table 2
Population, accountants and bookkeepers in urban and rural areas in 1881
Urban Rural Total
No % No % No %
Population 1,109,507 26% 3,215,303 74% 4,324,810 100%
Accountants 659 75% 216 25% 875 100%
Bookkeepers 2,738 74% 960 26% 3,698 100%
Total functionaries 3,397 1,176 4,573
Sources: NAPP; Statistics Canada, http://www40.statcan.ca/l01/cst01/demo62a.htm
members of the professional associations formed in Montreal and Toronto by 1881. We might imag-ine that these bodies were initially dominated by local recruits. This was certainly the case in Ontario at the time of the Institute of Accountants’ inaugural meeting held 13 months after census day. Its membership list on 18 May 1882 included 69 accountants based in Toronto and, of the re-maining 52, 47 worked elsewhere in Ontario. No early membership list has yet been uncovered for the Montreal Association but, given Collard’s (1980: 22) description of it as ‘more like a club than a corporate body with complete professional powers’, we might speculate that its constituency was even more parochial than that of the Ontario Institute. The petitioners who successfully sought statutory recognition for the Montreal Association and the Ontario Institute,17so far as we have been able to identify them (FRFH Canada 1881; Little, 1989),18are listed in Table 3 together with the fol-lowing demographic characteristics: census place, birthplace; ethnic origin; and religion. Collard’s conception of the clubbish character of the Montreal Association is certainly supported by ev-idence concerning the known resev-idence of its ini-tial leadership, with seven living in the central Ste-Antoine Ward and the remaining three not far afield.
We can therefore conclude that initial
profes-sionalisation of the accounting occupation in Canada was effectively closed, on the basis of ge-ography, to those working in Ontario and Quebec, and in the latter case possibly with a membership not extending far beyond the boundaries of Montreal.
7. Nativity and geographic location
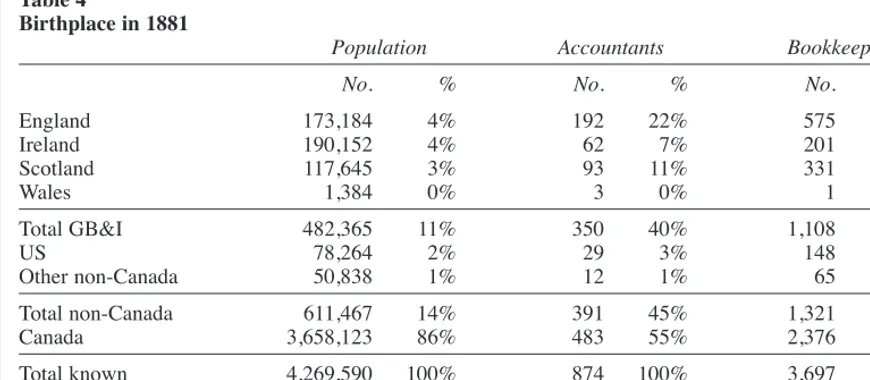
Table 4 gives the birthplace of Canada’s popula-tion and accounting funcpopula-tionaries. It reveals that immigrants were over-represented; the 14% re-ported by the enumerators as born outside Canada included 45% of Canada’s accountants and 36% of its bookkeepers. The vast majority of accountants born outside Canada (350 out of 391) came from GB&I, with the US supplying most (29) of the re-mainder. Though less marked, a similar pattern ex-isted in the case of bookkeepers. Between the two categories of accounting functionary, there is little variation in the proportions born in the constituent countries of GB&I. For example, 55% and 52% of accountants and bookkeepers, respectively, were born in England.
There are some interesting similarities and dif-ferences between our findings and those of Richardson (1989) for ‘Canada’s accounting elite’19 during the early part of the 20th century. Richardson finds similar proportions of account-ants as ourselves born in both GB&I (41% com-pared with 40%) and Quebec (19% vs. 17%).20 However, whereas 36% of ‘elite’ accountants were born in Ontario, the 1881 census revealed just 23% of accountants in Canada native to that province. Most of the difference is due to the fact that only 2.5% of elite accountants were born in the mar-itime provinces compared with 14% from our own study. This suggests that it proved more difficult for accountants born in the maritime provinces to gain access to recognition at national level, and this might be partly attributable to later organisa-tional representation in those parts of Canada.
Analysis of the accounting community by birth-place, when compared with the profile of Canada’s
17Thirteen petitioners appeared in An Act to incorporate the
Association of Accountants in Montreal, 1880, 43–44 Vict., Cap. 88 and 18 in An Act to incorporate the Institute of Accountants of Ontario, 1883, 46 Vict., Cap. 64.
18For the Montreal Association, we failed to trace with a
sufficient degree of confidence among the census records: Edward Evans, Louis J Lajoie and Arthur H. Plimsoll. Similarly, for the Ontario Institute: Samuel Bickerton, G. W. Banks, William H. Cross, W. A. Douglas, R. H. Gray, Francis C. Ireland, John T. Moore and Charles Robertson.
19 Richardson’s 79 elite accountants are drawn from
Canadian Who’s Who, 1910 and 1936 editions, and Who’s Who in Canada, 1910–30 editions (Richardson, 1989: 5 and 21).
20Provincial figures taken from NAPP database.
V
ol
. 38 N
o. 5. 2008
381
Table 3 Founders
Montreal Association Census place Birthplace Origin Religion
Beausoleil Cleophas Ste-James Ward, Montreal Quebec French Catholic
Court James Ste-Antoine Ward, Montreal Scotland Scottish Presbyterian
Craig David J. Outremont, Hochelaga, Quebec Scotland Scottish Presbyterian
Darling Thomas Ste-Antoine Ward, Montreal Scotland Scottish Presbyterian
Fair John Ste-Lawrence Ward, Montreal Scotland Scottish Presbyterian
McDonald John Ste-Antoine Ward, Montreal Scotland Scottish Presbyterian
Moffat Alexander Ste-Antoine Ward, Montreal England Scottish Presbyterian
Perkins Arthur M. Ste-Antoine Ward, Montreal Quebec English Presbyterian
Riddell Alexander F. Ste-Antoine Ward, Montreal Scotland Scottish Presbyterian
Ross Philip Simpson Ste-Antoine Ward, Montreal Scotland Scottish Presbyterian
Ontario Institute
Clarkson Edward R. C. Ontario English
Coady Richard T. St George Ward, Toronto, York, Ontario Ontario Irish Anglican
Eddis Henry Wm. York East, York East, Ontario England English Anglican
Findlay William F. Pilkington, Wellington Centre, Ontario Scotland Scottish Presbyterian
Harman Samuel B. St George Ward, Toronto, York, Ontario England English Anglican
Johnson J. W. Belleville, Hastings West, Ontario Ireland Irish Methodist
Mason Jno. J. Barrie, Simcoe North, Ontario England English Anglican
Massey* John St Thomas Ward, Toronto, York, Ontario England English Anglican
Millar R. D. Ward 5, London, Middlesex, Ontario England Scottish Methodist
Ramsay A. G. Ward 2, Hamilton, Wentworth, Ontario Scotland Scottish Anglican
Whitt S. St James Ward, Toronto, York, Ontario England English Anglican
* Spelled Massay in census records Source: FHRF Canada 1881; Little, 1981.
entire population, suggests informal closure in favour of immigrants from GB&I. This possibility can next be examined in greater depth due to the re-quirement for the census enumerators to elicit the perceived ethnic origin of the populace.
8. Ethnic origin and geographic location
‘Canadians tend to identify themselves accord-ing to their ethnic origin, and it is not uncommon to hear Canadians who have never set foot in the British Isles describe themselves as “Scottish”.’ (Messamore, 2004: 1)The exodus from Europe to Canada began in the second half of the 17th century when six thousand or so French immigrants formed the nucleus of New France. The situation began to change in the second half of the 18th century following the con-quest of New France by the British and as the re-sult of thousands of Loyalists emigrating north following the American Revolution in 1783. In ad-dition to the loss of the American colonies, other dramatic episodes which encouraged migration to Canada include the Highland clearances in Scotland dating from the 1760s and the Irish pota-to famine of the 1840s. Migration from Britain pota-to Canada, which saw the relatively affluent, as well as the impoverished, attracted by better prospects overseas (Harper, 2004: 16–18), was a pervasive feature of Western demographic patterns through-out the 19th century.
Reliable figures for migration from the British
Isles to north America date only from 1815 when 680 are believed to have sailed for Canada and 1,209 to the US. The rate of exodus then spiralled, with numbers destined for the British dominion usually the larger until the mid-1830s when migra-tion to the US escalated. 23,534 emigrated from GB&I to Canada in 1819, 66,339 in 1832 and 109,680 in 1847. By the 1870s, the average rate of annual out-migration to Canada had fallen to 23,817 compared with 147,065 to the US (Johnson, 1913: 344–345). The available records reveal that, among those emigrating to Canada be-tween 1853 and 1880, 222,598 were English, 130,570 were Irish and 78,550 were Scottish (Johnson, 1913: 347).
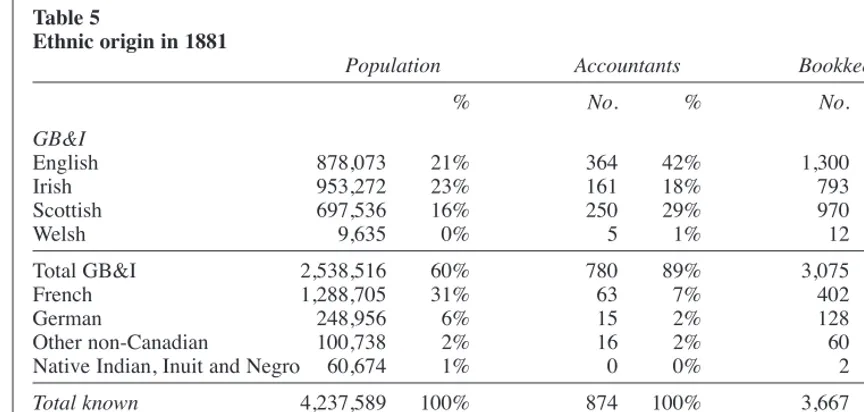
The 1881 Canadian census required those sup-plying information to the enumerators to give the country of origin of each person resident in the household. The country of origin for accountants and bookkeepers and for the entire population is set out in Table 5.21Eighty-nine per cent of all ac-countants originated from GB&I compared with 60% of the entire population. A similar situation is revealed in the case of bookkeepers, 84% of whom considered their ethnic origin to be GB&I. Within this geographical category, we find higher propor-tions of accountants, compared with bookkeepers hailing from England (seven points up) and Scotland (three points up), and a lower proportion from Ireland (four points down). Bookkeepers originating elsewhere were mainly from France (90% of whom were resident in Quebec) and Germany (NAPP, 2004).
The null hypothesis that, in terms of ethnicity, accountants and bookkeepers are distributed in the same proportions as the general population can be conclusively rejected based on the results of the
382 ACCOUNTING AND BUSINESS RESEARCH
Table 4
Birthplace in 1881
Population Accountants Bookkeepers
No. % No. % No. %
England 173,184 4% 192 22% 575 16%
Ireland 190,152 4% 62 7% 201 5%
Scotland 117,645 3% 93 11% 331 9%
Wales 1,384 0% 3 0% 1 0%
Total GB&I 482,365 11% 350 40% 1,108 30%
US 78,264 2% 29 3% 148 4%
Other non-Canada 50,838 1% 12 1% 65 2%
Total non-Canada 611,467 14% 391 45% 1,321 36%
Canada 3,658,123 86% 483 55% 2,376 64%
Total known 4,269,590 100% 874 100% 3,697 100%
Unknown 8,584 2 1
Total 4,278,174 876 3,698
Sources: FHRF Canada 1881; http://www.nappdata.org/napp-action/codes.do?mnemonic=BPLCA
21The indigenous population is understated for the reason
given in footnote 10, with the best estimate showing them to account for 3% of the population.
Vol. 38 No. 5. 2008 383
Table 5
Ethnic origin in 1881
Population Accountants Bookkeepers*
% No. % No. %
GB&I
English 878,073 21% 364 42% 1,300 35%
Irish 953,272 23% 161 18% 793 22%
Scottish 697,536 16% 250 29% 970 26%
Welsh 9,635 0% 5 1% 12 0%
Total GB&I 2,538,516 60% 780 89% 3,075 84%
French 1,288,705 31% 63 7% 402 11%
German 248,956 6% 15 2% 128 3%
Other non-Canadian 100,738 2% 16 2% 60 2%
Native Indian, Inuit and Negro 60,674 1% 0 0% 2 0%
Total known 4,237,589 100% 874 100% 3,667 100%
Unknown 40,585 2 31
Total 4,278,174 876 3,698
* English includes 7 British; French includes 12 French Canadians.
Sources: FHRF Canada 1881; http://www.nappdata.org/napp-action/codes.do?mnemonic=ORIGIN
chi squared test (P < 0.0001). This finding is high-ly significant, revealing that the distribution of ac-countants and bookkeepers was profoundly affected by ethnic origin.22For example, compared with the ethnic distribution of the population, there were, respectively, 183 (101%) more English ac-countants and 540 (63%) more English bookkeep-ers than would be expected in Canada in 1881. In contrast, for the ethnic French, there are 203 (76%) fewer accountants and 713 (64%) fewer book-keepers than would have been observed if their numbers had been proportionate to population. Returning to Table 5, and focusing on the larger numbers, we can conclude that accounting func-tionaries from England and Scotland were more likely to be accountants and those from Ireland and France more likely to be bookkeepers.
This section reveals domination of the account-ing community, both nationally and provincially, by accounting functionaries emanating from GB&I. Britain was the first country to industrialise and the first to professionalise the accounting craft. One might therefore see such domination as a consequence of the skills that immigrants
brought with them. But by far the majority of the ethnic-GB&I accounting functionaries were born in Canada (Tables 4 and 5), and an unknown pro-portion of those born in the British Isles would have been below working age when arriving at their new home.
Overall, one can conclude that the composition of the nascent accounting community was begin-ning to reflect a degree of informal exclusionary closure based on ethnicity. Those most likely to penetrate the occupational boundary saw them-selves as hailing from GB&I; those tending to be excluded were of French and German origin, with access to the accounting domain almost complete-ly denied to the Native Indian, Inuit and Negro.
9. Religion
‘Among the institutions which migrants trans-planted or sought to re-establish, the most prominent were usually the church, the school, and the ethnic association.’ (Harper, 2004: 26). This section examines the religious affiliation of accounting functionaries and the relationship be-tween religion and ethnic origin. The 1881 Canadian census revealed that 42% of the popula-tion were Roman Catholics, 40% were non-con-formists’23and 13% were Anglicans (Table 6). The religious profile of Canadian accountants repre-sents the inverse of that distribution. The dominant religious affiliation of accountants was Anglican (42%),24with the non-conformist groups together comprising 40% of the total. Just 15% of Canada’s accountants described themselves as Roman Catholic.
22The same outcome occurs when the distribution of
book-keepers and accountants is examined on the basis of religious affiliation (Table 6).
23A non-conformist is any member of a Protestant
congre-gation not affiliated with the Church of England.
24Richardson (1989: 10) reveals similar patterns for his
co-hort of elite accountants at the time of the 1931 census. For ex-ample, 42% of both elite accountants and accountants uncovered by the 1881 census were Anglicans whereas only 13% of the population in 1881 and 16% in 1931 reported a commitment to that church.
384 ACCOUNTING AND BUSINESS RESEARCH
Table 6
Religious denomination in 1881
Population Accountants Bookkeepers
Anglican 575,157 13% 366 42% 1,043 28%
Baptist 291,832 7% 32 4% 196 5%
Methodist* 712,294 17% 115 13% 662 18%
Presbyterian 695,849 16% 201 23% 893 24%
Non-conformist 1,699,975 40% 348 40% 1,751 47%
Roman Catholic 1,790,773 42% 128 15% 743 20%
Lutheran 45,432 1% 2 0% 21 1%
Other 106,730 2% 25 3% 113 3%
Unknown 60,107 1% 7 1% 27 1%
4,278,174 100% 876 100% 3,698 100%
* Includes 18 accountants and 73 bookkeepers who were Congregationalists.
Sources: FHRF Canada 1881; NAPP; http://www.prdh.umontreal.ca/1881/en/1881freqs.html
Table 7
Accountants’ religious denomination and ethnic origin
GB&I French German Other/
Ethnic origin English Irish Scottish Welsh Unknown Total
Religion
Anglican
Number 239 60 45 3 4 7 8 366
% 66% 37% 18% 60% 6% 47% 44% 42%
Baptist
Number 17 5 8 1 1 32
% 5% 3% 3% 7% 6% 4%
Methodist
Number 62 23 22 1 3 4 115
% 17% 14% 9% 20% 20% 22% 13%
Presbyterian
Number 19 28 149 1 2 2 201
% 5% 17% 60% 20% 13% 11% 23%
Non-conformist
Number 98 56 179 2 6 7 348
% 27% 35% 72% 40% 40% 39% 40%
Roman Catholic
Number 7 42 17 59 2 1 128
% 2% 26% 7% 94% 13% 6% 15%
Lutheran
Number 1 1 2
% 0% 6% 0%
Other/Unknown
Number 19 3 9 1 32
% 5% 2% 4% 6% 4%
Total
Number 364 161 250 5 63 15 18 876
% 100% 100% 100% 100% 100% 100% 100% 100%
Source: FHRF Canada 1881.
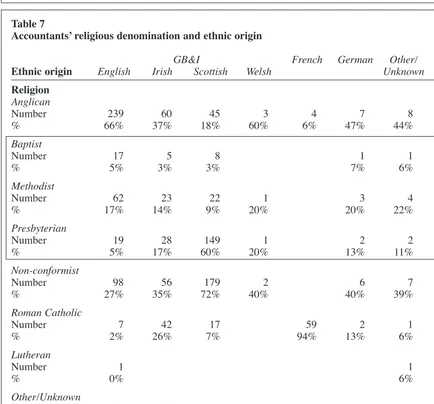
We have seen (Table 5) that the dominant ac-countant-ethnic group was English, and Table 7 re-veals that most of them (66%) were Anglican. Other prominent ethnic/religious combinations show the Scots to be principally Presbyterian (60%) and the French to be almost exclusively (94%) Roman Catholic. These profiles are not un-expected. More surprising is the fact that more Irishmen attached themselves to the Anglican church than to any other denomination. In a study of the impact of demographic characteristics on the profile of the accounting occupational group, it is relevant to note that the Protestant domination of Canada’s ethnic-Irish accounting cohort is consis-tent with Annisette and O’Regan’s (2007) finding that, in the predominantly Catholic home country, 27 of the 31 founder members of the Institute of Chartered Accountants in Ireland (1886) were Protestant.
The religious affiliations of bookkeepers also diverged from those of the population as a whole, but to a lesser degree (Table 6). The highest proportion was again Anglican, but it stands at 28% of the cohort compared with 42% in the case of accountants. Presbyterians (24%), Roman Catholics (20%) and Methodists (18%) are, again, the next most numerous denominations, but the gap between each of these and adherents to the Anglican church is far less than in the case of ac-countants.
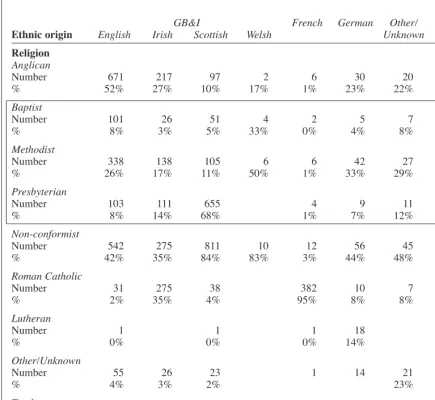
Among bookkeepers originating from England (Table 8), a much lower proportion (52% com-pared with 66% accountants) was Anglican, and a much higher proportion (42% compared with 27% accountants) was non-conformist. Scottish bookkeepers were even more likely to be Presbyterian compared to Anglican (68% vs. 10%) than in the case of accountants (60% vs. 18%), and French bookkeepers equally certain (95% vs. 94%) to be Roman Catholic. Amongst Irish bookkeepers, the Roman Catholic rather than Anglican church was the most common religious affiliation.
Evidence of informal exclusionary closure on the basis of religion is strong in the case of the ac-countant occupational group. There are more than three times (42% compared with 13%) as many Anglican accountants than would be the case if proportional to population, and 95% (347 out of 366, Table 7) of these were of GB&I ethnicity. Non-conformist representation corresponded to the profile of the population as a whole, but the barrier to the accountant occupational group proved extremely difficult for Roman Catholics to penetrate. The pattern is not entirely dissimilar in the case of bookkeepers, but it is certainly less marked, signalling less evidence of closed access to this lower status activity based on religious af-filiation. Indeed, the distribution of bookkeepers
by religious denomination compared with that of the entire population reveals a correlation coeffi-cient of 0.65 compared with 0.41 in the case of ac-countants.
10. Women accountants and bookkeepers
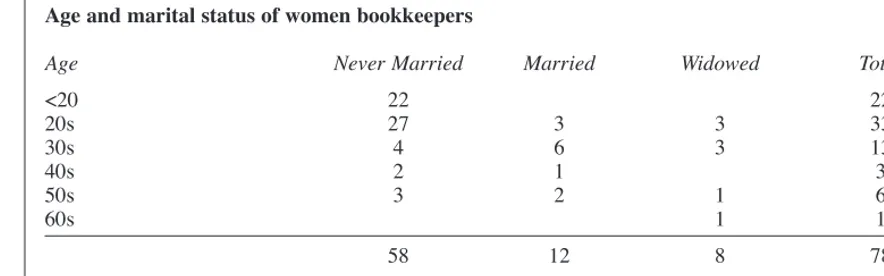
FHRF Canada 1881 incorrectly reports seven ac-countants as female. It is almost certain that John Skaling and Hugh Bown Lewis were wrongly tran-scribed as female, while the sex of J. Bevan Giles cannot be inferred. It is difficult to establish the status of individuals in a Canadian household in 1881 given the absence of a census requirement to record their relationship to the head of household. Relying on names, ages, and information on mari-tal status, it appears that Mary Lenmanth ‘ac-countant’ was living with her husband, four children and two other people. The fact that her husband’s occupation was also stated as ‘account-ant’ raises the possibility that Mary was not an ac-countant but an acac-countant’s wife (Edwards and Walker, 2007b: 66). So far as can be judged from the information available, the remaining three women were bona fide accountants: Elizabeth Marling ‘accountant’ was 85 years of age, living with her school-master son and family in York East, Ontario; Julia Crompton ‘accountant’ lived with her clergyman father, mother and sister in Barrie, Ontario; Emma Campbell, who describes herself as ‘comptable’, origin ‘Francais’, was liv-ing with the Taylor family in Montreal.Of the 3,698 Canadian bookkeepers, 78 (2.1%) were women.25Table 9 reveals a youthful profile with 22 (28%) under 20 years of age and a further 33 (42%) in their twenties. As in the case of female accountants, most (74%) had never married. As with males (84%), the ethnic origin of the vast ma-jority of female bookkeepers (86%) was British or Irish, and they lived primarily in Ontario (53, 70%) or Quebec (13, 17%). Religious affiliation was also diverse, including 23 (29%) Methodists, 20 (25%) Presbyterians, 15 (19%) Roman Catholics and 13 (17%) Anglicans. However, women bookkeepers were more likely than men to be Methodist and less likely to be Anglican. The typical female bookkeeper in Canada in 1881 was therefore of British origin, under 30, non-conform-ist, unmarried and lived in Ontario or Quebec.26
It is clear from the foregoing that women in Canada remained almost entirely outside the com-munity of accounting functionaries in 1881. This might be contrasted with the position in the
‘moth-Vol. 38 No. 5. 2008 385
25The 79 female bookkeepers listed in the NAPP database
included Joseph Smith.
26The male bookkeeper was, similarly, often young and
un-married, but the likelihood was less in his case. Just under half (48.5%) had never married and the average age of the occupa-tional group was 32.
er country’ where, although accountants remained predominantly male (Kirkham and Loft, 1993), the occupation of bookkeeping was becoming gender mixed. Compared with Canada, where the 78 fe-male bookkeepers accounted for just 2.1% of the occupational group, 2,616 female bookkeepers in Britain comprised 18% of that cohort (Walker, 2003: 611–612), and in certain counties the ratio was well over 50% (Edwards and Walker, 2007a: 73). At the start of the next section we present ev-idence of formal exclusionary closure practiced against women accountants when professional bodies were created in Montreal and Toronto. We then move on to reveal evidence of informal ex-clusionary closure in the demographic profile of the founders of the Montreal Association and the Ontario Institute.
11. Founders of the Montreal Association
and the Ontario Institute
The presumption that professional accountants would be male was made explicit in the acts of in-corporation of both the Montreal Association and the Ontario Institute. Section 4 (emphasis added) of the Montreal Association’s enabling statute states that the ‘amount to be paid by a member on his admis-sion should not exceed twenty dollars’, while section 10 (emphasis added) of the Ontario Institute’s char-ter clarified rights on cessation of membership in the following male-exclusive manner:
‘If any member during his lifetime ceases to be a member of the Institute, he shall not, nor shall his representatives, have any interest in or claim against, the funds or property of the Institute.’
A study of the demographic composition of the
386 ACCOUNTING AND BUSINESS RESEARCH
Table 8
Bookkeepers’ religious denomination and ethnic origin
GB&I French German Other/
Ethnic origin English Irish Scottish Welsh Unknown Total
Religion
Anglican
Number 671 217 97 2 6 30 20 1,043
% 52% 27% 10% 17% 1% 23% 22% 28%
Baptist
Number 101 26 51 4 2 5 7 196
% 8% 3% 5% 33% 0% 4% 8% 5%
Methodist
Number 338 138 105 6 6 42 27 662
% 26% 17% 11% 50% 1% 33% 29% 18%
Presbyterian
Number 103 111 655 4 9 11 893
% 8% 14% 68% 1% 7% 12% 24%
Non-conformist
Number 542 275 811 10 12 56 45 1,751
% 42% 35% 84% 83% 3% 44% 48% 47%
Roman Catholic
Number 31 275 38 382 10 7 743
% 2% 35% 4% 95% 8% 8% 20%
Lutheran
Number 1 1 1 18 21
% 0% 0% 0% 14% 1%
Other/Unknown
Number 55 26 23 1 14 21 140
% 4% 3% 2% 23% 4%
Total
Number 1,300 793 970 12 402 128 93 3,698
% 100% 100% 100% 100% 100% 89% 100% 100%
Source: NAPP.
leaderships of Canada’s first two accounting bod-ies reveals informal as well as formal closure practices. A striking feature of the initial leader-ship of the Montreal Association (Table 3) is its dominance by Scottish-Presbyterians. The first President, James Court, emigrated from Scotland to Canada in his late teens to work for his mer-chant uncle, William Blackwood. In 1831, he set up as a sole practitioner, ‘making use of the knowledge of bookkeeping he had picked up at Blackwood’s’ (Collard, 1980: 20). A joint-founder of the firm Court and MacIntosh, ‘He was a man of probity, preoccupied with moral and ethical is-sues. He was a Presbyterian, joint founder of a Young Men’s Christian Association and founder of the Montreal Temperance Society’ (Collard, 1980: 20). The second President, Philip Simpson Ross, also Presbyterian, emigrated as a young man from Lanarkshire in the early 1850s, and ‘[i]n 1874 he withdrew entirely from his “mercan-tile career” to concentrate on accountancy alone’ (Collard, 1980: 21). The demographic profile of the ‘actual founder’ (Creighton, 1984: 1) of the Ontario Institute was quite different. William Robins was born (1850) in Cornwall, England, and his religion is reported in the census records as Church of England (Ancestry.ca, 1901). But ‘without political significance’, the manoeuvring required to achieve chartered status saw Robins absent from a Council ‘replete with municipal politicians, exalted leaders of the Masons and prominent Anglican laymen’ (Creighton, 1984: 12).
In common with that of their initial leaders, the ethnic/religious profiles of the petitioners for statutory recognition of the two professional ac-counting bodies also differed significantly (Table 3). In Ontario, the predominant profile was English/Anglican. The ethnic English focus is con-sistent with the fact that 46% (204 out of 441, FHRF Canada 1881) of all accountants in Ontario originated from that country. The founders’ reli-gious affiliation, however, contrasts with that of the Province overall ‘where, by the late 19th
cen-tury, Protestant pluralism had taken hold’. However, ‘much of the elite were still Anglican’,27 and one would expect that an association of pro-fessional accountants aspired to such status. We surmise that the English/Anglican orientation ex-plains why The Institute of Accountants and Adjusters of Canada based its initial constitution and bylaws on those of England’s elite Institute of Accountants, established in London in 1870 (Creighton, 1984: 2; see also ‘Canadian account-ants’, 1881a: 3, 1881b: 4).
The Scottish/Presbyterian orientation of the founders of the Montreal Association mirrors nei-ther the ethnic origin of accountants in Quebec nor the dominant religious affiliation of its people, which was Roman Catholic. The 60 ethnic-Scot accountants in Quebec in 1881 comprised just 28% of the 214 accountants in that province. There were more ethnic-English accountants (62) in Quebec, and it was the Province where 57 of the 63 ethnic-French accountants lived and probably worked. However, the position was different in Montreal where the 40 Scots, within an accountant community of 102 in that city, comfortably out-numbered those of any other ethnic group (FHRF Canada 1881).
Founders of the first two professional bodies es-tablished in Canada therefore exhibit distinctive religious profiles which were also at variance with those of the provincial populations. Moreover, the Montreal Association’s founders failed even to re-flect the ethnic profile of accountants in Quebec, though it was consistent with that of those resident in the province’s capital city.
12. Concluding remarks
The history of occupations and professions is marked by groups with interests in common join-ing together to deny social and economic
opportu-Vol. 38 No. 5. 2008 387
Table 9
Age and marital status of women bookkeepers
Age Never Married Married Widowed Total
<20 22 22
20s 27 3 3 33
30s 4 6 3 13
40s 2 1 3
50s 3 2 1 6
60s 1 1
58 12 8 78
Source: NAPP.
27 Wikipedia. http://en.wikipedia.org/wiki/Religion_in_
Canada#History
nities to others. The self-appointed elite will: ‘embark on a process of social closure intended to both limit membership of the group itself and to appropriate the privileges of other competing groups. This will involve the adoption of various closure strategies intended to demarcate or rein-force boundaries, ensuring that membership is restricted and that certain ‘ineligibles’ or ‘out-siders’ are excluded. These strategies will in-clude explicit and implicit criteria relating to, amongst others factors, race, class, gender, edu-cational qualifications, credentials and the type of work performed’ (O’Regan, 2008: 37). As guest editor of the ‘International Accounting History Special Issue’ of Accounting and Business Research, Richardson (2002: 65) argued that the ‘historical perspective provides practitioners and academics with a sense of the constancy of change and the impact of broader social forces on their craft’. This paper is designed to contribute to the ‘types of studies’ that, in Richardson’s judgment (2002: 65), ‘are needed to support a new global perspective by accountants on their profession’. It has done so by examining the spatial and demo-graphic profile of the early accounting community in Canada for evidence of exclusionary closure based on findings from a census that contained questions designed to uncover the following key ‘markers of identity’ (Kertzer and Arel, 2002: 35): residence, occupation, nativity, ethnicity, religion and gender.
The answers provided to census enumerators re-vealed that the vast majority of Canadians contin-ued to live (74%, Table 2) and work in rural areas in 1881. In direct contrast, 75% of accounting functionaries lived, and probably worked, in urban areas. As in Britain (Edwards and Walker, 2007a: 69), many of them resided in leading commercial ports. As noted above, just four cities adjacent to the St Lawrence Seaway (Quebec City, Montreal, Toronto and Hamilton) were home to 250 (29% of total) accountants and 1,444 (39%) bookkeepers. The merchant classes supported the primary indus-tries that generated the products welcomed in Canada’s export markets, but more extensive in-dustrialisation was resisted on the grounds that it would reduce the need for imported commodities. By 1881, nevertheless, manufacturing and engi-neering works had begun to appear in certain parts of Canada. One would expect these to require ac-counting functionaries, but so too would, for ex-ample: the merchant enterprises that remained dominant throughout the Maritime Provinces; the Hudson’s Bay Company that ran Manitoba until 1870; and parts of British Columbia energised though left economically depressed following the unfulfilled expectations fuelled by the gold rushes. Although 75% of all accounting functionaries
were located in either Ontario or Quebec (655 out of 876, Table 1), greater densities of accountants or bookkeepers were found in the less-populated provinces. These and other differences between observed and expected features of the profile of accounting functionaries compared with that of the entire population offer, as indicated below, oppor-tunities for future meaningful research.
The demographic characteristics examined in this paper have been dictated by the questions posed by the census enumerators. The range of these enquiries, and the consequential richness of the resulting database, has enabled us to construct a multi-faceted demographic profile for the mem-bership of Canada’s early accounting community and the leadership of its initial accounting associa-tions.
The Canadian census had included a question on ethnic origin, from 1871, so as to register the changing proportions of the ‘two founding peo-ples’ – the French and English settlers – ‘in rela-tion to themselves and other groups’ (Kertzer and Arel, 2002: 15). We discover, at the dawn of pro-fessionalisation in Canada, a narrowing of the de-mographics of the accounting community which contrasts dramatically with the population’s over-all profile. The French founding people, who com-prised 31% of Canada’s population in 1881, featured far less prominently among accounting functionaries (Table 5). In contrast, men and women originating from GB&I comprise 60% of Canada’s population but 85% of its accounting functionaries. Ethnic-English are more prevalent within each occupational group, and dominate the accountants’ profile to an even greater extent than that of bookkeepers. The ethnic-Scots are the next most numerous accounting functionaries, con-tributing about two-thirds of the ethnic-English numbers in each case. In contrast, the Irish and overseas accounting functionaries feature relative-ly more strongrelative-ly in the listing for bookkeepers. Consistent with Davie’s (2005: 556) study of a South Pacific state-owned enterprise, we find evi-dence of the accounting community in Canada, by 1881, applying ‘a relatively covert form of racial differentiation and discrimination’.
The religious profile of accounting functionaries also differs markedly from that of the population as a whole. Whereas 42% of Canada’s inhabitants, in 1881, were Roman Catholic, this was the reli-gion of just 19% of all accounting functionaries (Table 6). In contrast, 31% of accounting func-tionaries were Anglican compared with 13% of the entire population. There are also clear signs that this further demographic variable had implications for the location of accounting functionaries within the accountant/bookkeeper divide. It is the Anglicans (normally English) and the Presbyterians (predominantly Scottish) that dominate the
ac-388 ACCOUNTING AND BUSINESS RESEARCH