THE EFECT OF CORPORATE SOCIAL RESPONSIBILITY
EXPENDITURES TOWARD FINANCIAL PERFORMANCE AND FIRM
VALUE
Aditya Satya Yudharma
1, Yeterina Widi Nugrahanti
2, Ari Budi Kristanto
3ABSTRACT
Corporate Social Responsibility is becoming increasingly important in Indonesia, many
companies get into trouble when they do not care about the environmental and social issues.
The purpose of this research is to analyze the influence of corporate social responsibility
expenditure on the financial performance and firm value. The samples of this study were 56
companies listed in Indonesia Stock Exchange in 2012 to 2013. The samples are chosen
using the purposive sampling method based on certain designated criterias. Corporate
social responsibility expenditure is measured by employee welfare cost and social
expenditure for community. The financial performance is measured by return on assets
(ROA) and firm value is measured by Tobin’s Q ratio. For hypothesis testing, this study used multiple regressions analysis. The result of this study showed that the employee welfare
cost had positive effect toward financial performance (ROA), and It had no effect toward firm
value (Tobins’Q). While, social expenditure for community had no effect toward financial
performance (ROA) and firm value (Tobin’s Q).
Keywords : corporate social responsibility expenditures,employee welfare cost, social
expenditure for community, financial performance, firm value
Conference Track: Accounting
1 Mr. Aditya Satya Yudharma, alumnus of Economics and Business Faculty, Satya Wacana Christian University 2 Mrs. Yeterina Widi Nugrahanti, faculty member of Economics and Business Faculty, Satya Wacana Christian University. Email: [email protected]
INTRODUCTION
Nowadays, the challenge faced by a company is not merely on how it can get profit as much
as possible. Social and environmental issues are the other challenge it has to deal with in order to survive in running the business. Corporate Social Responsibility (CSR) is the form of companies’ awareness toward the stakeholders’ interests, particularly, which is related to social and environmental issues (Kusumadilaga, 2010). Ambadar (2008) mentioned 4 benefits of CSR
implementation: (a) companies will be able to avoid bad reputation, (b) companies have an ethical
framework to deal with social and environmental issues, (c) companies will be respected by any group
needing for the companies existence, and (d) companies will be safe from environmental disruption,
so companies will run well. The CSR’s benefits for the companies can be seen from the companies’
financial performance. Aryani (2012) stated that every company will try to improve its financial performance, one of which is CSR implementation. Carrying out CSR activity will raise people’s reliance toward companies’ product, thus they will be more interested in buying those products. Dahlia and Veronica (2008), Dewa (2011), and Syahnaz (2013) found out that CSR measured with CSR disclosure positively influences the companies’ financial performance.
Studies about CSR influence toward firm value have been carried out before. Bird (2007) in
Sapta (2009) stated that high investation on social responsibility performed by a company will have
positif impact to the firm value. Global survey conducted by The Economist Intelligent Unit presented
that 88 percents of senior executives and investors from various organizations made CSR as their main consideration in decision making process. The higher the investors’ interest in investing in a company, the better firm value the company will acquire. Nurlela and Ishlahudin (2008), Gunawan
and Sri (2008), and Agustina (2013) found out that CSR disclosure positively influences firm value measured by Tobin’s Q ratio.
Indeed, the implementation of CSR is proven to be beneficial for the companies, but it does
not directly make them set aside their revenue easily for supporting CSR activities. Definitely, the
CSR implementation needs considerable expenses, whereas the benefit obtained has not yet been
measured reliably. The previous researchers have tried to clarify the structural condition of a company
which gains profit from the company social responsibility. However, Rowley and Berman (2000) in
Cahyono (2011) stated that there is no theoretical framework which can surely explain the results
acquired from CSR implementation.
According to Septiana and Nur (2012), generally, CSR expenditure includes employee
welfare cost, community cost, environmental development cost, and partnership cost. Some early
Rustiyaningsih (2013) suggested that employee welfare cost positively influences company’s return
of assets. In addition, Septiana and Nur (2012), and Januarti and Dini (2015) discovered that
employee welfare cost negatively influences company’s return of assets. Besides, Primawati (2010)
found out that community cost has positive impact to company’s retur of assets. On the other hand,
Mardiandari and Rustiyaningsih (2013), and Januari and Dini (2005) asserted that community cost
does not have any correlation with company’s return of assets.
Several earlier studies had presented different studies’ results. The writer wanted to examine
the influence of CSR expenditure toward financial performance. This research is a replication study
of Mardiandari and Rustiyaningsih’s (2013) study which used manufactures company in BEI
(Indonesian Stock Exchange) from 2008-2010 as the sample. The CSR variable was proxied into 2
expenditures, the employee welfare cost (post-retirement costs) and community cost (donation).
Then, the financial performance variable was proxied by the return of assets ratio. The differences
between this study and the study conducted by Mardiandari and Rustiyaningsih (2013) is the period
used, which is from 2012-2013, and is using companies in all sectors or various industries. This
research used 2-year observation period by comparing CSR expenditure in the first year with financial
performance and firm value in the following year. Within 1 year interval of CSR implementation, it
is assumed that there will be responses acquired from the society and investors. It will also be
supported with advanced technology development therefore society and investors can receive
information faster. Besides, this study added firm value, measured by Tobin’s Q ratio, as 1 dependent
variable.
The aim of this study was to analyze how CSR expenditure influences financial performance
and firm value. This study is beneficial for the companies as additional information in the decision
making process related to CSR impelementation. On the other hand, for the investors, later on the
result of this study should be of considerable information in making an investment decision related
to companies’ future CSR implementation.
,
THEORETICAL FRAMEWORK
Corporate Social Responsibility and Corportate Social Responsibility Expenditure
According to the International Standard ISO 26000 (2010) CSR is an organization’s responsibility as the impact of a decision, social and environmental activities, through transparent and
Law No. 40 Year 2007 about Limited Companies Article 74 states that company social responsibility is companies’ responsibility which business related to natural resources. Principally, the implementation of company social responsibility is obligatory for a certain business field,
particularly companies related to natural resources. For the other companies, which are not related to
natural resources, CSR implementation is considered as voluntary activities.
Indeed, the CSR implementation needs expenses. Actually, the companies do not purposely
limit the amount of expense for CSR implementation. In this research, CSR expenditure was divided
into 2, based on the object of the CSR expenditure (internal and external). The internal CSR
expenditure used employee welfare cost measured from post-retirement costs. The Post-retirement
cost, according to PSAK 24 No. 24 on the 8th paragraph, is payable employee benefits after the
workers finish their working period (IAI 2002). Then, the external CSR expenditure used community
cost measured from donation cost. Community cost is an expense used for society or a group of
organism which often interacts with the company (Mardiandari and Rustiyaningsih, 2013).
Financial Performance
Financial performance can be defined as a description of companies’ financial condition in a certain period, which includes fund raising and its distribution aspects, which is measured using
indicator of capital adequacy, liquidity, and profitability (Jumingan, 2006). This research used Return of Assets (ROA) in measuring companies’ profitability. ROA is a measurement to assess how much returned assets from the asset owned by the companies (Riyanto, 1997). Utilizing a company’s total
assets in order to measure profitabitability is positively correlated with the CSR expenditure because basically expenditure is a reduction of assets’ value. According to Utomo (1999) in Nugrahanti (2009), the special qualities of ROA are as a comprehensive measurement tool, in which all the items
affecting financial statement can be seen in this ratio; it is easy to calculate and understand, and it is
considerably significant in absolute value; as an applicable denominator in every organizational unit
which is responsible to profitability and business units; as an the main measurement of operational
efficiency; it is the easiest ratio to be controlled by the managements.
FIRM VALUE
Firm value is investors’ perception toward public companies, and is often related to stock price (Sujoko and Soebiantoro, 2007). High stock price indicates high firm value. The high firm value
will make markets trust not only the current company performance but also the future prospect of the
company (Hardiyanti, 2012).
than those companies’ market value. It shows that markets less value those companies. Whereas if Tobin’s Q value of a company is high (more than 1), it means that firm value is higher than the recorded company assets. It indicated that there are several company assets which is not measured or recorded (Haosana, 2012). According to Sukamuja (2004), Tobin’s Q ration can provide meaningful information, because it includes all elements of company’s debt and capital stock. It includes not only
common stock and companies’ equity, but also all companies’ assets. By including all companies’
assets means that the company focuses on both stock investors and creditors.
Signaling Theory
Signaling theory (Leland and Plye (1977) in Scott, 2012: 475) defines that the company
eccecutives who have better information of their companies will be motivated to deliver the
information to investor candidates where the companies can improve the firm value through their
financial statements by sending a signal from their annual financial statements. In simple, this theory
explains that the wider the company reveals its information, the easier the information receiver in
making the decision to invest.
According to Nezz et al. (2005) in Ghozali and Chariri (2007), if a company reveals
environmental information positively, it will reduce the risk of decreasing welfare that might be
occured in the future. Actually, by revealing how much the Corporate Social Responsibility
expenditure, a company delivers information to the information users or the investors about the
company’s good prospect since it has funded the CSR expenditure. One example of a good prospect
is a company which has a good relation with the people and environment around the company because
they have funded the CSR expenditure. The company hopes that the information can influence the
information users or the investors in their decision making process, particulary related to investation.
Hypothesis Development
The influence of CSR expenditure toward Return of Assets (ROA) ratio
Principally, expenditure has negative correlation with return of assets (ROA) ratio. The higher
expenditure spent, the less profit gained, thus ROA is getting lower, and vice versa. However, CSR
expenditure actually is potential to positively influence ROA.
By expending employee welfare cost, such as employee allowance, companies will gain
employees’s loyality toward the companies. Employees will be more productive since they feel that
the companies care of them well. The increasing productivity will also increase the selling, therefore
it influences the rising of profit earned. Researchs conducted by Nathania (2013), and Mardiandari
Then, spending some expenses for communities, such as donation for construction, makes the
companies be more attractive for the society, and the society will be more symphatetic toward the
companies. The society will assume that the company not only gains more profits, but also cares of
its surrounding environment. The company will have a good image, which increases the chance for
its products to be liked by the consumers, and implicates to the increasing profit. Primawati (2010)
found out that the community cost positively influence ROA.
Indeed, CSR expenditure decreases the companies’ profit, but actually the CSR expenditure
is potential to increase the revenue valuewhich might be more than company’s expenses for CSR
expenditure so that it increases the profit. Thereby, it can be stated that company’s expenses for CSR
expenditure positively influences financial performance (profitability).
H1 : employee welfare cost positively influences financial performance
H2 : community cost positively influences fianancial performance
The influence of CSR expenditure toward Tobin’s Q ratio
The influence of CSR toward firm value can be explained based on the signaling theory, as
when the company reveals its expenses for CSR, it means that the company will inform the information receiver, particularly the investors, about the company’s valuable prospect. The positively perceived information will influence investation rate of the investors. It can affect the company’s stock value as well as firm value. Nurlela and Ishlahudin (2008), Gunawan and Sri (2008) and Agustina (2013) confirmed that CSR disclosure has positive correlation with the firm value measured with Tobin’s Q ratio.
The amount of employee welfare cost and community cost spent by the company can be one
of the terms in discovering how the CSR performance has been implemented by the company. Nurlela
and Islahudin (2008) in Sutopoyudo (2009) stated that a good CSR performance makes thr investors
rate the firm value well. A good CSR practice will make the investors be more interested to the
company because they assume that the company has a good prospect.
The expenses for employee welfare cost and community cost, indeed, reduce the profit,
however the investors consider that a good prospect or benefit acquired are more important than the
expenses. The good prospect is related to the continuity and growth of the company, thus the investors are interested to invest or buy the company’s stock, and consequently the firm value will also increase. Companies which spend some money for CSR activities will have more opportunity in
increasing firm value than the companies that do not. From the explanation above, the proposed
hypotheses were:
H4: community cost positively influences firm value
RESEARCH METHODOLOGY
Source and Kind of Data
Secondary data which was obtained from companies’ annual financial statements from
Indonesian Stock Exchange Office in Semarang were used in this study. Data related to financial
performance, firm value, and corporate social responsibility expenditure were used in this study.
Population and Sampling Method
The population of this study was all companies registered in Indonesian Stock Exchange from
2012 to 2013. The sampling method applied was the purposive sampling method with several criteria:
(a) Companies provided their annual financial statements in consective 2 years, and included
employee welfare cost and community cost during the observation period, and (2) The financial
statements were presented in Rupiahs currency.
Definition of Variable Operations
1. Independent variable for CSR expenditure was proxied by:
1. The employee welfare cost was proxied by post-retirement costs. According to the
PSAK 24 year 2013, the post-retirement cost is a payable working allowance (other
than severance and short-term employee benefits) after the employee finished the
contract of emplyement. In the financial statement, the company includes it on the
Employee Benefits Liability account.
2. Community cost is expenses used for the society or an organizational groups
interacting with the companies (Mardiandari and Rustiyaningsih, 2013). The
community cost was proxied by donation account. In the financial statement, the
company includes donation account into administration and general cost classification.
2. Independent variable for financial performance variable was proxied by profitability ratio
measured by return of assets (ROA) ratio.
ROA = P o i a Tax
3. Whereas, dependent variable for firm value variable was proxied by Tobin’s Q ratio. Tobin’s
Q was calculated using a formula according to Darmawati, et al. (2005):
Tobin’s Q = � � � � � + � � � �
�� �
Data Analysis
Multiple regressions analysis was used in the hypothesis testing of this study. A classical
assumption test was conducted before performing multiple regression analysis. The classical
assumption test consisted of multicollinerity test (by looking at VIF and tolerance value),
autocorrelation test (Durbin Watson testing), normality test (Kolmogorov-Smirnov (K-S)
non-parametric test), and heteroscedasticity test (Glejser test) (Ghozali, 2011:103).
Multi-Regression Analysis
Multi-regression analysis was used in order to determine CSR expenditures’ influence toward
the financial performance and firm value variables. The first regression model was illustrated as
follow:
ROA = α+β1WELF+β 2COMM
Here is the regression analysis for the second model:
Tobin’s Q = α+β1WELF+β 2COMM
Y 1 = ROA
Y2 = Tobin’s Q
a = Constanta
β 1,β 2 = Regression Coefficient
WELF = Employee Welfare Cost
COMM = Community Cost
ANALYSIS AND DISCUSSION
Research Sampling
Population used in this study was all companies registered in Indonesian Stock Exchange from
Table 4.1 Research Sampling
Table 4.1 shows the research sampling process during 2 years observation period. The total
number of the samples collected during 2012 to 2013 period is 56 samples.
Descriptive Statistics
The table below presents the descriptive statistics results from 56 companies which includes
minimum, maximum and average scores from each variable.
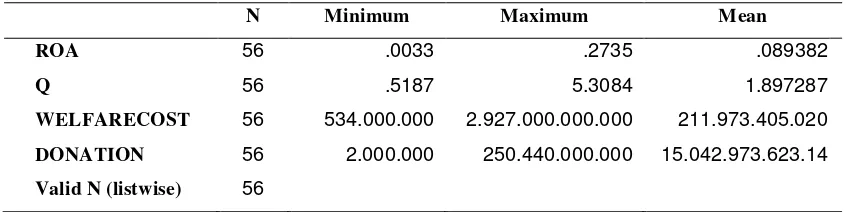
Tabel 4.2 Descriptive Statistics
N Minimum Maximum Mean
ROA 56 .0033 .2735 .089382
Q 56 .5187 5.3084 1.897287
WELFARECOST 56 534.000.000 2.927.000.000.000 211.973.405.020
DONATION 56 2.000.000 250.440.000.000 15.042.973.623.14
Valid N (listwise) 56
Source : Processed Secondary Data, 2015
Table 4.2 presents that the average of profitability or return of assets was 8,93 percents, which
means that every 1 Rupiah assets could earn 0,0893 Rupiahs of ROA rate. Firm value measured using Tobin’s Q showed the average value was 1, 8972. If Tobin’s Q rate’s value is more than 1, it shows the companies’ growth based on companies’ stock market value. This value also showed that the firm value was rated higher than the book value by the markets. Therefore, the company’s stock value in
stock market tended to increase.
The mean of statistical result of employee welfare cost was Rp 211.973.405.020. Analyzed
from both the minimum value, Rp 534.000.000, and maximum value, Rp 2.927.000.000.000, welfare
Information 2012 2013
Number of companies in BEI 472 498
Companies which did not report data
related to employee welfare cost and
community cost on annual financial
statements
(415) (440)
Financial statements presented in foreign
currency
(29) (30)
cost had a considerable range. The community cost measured by donation’s mean value was Rp
15.042.973.623.14. If it was seen from both the minimum value, Rp 2.000.000, and maximum value,
Rp 250.440.000.000, it also had a considerable range.
Classical Assumption Testing
From the result of the first multicolinearity test, tolerance rate and variance inflation factors
or VIF for employee welfare cost showed that there was multicolinearity. Therefore, the data were
improved by transforming the semilog research model with a natural logarithm in welfare cost
variable (Ghozali, 2007). After it was corrected, the tolerance rate from multicolinearity test result,
of financial performance equation, and firm value showed the same results, they were 0,634. On the
other hand, the variance inflation factor or VIF was 1,576. It proved that there was no multicolinearity
because the tolerance rate was more than 0,1 and the variance inflaction factor rate was less than 10. The result of Durbin Watson’s autocorrelation test showed the financial performance and firm value were 2, 186 and 1, 698, consequently. The dU value was 1, 681 ( sig=0,5 dan k’=2, ), both of
those value from Durbin Watson test showed that there was no autocorrelation as the value was more
than dU and less than 4 deducted by dU (2, 319).
Then, on Kolmogorov-Smirnov (K-S) non-parametric normality test of financial performance’s and firm value’s equation showed that the data were distributed normally. The value of financial performance proxied by return of assets’ equation using the Asymp.Sig. (2-tailed) was 0,101. Besides, the firm value measured using Tobin’s Q ratio got Asymp.Sig. (2-tailed) 0,072. Both
of those values showed that residual was distributed normally since the Asymp.Sig. (2-tailed) scores
were more than the significant rate 0, 05.
The Glejser test was used to determine the heteroscedasticity by regressing its residual
absolute value. The significant value as the result of Glejser test of financial performance equation
was ranged from 0, 133 to 0, 350. Besides, for the firm value equation, the result of significant value
was ranged from 0, 393 to 0, 728. Those results showed that the data have different variants or there
was no heteroscedasticity occurred because the significant value was more than 0, 05.
Discussion and Hypothesis Testing
Corporate Social Responsibility Expenditure and Financial Performance
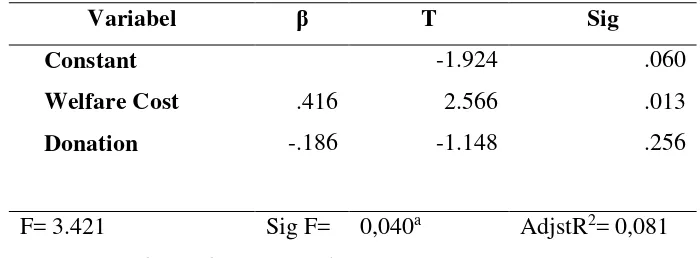
Table 4.4 below shows the results of multi regressions test for the equation of welfare cost,
Table 4.4 Summary of Financial Performance Regression Test
Variabel β T Sig
Constant -1.924 .060
Welfare Cost .416 2.566 .013
Donation -.186 -1.148 .256
F= 3.421 Sig F= 0,040a AdjstR2= 0,081
Source : Processed Secondary Data, 2015
Table 4.4 shows that the Adjusted R2 value was 0,081 which means that the dependent
variable, the employee welfare and community costs, could only explain 8,1 percents of financial
performance. While the other 91,9 percents were explained by factors other than independent
variables.
Employee Welfare Cost and Financial Performance
The regressions test result for the first hypothesis, the employee welfare cost, was β 0,416
with significancy 0, 013 indicting that the hypothesis was accepted. It could be inferred that welfare
cost positively influenced financial performances because the significant value was less than 0, 05.
Therefore, it could be inferred that welfare cost positively influenced financial performance
since the significant value was less than 0,05. This accepted hypothesis explained that a company
spending more welfare cost was able to increase company’s financial performance. By maximizing
employee welfare cost, employees would feel that the company cared of them. Consequently, the
employees would be more loyal to the company and worked harder in increasing company’s selling,
which would also increase company’s profit. The employee welfare cost did have negatif influence toward company’s profit, but the benefits acquired, which was the selling improvement, had higher value than employee welfare cost, therefore it positively influenced company’s financial performance. This result is in line with Primawati’s (2010) and Nathania’s (2013) researchs which show that the employee welfare cost positively influences return of assets.
Community Cost and Financial Performance
The result of the second hypothesis testing which was community cost proxied by donation
was β -0.186 with significancy 0, 256, thus it showed that the hypothesis was rejected. Community
value. Societies consider other factors, such as company products’ price and quality, than the company’s good image. Therefore, community cost did not affect company’s financial performance. This finding is in agreement with the studies conducted by Mardiandari and Rustiyaningsih (2013)
and Januarti and Dini (2005).
Corporate Social Responsibility Expenditure and Firm Value
The result of multi regressions test for the equation of independent variables, welfare cost and
community cost (donation) toward firm value (Tobin’s Q) is presented in the following table:
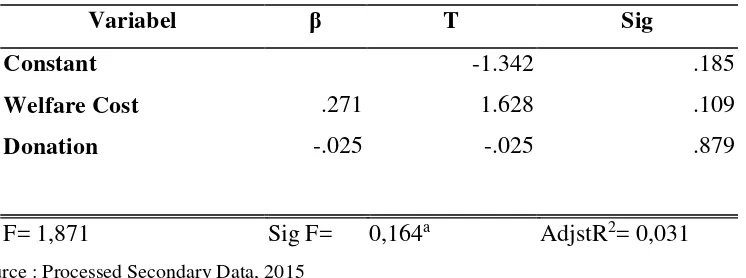
Table 4.5 Summary of Firm Value Regressions Test Result
Variabel β T Sig
Constant -1.342 .185
Welfare Cost .271 1.628 .109
Donation -.025 -.025 .879
F= 1,871 Sig F= 0,164a AdjstR2= 0,031
Source : Processed Secondary Data, 2015
Referring to table 4.5, it is presented that the Adjuster R2 value was 0,031, which means that
the independent variables, which were employee welfare cost and community cost, were only able to explain 3,1 percents of the firm value (Tobin’s Q). While the other 96,9 percents were explained by factors other than the independent variables.
Employee Welfare Cost and Firm Value
The result of regressions test for the third hypothesis, which was employee welfare cost,
showed β 0,271 with significancy 0, 109, which showed that the third hypothesis was rejected. It
indicated that employee welfare cost had no effect toward firm value as its significant value was
higher than 0,05. This hypothesis showed that employee welfare cost expended by the company did not affect company’s firm value. The high employee welfare cost might be potential in increasing the number of selling, but the high expenses on employee welfare cost would also reduce company’s
net profit if the selling did not increase higher than the expenses. Investors tended to not use employee
welfare cost as the major consideration as they invested because its financial benefit had not been
Community Cost and Firm Value
The result of the fourth hypothesis testing, which was community cost proxied by donation,
was β -0.118 with significancy 0,468 which indicated that the hypothesis was rejected. Community
cost had no influence over firm value as its significancy was higher than 0, 05. A company’s expenses
on community cost did not affect company’s stock selling level. According to the investors, the
expenses for community cost in a form of donation in order to show company’s good prospect had
not been confirmend yet. Community cost might be potential in establishing a good company image
which in the future would provide a good prospect related to the company’s continuity and growth.
However, high community cost was also not ideal for both the companies and investors as those
expenses deducted company’s nett profit. Community cost had not been able to provide specific
financial benefits for both the company and investors. Therefore the investors tended to not consider
the number of company’s community cost when they were interested to buy company’s stocks. In
conclusion, the community cost had no effect toward firm value.
CONCLUSION AND SUGGESTION
Conclusion
Based on the hypotheses testing, it could be concluded that employee welfare cost proxied by
post-retirement costs had positive influence over financial performance. Community expenditure was
proxied by donation cost had no influence over financial performance. Besides, the employee welfare
cost as well as community cost had no effect toward firm value.
Implications
From the result of the study, it was found that employee welfare positively influenced
financial performance. The companies are expected to pay attention to employee welfare cost because
it is proven increasing financial performance, particularly companies’ profit. On the other hand, the
investors may consider the corporate social responsibility expenditure in making an investment
decision, particularly the employee welfare cost since it positively influence company profitability
performance.
Limitation and Suggestion
This research only used 2 years observation period, from 2012 to 2013. Thus, it still less
represents the benefits of corporate social responsibility implementation. There were only a few
to report the donation expenses to the account of other expenses which is included in the classification
of administrative and general expenses. Based on those limitations, the future study should be able to
further analyze the detail related to donation cost which is included in the other expensess under
administrative and general cost classification. Besides, the future research may also extend the
observation period in order to obtain more samples.