Correlation of Cadmium Intake from Water and Biomarkers in Resident
Living Around Namobintang Dumpsite
Taufik Ashar
1,*, Wirsal Hasan
1, Hamonangan Nainggolan
2, and Erman Munir
3 1Department of Environmental Health, Faculty of Public Health, Universitas Sumatera Utara Jl. Universitas No. 21 Medan 20155, Indonesia
2
Department of Chemistry, Faculty of Mathematics and Natural Sciences, Universitas Sumatera Utara Jl. Bioteknologi 1 Medan 20155, Indonesia
3
Departement of Biology, Faculty of Mathematics and Natural Sciences, Universitas Sumatera Utara Jl. Bioteknologi 1 Medan 20155, Indonesia
Received December 8, 2014; Accepted May 6, 2015
ABSTRACT
Cadmium (Cd) is a toxic element ubiquitous in the environment and can cause kidneys damage. The aim of this study was to determine the concentration of Cd in wells water and urine of population that lived around Namobintang dumpsite, and to examine the quantitative relationship between urinary Cd and other risk factors and β2 microglobulin in urine (β2-MG-U) as a marker exposure to Cd. This study was performed in the community residence around Namobintang dumpsite. Water samples were collected from the wells around the dumpsite. The area selected was of about 1 km radius from the dumpsite. A total of eighty urine samples checked using primary data. Adult males and females aged 18-78 years old were the respondents. Study results showed that Cd levels from the wells revealed that 73 respondents (91.3%) had exposed to Cd higher than normal levels (5 µg/L). 14 urine samples (17.5%) had high Cd levels above the normal limits and 48 urine samples had high β2-MG-U levels. There was a significant correlation between the Cd levels from the wells and β2-MG-U levels (r = 0.278, p = 0.012). UCd levels had also significant correlation with β2-MG-U levels (r = 0.29, p = 0.009).
Keywords:Cd; wells; β2microglobulin urine
ABSTRAK
Kadmium (Cd) adalah unsur toksik yang terdapat di lingkungan dan dapat menyebabkan kerusakan ginjal. Tujuan dari studi ini adalah untuk mengetahui konsentrasi Cd dari air sumur dan urin dari warga yang bermukim di sekitar Tempat Pembuangan Akhir (TPA) sampah Namobintang dan untuk mengetahui hubungan antara Cd urin dan faktor risiko lainnya dan β2mikroglobulin urin (β2-MG-U) sebagai biomarker pajanan Cd. Studi ini dilakukan di pemukiman warga yang tinggal di sekitar TPA Namobintang. Sampel air dikumpulkan dari sumur-sumur yang terdapat di sekitar area TPA. Daerah studi berada pada radius 1 km dari batas terluar TPA. Urin dikumpulkan dari seluruh responden yang berjumlah 80 orang, yang berusia antara 18-78 tahun. Hasil penelitian menunjukkan bahwa 73 responden (91,3%) terpapar pada air sumur yang mengandung Cd yang telah melebihi nilai batas normal (5 µg/L). Sebanyak 14 sampel urin (17.5%) mempunyai kadar Cd yang melebihi nilai normal dan sebanyak 48 sampel urin memiliki nilai β2-MG-U yang sangat tinggi. Hasil analisis menunjukkan bahwa terdapat korelasi yang signifikan antara kadar Cd dari sumur dan kadar β2-MG-U serta kadar Cd urin juga berkolreasi secara signifikan dengan kadar β2-MG-U.
Kata Kunci:Cd; air sumur; β2mikroglobulin urin
INTRODUCTION
In Indonesia, final disposal management generally used open dumping method. Studies related to heavy metal pollution from the dumpsite has also been frequently made [1-3]. Medan which is one of the biggest cities in Indonesia produces about 5.495 tons or 1.374 cubic meters of municipal solid waste every day. Of the
of people living in its surrounding areas. Namobintang which has an area of approximately 17.6 hectares does not have channels and pools of leachate. Leachate generated from the biodegradation of garbage stacked in the dumpsite has potential to contaminate groundwater. The presence and potential exposures of the community to groundwater contaminants may contribute to the predilection of human health impacts, from simple poisoning to cancer, heart diseases and teratogenic abnormalities. This is due to most of the community using wells as a primary source of cooking and drinking water.
Environmental Management Department of Energy and Mineral Resources of Medan City had monitored the quality of the environment around Namobintang dumpsite in October and November 2008. The results showed that all five monitoring wells around the dumpsite had Cd content exceeded the maximum levels allowed by the Regulation of the Health Minister of the Republic of Indonesia No. 416 by the year 1990 concerning Clean Water quality requirements (0.005 mg/L). The lowest Cd concentration was 0.011 mg/L and the highest concentration of 0.026 mg/L.
Ashar and Santi [3], conducted a study to find out the content of Cd of the wells at Namobintang. They found all of 60 water samples had exceeded threshold value. Cd is an environmental pollutant that is known to cause kidney damage [4]. Biological half-life of Cd is estimated at about 7 to 16 years that accumulates in the body, especially the kidneys and liver [5]. An early sign of Cd-induced kidney dysfunction is urinary excretion of low molecular weight proteins. Low molecular weight proteins such as Beta 2 microglobulin (β2 MG), retinol
binding protein (RBP), or α1microglobulin are currently used for screening for proximal tubular injury. Tubular proteinuria has been shown at UCd levels that occur not only in occupationally but also in environmentally exposed European populations [6]. In this study we have assessed β2-MG-U as biomarker of early tubular damage.
The aims of this study are to determine the concentration of Cd in water and UCd from the residents that lived around the dumpsite, and to find whether a correlation exists between UCd, other risk factors and β2
microglobulin in urine (β2-MG-U) as a marker exposure to Cd and as a marker of renal tubular dysfunction.
EXPERIMENTAL SECTION
Materials
This study was an observational quantitative study used cross-sectional design. This study was performed in the community residence around Namobintang
dumpsite, Deli Serdang District, North Sumatera Province, Indonesia. Namobintang which had been operating since July 5, 1987, has an area of 17.6 hectares and was 15 km from Medan, the capital city of North Sumatera Province. Final disposal management at Namobintang had been used open dumping method, but at December 2013 city government of Medan had closed this site according to regulation of Republic of Indonesia no. 18/2008.
Study population
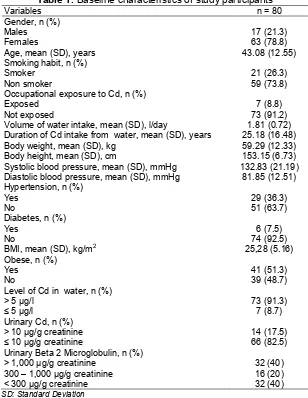
Table 1.Baseline characteristics of study participants
Variables n = 80
Gender, n (%)
Males 17 (21.3)
Females 63 (78.8)
Age, mean (SD), years 43.08 (12.55)
Smoking habit, n (%)
Smoker 21 (26.3)
Non smoker 59 (73.8)
Occupational exposure to Cd, n (%)
Exposed 7 (8.8)
Not exposed 73 (91.2)
Volume of water intake, mean (SD), l/day 1.81 (0.72) Duration of Cd intake from water, mean (SD), years 25.18 (16.48)
Body weight, mean (SD), kg 59.29 (12.33)
Body height, mean (SD), cm 153.15 (6.73)
Systolic blood pressure, mean (SD), mmHg 132.83 (21.19) Diastolic blood pressure, mean (SD), mmHg 81.85 (12.51) Hypertension, n (%)
Yes 29 (36.3)
No 51 (63.7)
Diabetes, n (%)
Yes 6 (7.5)
No 74 (92.5)
BMI, mean (SD), kg/m2 25,28 (5.16)
Obese, n (%)
Yes 41 (51.3)
No 39 (48.7)
Level of Cd in water, n (%)
> 5 µg/l 73 (91.3)
≤ 5 µg/l 7 (8.7)
Urinary Cd, n (%)
> 10 µg/g creatinine 14 (17.5)
≤ 10 µg/g creatinine 66 (82.5)
Urinary Beta 2 Microglobulin, n (%)
> 1,000 µg/g creatinine 32 (40)
300 – 1,000 µg/g creatinine 16 (20)
< 300 µg/g creatinine 32 (40)
SD: Standard Deviation
Procedure
Collection of water samples from the wells
Water samples were collected from the wells around the dumpsite to measure Cd levels. We defined this level as Cd level from water because Cd level in water will not decrease in boiling water. The area selected was of about 1 km radius from the dumpsite. The samples were collected in the sterile polythene bottles of 1 liter capacity. During sampling all the precautions were taken as per the standard guidelines, to avoid any possible contamination. In case of wells the samples were collected by lowering the bottle at depth of about 1 feet below the surface and then opening the cap to collect the water and for bore wells the tap was fully opened and allowed to run to waste for about 5 min, then the sample was collected in the sterile sampling bottles. The analysis to determine Cd level was
measured with Zeeman Effect Graphite Furnace Atomic Absorption Spectrophotometer (GFAAS).
Collection of biological samples
Table 2. Descriptive statistics of urinary Cd and β2-MG levels
Variables Mean (SD) Min Max 95% CI
Cd levels in water, µg/L 9.2 (2.9) 2.7 15.6 8.5 – 9.9
UCd levels, µg/g creatinine 6.81 (8.82) 0.69 35.09 5.29 – 8.33
β2-MG-U levels, µg/g creatinine 1295.89 (2077.53) 0.35 11459.2 833.56 – 1758.23
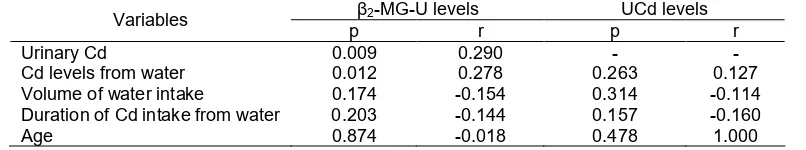
Table 3.Spearman Correlation between Cd levels from water, age and Cd marker exposures
β2-MG-U levels UCd levels
Variables
p r p r
Urinary Cd 0.009 0.290 -
-Cd levels from water 0.012 0.278 0.263 0.127
Volume of water intake 0.174 -0.154 0.314 -0.114
Duration of Cd intake from water 0.203 -0.144 0.157 -0.160
Age 0.874 -0.018 0.478 1.000
for variation in the diluteness of urine, urinary Cd levels and urinary β2-MG were expressed as urine Cd/urine
creatinine (µg/g) and urine β2-MG/urine creatinine (µg/g). Creatinine level in urine was measured by Jaffe’s method.
Statistical analysis
Data analysis had been done using “Statistical Package for Social Sciences” (SPSS) version 21. For categorical variables were presented in frequency distribution and percentage. Numerical variables were represented as means (standard deviation = SD) First the normality of data had been assessed using Kolmogorov Smirnov. Spearman’s correlation test was used to test the correlation in continuous variables. The mean difference urinary β2-MG levels based on categorical independent variables (gender, smoking habit, hypertensions, diabetes, and obesities) were tested using Mann Whitney Test. All p values refer to two sided hypotheses (p < 0.05). Multiple Linear regression analysis was done to predict the outcome of a response variable (β2-MG-U levels) and to model the relationship between the risk factors and β2-MG-U levels.
RESULT AND DISCUSSION
The study includes 80 respondents aged 18–78 years old with age mean of 43.08. Genders were as 17 (21.3%) males and 63 (78.8%) females. 21 participants (26.3%) had smoking habit. The determination of Cd levels from the wells revealed that 73 respondents (91.3%) had exposed to Cd higher than normal levels (5 µg/L). Baseline characteristics of the participants are shown in Table 1.
Table 2 explored that Cd concentration in water was ranged between 2.7 to 15.6 µg/L and the mean was 9.2 µg/L. The geometric mean urinary Cd concentration was 6.81 µg/g creatinine (range: 0.69–5.09 µg/g creatinine). As we can see in Table 1, there are 14 participants (17.5%) had urinary Cd levels higher than
normal levels (10 µg/g creatinine). Meanwhile, β2 -MG-U levels showed 1295.89 µg/g creatinine in geometric mean with range: 0.35–11459.2 µg/g creatinine. Based on the cutoff value for early renal tubular dysfunction (> 300 µg/g creatinine), 48 participants (60%) had exceed levels.
We found weak correlation between Cd levels from the wells and β2-MG-U levels (r = 0.278; p = 0.012). The same results was also shown from the correlation between UCd and β2-MG-U levels (r = 0.29, p = 0.009). There were no significant correlation between other variables and β2-MG-U levels (p > 0.05) as seen in Table 3.
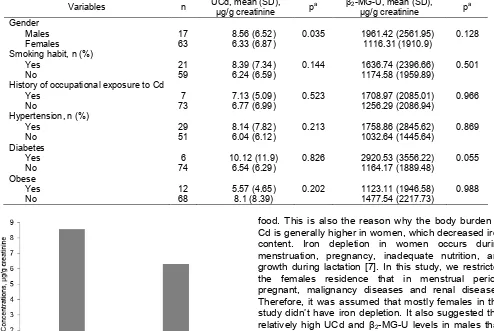
There was a significant difference (p = 0.035) between urinary Cd levels of males (8.56 µg/g creatinine ; SD = 6.52 µg/g creatinine) and females (6.33 µg/g creatinine; SD = 6.87 µg/g creatinine). In contrast, there weren’t significant differences of geometric mean between Cd levels in urine and smoking habit, history of occupational exposure to Cd, hypertension, diabetes and obesity (p > 0.05).
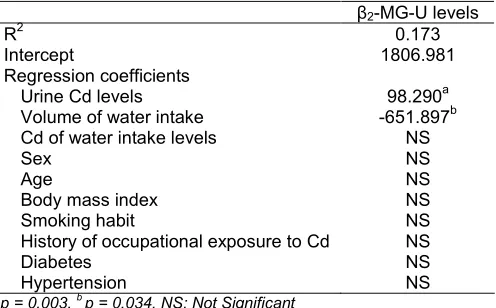
In order to determine which of the risk factors best explained the association between the risk factors and the β2-MG-U, multiples linear regressions was done (enter method). Linear regression analysis revealed that only two independent variables/risk factors can predict β2-MG-U levels, UCd levels and volume of water intake (Table 4).
The total model was significant (p < 0.001) and accounted for 17.3% of the variance in the urinary β2 MG (R square = 0.173). From this model we can calculate urinary β2-MG levels by this formula: y = 1806.98 + 98.29*(UCd levels) – 651.9 (volume of water intake).
Fig 1. Correlation between Cd levels from the wells and measured β2-MG-U levels (A) and correlation between UCd
levels and β2-MG-U levels (B)
Table 4. The mean difference of UCd and β2-MG-U levels based on gender, smoking habit, history of occupational exposure to Cd, hypertension, diabetes, and obesity
Variables n UCd, mean (SD),µg/g creatinine pa β2-MG-U, mean (SD),µg/g creatinine pa
Gender
Males 17 8.56 (6.52) 0.035 1961.42 (2561.95) 0.128
Females 63 6.33 (6.87) 1116.31 (1910.9)
Smoking habit, n (%)
Yes 21 8.39 (7.34) 0.144 1636.74 (2396.66) 0.501
No 59 6.24 (6.59) 1174.58 (1959.89)
History of occupational exposure to Cd
Yes 7 7.13 (5.09) 0.523 1708.97 (2085.01) 0.966
No 73 6.77 (6.99) 1256.29 (2086.94)
Hypertension, n (%)
Yes 29 8.14 (7.82) 0.213 1758.86 (2845.62) 0.869
No 51 6.04 (6.12) 1032.64 (1445.64)
Diabetes
Yes 6 10.12 (11.9) 0.826 2920.53 (3556.22) 0.055
No 74 6.54 (6.29) 1164.17 (1889.48)
Obese
Yes 12 5.57 (4.65) 0.202 1123.11 (1946.58) 0.988
No 68 8.1 (8.39) 1477.54 (2217.73)
Fig 2. The difference of urinary Cd levels based on gender
food. This is also the reason why the body burden of Cd is generally higher in women, which decreased iron content. Iron depletion in women occurs during menstruation, pregnancy, inadequate nutrition, and growth during lactation [7]. In this study, we restricted the females residence that in menstrual period, pregnant, malignancy diseases and renal diseases. Therefore, it was assumed that mostly females in this study didn’t have iron depletion. It also suggested that relatively high UCd and β2-MG-U levels in males than females result from a high occupational exposure and from the effect of cigarette smoking.
Table 5.Linear regression for factors associated with β2
-Urine Cd levels 98.290a
Volume of water intake -651.897b
Cd of water intake levels NS
Sex NS
Age NS
Body mass index NS
Smoking habit NS
History of occupational exposure to Cd NS
Diabetes NS
Hypertension NS
ap = 0,003,bp = 0,034, NS: Not Significant
It has been reported that one cigarette contains 1 to 2 μg of Cd [8]. According to the study of Haddam et al. [9],the levels of Cd in urine were higher in current smokers than non smokers (1 vs 0.48 μg/gCr) among between Zinc smelter workers in Algeria. The increased excretion of urinary low molecular weight proteins such as β2-MG is most probably due to the renal toxicity of tobacco smoke. Several studies have indeed shown that chronic smoking, even moderate, is associated with an increased urinary excretion of proteins.
There were no significant differences in the mean of UCd and β2-MG-U levels according to diabetes and hypertension condition. However, the levels of both Cd exposure markers showed higher levels in diabetes and hypertension respondents. Some literatures showed that Cd exposure had significant correlation with diabetes in countries such as Pakistan (10), China (11), and Australia (12). As noted by Edwards and Prozialeck [13], the incidence of diabetes is rising globally and has reached epidemic levels in some nations. Thus, the potential role played by low-dose Cd in pre-diabetes and diabetes warrants further research. Afridi et al. [10] reported higher blood and urinary Cd among Pakistani men 31–60 years of age who had had type 2 diabetes, on average, for 16 years.
Eum et al. [14] observed a dose–response relationship between urinary Cd and hypertension. Of the Korean subjects in their study, 26.2% were hypertensive. For this population, the mean blood Cd was 1.67μg/L, and the risk estimate for hypertension was 1.51 when blood Cd levels in the lowest tertile were compared with those in the highest. An association was also found between blood Cd and blood pressure levels in a U.S. sample population, where the mean blood Cd was 3.98-fold lower than the mean level found in the Korean study [15]. The strength of the Cd blood pressure association was greatest among nonsmokers, intermediate among former smokers, and small or absent among current smokers. These findings support
“pressor” effects, which have been shown to be characteristic of chronic exposure to low-dose Cd [16].
91.3% participants in this study had exposed to Cd from water that exceeded the normal value. Based on Spearman correlation it was shown that Cd levels in water had proven to have a significant correlation with β2-MG-U. 0f 80 respondents, 40% showed β2-MG-U levels had exceeded normal value (1,000 µg/g creatinine). It is considered to indicate irreversibility of renal effects. This level is typically associated with urinary Cd of greater than 5 µg/g creatinine [17]. Based on multivariate analysis, it was shown that only UCd levels and volume of water intake can predict β2-MG-U levels and this model accounted for 17.3% of the variance in the urinary β2-MG-U levels.
β2-MG-U has been most widely employed as a standard marker for monitoring for the early stages of Cd exposure and toxicity. It is also the marker currently in use that has been related to severity of tubular dysfunction, in the absence of other disease conditions [18]. The increased levels of β2-MG-U indicates a change in glomerular filtration and renal tubules, lymphatic disease, renal tubular damage due to exposure to heavy metals (Cd and Hg) as well as the rejection of kidney transplants.
CONCLUSION
In conclusion, we showed that exposure to Cd from water at the surrounding dumpsite had a significant correlation to early kidney damage biomarker. 14 urine samples (17.5%) had high Cd levels above the normal limits and 40 urine samples had high β2-MG-U levels. There was a significant correlation between the Cd levels from the wells and β2-MG-U levels (r = 0.278, p = 0.012). UCd levels had
also significant correlation with β2-MG-U levels (r = 0.29, p = 0.009).
ACKNOWLEDGEMENT
First author gratefully acknowledges The General Directorate of Higher Education for the support of this research in the year of 2013.
REFERENCES
1. Ashar, T., 2007, Jurnal Kesmas Nasional, 2 (3), 106–111.
2. Oktiawan, W., and Priyambada, I.B., 2008, Jurnal Presipitasi, 4 (1), 56–61.
3. Ashar, T., and Santi, D.N., 2013, Jurnal Kesmas Nasional, 7 (9), 408–414.
5. Nordberg, G.F., Nogawa, K., Nordberg, M., and Friberg, L.T., 2007, Handbook on toxicology of metals, 3rd Ed., Eds: Nordberg, G.F., Fowler B.A., Nordberg, M., Friberg, L.T., Elsevier, Amsterdam, 445–486.
6. Olsson, I.M., Bensryd, I., Lundh, T., Ottosson, H., Skerfving, S., and Oskarsson, A., 2002, Environ. Health Perspect., 110 (12), 1185–1190.
7. Adnan, J.A., Azhar, S.S., Hasni, J.M., and Ahmad, J.S., 2012, Am-Eurasian J. Toxicol. Sci., 4 (2), 80– 88.
8. Nadig, R.J., 1998, Cd and other metals and metalloids, Goldfrank’s Toxicologic Emergency, 6th Ed., Connecticut: Applecton and Lange, 1063–1087. 9. Haddam, N., Samira, S., Dumont, X., Taleb, A.,
Lison, D., Haufroid, V., and Bernard, A., 2011, Environ. Health, 10 (37), 1–9.
10. Afridi, H.I., Kazi, T.G., Kazi N., Jamali, M.K., Arain, M.B., Jalbani, N., Baig, J.A., and Sarfraz, R.A., 2008,Diabetes Res. Clin. Pract., 80 (2), 280–288.
11. Chen, L., Lei, L., Jin, T., Nordberg, M., and Nordberg, G.F., 2006, Diabetes Care, 29 (12), 2682–2687.
12. Haswell-Elkins, M., Satarug, S., O’Rourke, P., Moore, M., Ng, J., McGrath, V., and Walmby, M., 2008,Environ. Res., 106 (3), 379–383.
13. Edwards, J.R., and Prozialeck, W.C., 2009, Toxicol. Appl. Pharmacol., 238 (3), 289–293. 14. Eum, K.D., Lee, M.S., and Paek, D., 2008, Sci.
Total Environ., 407 (1), 147–153.
15. Tellez-Plaza, M., Navas-Acien, A., Crainiceanu, C.M., and Guallar, E., 2008, Environ. Health Perspect., 116 (1), 51–56.
16. Satarug, S., Nishijo, M., Ujjin, P., Vanavanitkun, Y., and Moore, M.R., 2005,Toxicol. Lett., 157 (1), 57– 68.
17. Huang, J., 2004,Biometals, 17 (5), 511.