IJG Vol. 46, No.1, June 2014 (52 - 61) © 2014 Faculty of Geography UGM and he Indonesian Geographers Association
Urban Socio-Economic Variables and Intra-Urban Trips
in Ogun State, Nigeria
Solanke Muse Olayiwola
Received: 04 02 2014 / Accepted:19 02 14/ Published online: 30 06 2014 © 2014 Faculty of Geography UGM and he Indonesian Geographers Association
Abstract his study examines the relative inluence of socio-economic variables of urban centers on intra-city trip generation. Data were collected on sixteen socio-economic variables and household trip generation in fourteen urban centers of the state. he nature and degree of relationships between socio-economic variables and trips generated were established through simple bivariate correlation technique. Multiple regression analysis was used to explain variables that predict trips generated. he principal component analysis was used to resolve observed collinearity problem in re-gression analysis.here is a strong signiicant positive correlation between trip generated and 13 out of sixteen socio-eco-nomic variables. he principal component analysis on the socio-ecosocio-eco-nomic variables produced two components: social and commercial component and industrial development component.he two components explain 58.68% of variation in intra-urban trips generated (F=7.830, P≤0.50), (F=13.982, P≤0.50). he industrial development component does not provide signiicant explanation.he study emphasizes the need for proper planning and efective monitoring of develop-ing of socio-economic variables in cities because of their critical inluence on trip generation.
Abstrak Penelitian ini menguji pengaruh relatif variabel sosio-ekonomi dari pusat-pusat perkotaan terhadap munculnya
perjalanan perkotaan. Data yang digunakan berupa enam belas variabel sosio-ekonomi dan data perjalanan intra-perkotaan oleh rumah tangga di empat belas pusat-pusat intra-perkotaan. Sifat dan derajat hubungan antara variabel sosio-eko-nomi dan jarak perjalanan yang dihasilkan dianalisis melalui teknik korelasi bivariat sederhana. Analisis regresi berganda digunakan untuk menjelaskan variabel prediksi perjalanan yang dihasilkan. Komponen utama analisis yang digunakan untuk analisis kolinearitas adalah analisis regresi.Terdapat korelasi positif yang signiikan yang kuat antara perjalanan yang dihasilkan dan tiga belas dari enam belas variabel sosio-ekonomi. Analisis variabel sosio-ekonomi menghasilkan dua komponen : komponen sosial-komersial serta komponen perkembangan industri. Dua komponen ini menjelaskan 58,68 % variasi dalam perjalanan intra-perkotaan yang dihasilkan (F = 7.830 , P ≤ 0.50), (F = 13,982 , P ≤ 0,50). Komponen perkembangan industri tidak memberikan hasil yang signiikan. Studi ini menekankan perlunya perencanaan yang tepat dan pengawasan yang efektif untuk memantau perkembangan sosio-ekonomi di kota-kota karena pengaruh kritis mereka pada perjalanan yang dihasilkan.
Keywords: Trip generation, urban centers, Nigeria, intra-urban travels, Ogun State.
Kata kunci: Penentu perjalanan, pusat perkotaan, Nigeria, perjalanan intra-perkotaan, Kawasan Ogun.
Trip generation, consequent upon human travel is inevitable. It takes place as a result of urge or desire to satisfy felt needs arising from the separation of land uses. In urban centers worldwide, human travels take place when residents carry out their diferent activities in diferent places either by necessity or by choice. In some distant past, especially before the advent of mod-ern transportation, the morphology of cities where de-pendent upon the mode of movement. In cities where there were canals, the structure was linear as water al-lowed easy interaction between one place and the other. In cities where this did not exist, the structure was es sentially concentric as city plans were done in a way to minimize transport. Such cities had high densities of housing and population. Houses were multipurpose in
S. M. Olayiwola
Department Of Geography And Regional Planning, Olabisionabanjo University
Email: [email protected]
nature as they provided residences and workshops. Be-cause of lack of mechanized transport, the early towns were small in size, intra-city mobility was low, restricted to short trek able distances and carrying of goods by head portage [Solanke, 2005; Oyesiku, 2010].
Indonesian Journal of Geography, Vol. 46 No.1, June 2014: 52 - 61
that are not available at the origins of their journeys. In fact trip generation in urban centers has been logically described as a function of complex interaction of socio-economic factors relating to both the residents and ur-ban centers [Oyesiku, 1990; Hanson and Schwab, 1995; Solanke, 2005].
he work of Adeniyi [1985, 1987] revealed that pat-tern of urban movement is inluenced by the size and density of settlement, topography, length of journey, income and household characteristics. It is also em-phasized that demand for transport and travel intensity tend to increase sharply with the size of a city especially when the center or major areas of activity increase cor-respondingly in terms of both area and employment. Also, Hanson and Schwab [1995] noted that trip char-acterristics vary with the characteristics of traveller and with the nature of the urban environment and trans-portation system. Among the aspects of the urban en-vironment that help to shape travel pattern according to Hanson and Schwab [1995] include the location and quality of diferent activity sites or potential destinations such as employment places, retail outlets, parks, banks, medical facilities and schools. In other words, the socio-economic variables of urban centers. While the works of Adeniyi [1985] and Hanson and Schwab [1995] pro-vide some useful guides into the study of urban trip generation pattern, they did not demonstrate in empiri-cal terms the inluence of each of these variables on trip generation in urban centers; a shortcoming that neces-sitates further empirical study on urban trip generation. he work of Barber [1995] emphasized that not 2. he principal function of the city, for example-manufacturing, tourism and administration. 3. he particular geographical setting 4. he proportion of the growth of the
city that occurred in each of the ma-jor transportation technology eras. he idea above suggests there would be signii-cant diferences in the trip generation between one city and the other, especially between an older city of a re-gion and rapidly growing city due to variation in the level of socio-economic variables among urban centers. However, in spite of the numerous evidences sup-porting the contribution of socio-eco-nomic factors of urban centres to trip gene-ration, an explicit picture of the relationship between the two (trip generation and socio-economic variables) still need to be established. In other words, the potentials/relative importance or oth-erwise of each of development indicators in a city is yet
to receive desired attention in urban transportstudies. his study therefore focuses on socio-economic variable of urban centers in relation to intra-city trip generation. his is an attempt to answer a pressing question usually faced by policy makers when considering changes in urban trip generation especially along what perspec-tive of socio-economic variables must an urban center develops to cause a signiicant change in urban travel?
he study area, Ogun State is one of the fast de-Akanni [2000] about 1,200-km2 of the state is of
sedi-mentary formation while about 400km2 is of
base-ment complex rocks of pre-Cambrian formation. he relief of the state, like other parts of the country is more or less coinciding with the major rocks types.
here are two main relief regions: irst, the creeks and lagoons forming a small section in the south east-ern part of the state, the altitude of which ranges from 0 to 40 meters above the sea level. Second, the undu-lating coastal plain and the low lands with the eleva-tion increasing northwards from about 30 to 250 me-ters above sea level. he plain is broken by sand stone cresta especially towards the western part of the state. here are pockets of rock Outcrops dotting the land-scape especially around state capital (Abeokuta). he whole state is drained by lowing coastal rivers such as Ogun, Yewa, and Shasha from Oyo state through the thickly vegetated western part of the state. Numer-ous small rivers and streams are at the south eastern parts lowing perennially through the swampy terrain.
he state is within the tropical humid climatic zone of Nigeria which is generally characterized, by high rainfall and high relative humidity. his is at-tributable to the prevalence of moisture laden tropi-cal maritime air mass over the state for about nine months in a year. he mean relative humidity varies from 66.2% in January to 88.4% in July [Akanni, 2000].
he rainfall shows a double maximadistri-bution reaching the peak during the months of June and Sep-tember.he average monthly rainfall for the state ranges between 7.1 mm in the month of January to 208.27 mm in the month of June. he mean annual temperatureis 26oc; although with some variations over time. he mean
diurnal minimum temperature varies from 21.8oc in
De-cember to 24.34oc in April while the mean diurnal
maxi-mum temperature varies from 33.92oc to 37.1oc at the
On the basis of climatic features, the state is char-acterized by two distinct weather seasons: the wet and dry. he wet season marked by lower mean tempera-ture, higher total rainfall and higher relative humidity is usually experienced between the months of February and October. However, little dry season is sometimes experienced in August, a phenomenon character-ized by drastic reduction in the frequency and inten-sity of rainfall and referred to as ‘August break’. he dry season sets in by November and persists till the end of January. It is usually accomplished by harmat-tan cold, brought by the prevailing north-west winds. In terms of vegetation, the state can be divided vegetation, having been altered by human activities.
In the pre-colonial era, the economy of the state, like those of most other traditional Nigerian towns was characterized by farming, crat production, trade and town administration [Oyesiku, 1990; Ademiluyi 1996]. he establishment of colonial rules in the state brought new forms of economic activities which are characteristics of western economy, and there have also beensome modiications to the traditional system of production. hus, several identiiable modern eco-nomic activities including banks, insurance, houses, modern and traditional markets, petrol stations, mo-tor companies, commercial enterprises, light and heavy industrial organizations are now found in dif-ferent urban centers in varying degrees.Some settle-ments, especially the capital (Abeokuta) beneited immensely from their early contactwith the Euro-pean population (the missionaries) who helped in the development of such areas by establishing mission houses, schools, churches, dispensaries and hospitals.
Agriculture the mainstay of the economy provides the major single occupation for the people of the state es-pecially those in the rural areas. Arable crops like maize, yam, cassava, rice, cocoyam, groundnut, melon, banana plantain, oranges, pineapple, sugar-cane and kolanuts are produced in the state. he major export crops pro-duced are cocoa, cofee, rubber and palm kernel. In the Riverine areas, people engage in extensive ish farming, lumbering activities also thrive because the state is en-dowed with appreciable forest resources. his perhaps accounts for the high number of sawmills in the state. Another major economic activity in the state is ex-tensive trading and light commercial merchandising. he people are engaged in buying and selling of all types of goods ranging from local household utensils in food, beverage and manufactured goods.he industrial sector constitutes another economic activity. Among the ma-jor industrial types in the state are: food, beverages and tobacco, textile, weaving apparel and products,
fabricat-ed metalproducts, wood and wood products, chemical products, pulp, paper products, printing and publish-ing, non-metallic minerals, motor vehicles and mis-cellaneous assemblies, domestic/industrial plastic and rubber products and electrical and electronics [Odug-bemi, 1993]. he potentials of the state for industrial de-velopment are as a result of her natural, agricultural and forestry resources and proximity to Lagos and Ibadan [Odugbemi, 1993; Odugbemi and Solanke, 1997].
People in the state also engaged in paid employ-ment of the local, state and federal governemploy-ment agen-cies, others engage in business activities which are dominated by distributive trade, personal services, transportation, inance and insurance services.To complement the socio-economic development of the state are education, health, telecommunication, postal and insurance institutions and other socio-economic services and infrastructures that exist in many towns. For instance, the state has about 1,424 public pri-mary schools, 474 public, secondary schools, 7 gov-ernment technical colleges, 1,120 registered private nursery and primary schools, 257 registered private secondary schools, 2 colleges of education, 4 polytech-nics, 3 public universities and 8 private universities. Also there are 88 hospitals/clinics (public and private) 210 maternity centers, 202 dispensaries, 16 comprehensive/primary health centers, 4 dental cen-ters and 1 university teaching hospital. Notable tour-ist attractions in the state are Olumo Rock at Abeo-kuta, BirikisuSungbo Shrine at Oke-Eri, Ebute-Oni Beach, Oronna Shrine and the Celestial city at Imeko.
2. he Methods
Both secondary and primary data were used in this study. he secondary data are the socio-onomic variable/development indicators of the urban centers. Various government publications on Ogun State such as the state’s statistical year book and ab-stract of statistics, Local Government Digests, technical reports, academic journals and other periodic publica-tions of Ogun State ministry of inance and economic planning provided the bulk of secondary informa-tion for this study. he federal oice of statistics and national population commission also provided some information on the population igures of the cities.
In the literature, little agreement exists on the range of indicators to be included in the measurement of devel-opment level of an area unit. A review of research works on regional development in the developing societies for instance relects the concatenation of socio and eco nomic variables in various forms [Onyemelukwe, 1981; Abumere, 1987; Ghafar, 1987; Ademiluyi, 1996] among others and thus, serves as antecedents to this study.
Indonesian Journal of Geography, Vol. 46 No.1, June 2014: 52 - 61
tertiary institution, (7) public health center, (8) pri-vate health centers, (9) traditional market, (10) mod-ern market, (11) industrial establishment, (12) post oices (13) postal agencies, (14) stadia/sport centers, (15) hotels, and (16) tourist/recreational facilities.
hese variables and services were chosen because they were measureable, relatively available and they have been recognized as measures of urban socio-economic growth [Oyebanji, 1981; Ademiluyi, 1996]. he primary source of data is questionnaire survey for urban residents on household basis. Following the works of Ogunjumo [1986], Oyesiku [1990], Dimitriou [1995] and Solanke [2005], household is a well-known key decision-making unit for the general movement pattern and constitutes the major point of origin of urban travel. An urban center is deined as the settle-ment with a total population of 20,000 people or more in conformity with United Nations and the deinition of urban centers in the Nigeria national population census of 1963, 1991 and 2006. On the basis of this deinition, there are 22 urban centers in the state. 14 of these in diferent categories (such as large, medium and small) in terms of population sizes were randomly selected. hey are: Abeokuta (the state capital), Ijebu-Ode, Sagamu,Ilaro, Ago-Iwoye, Ota, Ijebu-Igbo, Ayetoro, Ifo, Iperu, Ado-Odo, Idi-Iroko, Owode-yewa and Alagbado.
A household survey was conducted in each of these selected urban centers to generate data on urban travels. Each urban center was divided into residential quarters along the demarcation of the town into residential neigh-borhoods by the Town Planning Authorities (TPA). In each of the neighborhoods, random selection of streets and systematic sampling of the housing unit were made. he size of the household interviewed was based on the estimate for each urban center. here are about 425,789 households in all the selected urban centers out of which 2,385 were sampled in proportion to the number of household in each city (Table 1), 2,100 fully complet-ed copies of the questionnaire were uscomplet-ed in this study. he questionnaire dealt among others with fre-quency of trip generation in each urban centeron household basis. Frequency of trip in this study is
de-ined as the mean trip generated by individual house-holds in urban centers for a period of time (e.g. a week). his is estimated by dividing the total trips generated by households for various purposes within a designated period by the number of households sampled in the city.
he nature and degree of relationships be-tween socio-economic variables of urban centers and household frequency of trip were established through simple bivariate correlation technique.
Multiple regression analysis was used to explain the socio-economic variables that predict intra-ur-ban travels in the state. he stepwise version of the model was used to determine the most important variables explaining the observed pattern of travel.
he principal components analysis was used to resolve some of the problems met in or-der to satisfy the assumption of the multiple re-gression analysis as well as for data parsimony.
3. Result and Discussion
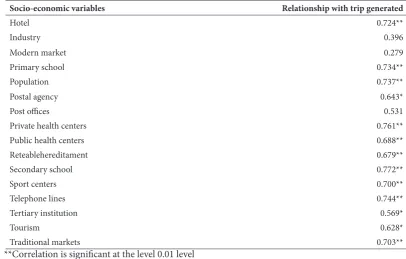
Table 2 shows that the mean trip generated by the urban centers of Ogun State, Nigeria and each of the socio-economic variables are positively corre-lated. his indicates a positive interaction pattern be-tween trip generated and socio-economic variables and thus, reinforces the assertion earlier made in this study that, socio-economic variables of urbancen-ters are potentials for spatial interaction within cities. he relationship between mea tri generated and s ome variables is very strong while with others, it is very weak. here is a strong positive correlation co-eicient of not less than 0.70 between mean trips generated and the following variables: hotels, primary schools, pop-ulation, private health centers, secondary schools, stadium/sport centers, telephone lines and tradi-tional markets. Fairly high positive correlations of between 0.5 and 0.6 exist between mean trips gener-ated and each of the following variables: postal agen-cies, public health centers, ratable hereditament, tertiary institutions, tourist centers and post oices. Furthermore, a very weak positive correlation exists between mean trips generated and industrial
lishments (0.396) as well as modern markets (0.279). he strong to fairly high positive correlations be-tween mean trip generated and all variables other than industrial establishments and modern mar-kets is noteworthy. It shows that with high concen-tration of such variables as hotel, primary schools, popula tion, postal agencies, ratable hereditament, second ary schools, stadia/sports centers, telephone facilities, tertiary institutions, tourist centers and tra-ditional markets, the urban centers tend to generate more intra-city trips. his inding agrees with ear-lier studies such as those by Filani [1972] in United States of America and Lee [1972] in Taiwan where positive relationship was established between trips generated and socio-economic variables in general.
Generally, regression model performs two basic functions namely: Predictive and explanatory func-tions [Blalock, 1963; Oyesiku, 1990; Ayeni, 1994; Bar-ber, 1995; Okoko, 2000; Solanke, 2005; Raji 2013]. Em-phasis on the predictive equations is on obtaining the co-eicient of determination (R2) with the aim of
maxi-mizing the variance in the dependent variable that are accounted for by a given set of independent variables. In other words, in this study the predictive function of the model strives to present the combine efect of the independent variables (the urban socio-economic vari-ables) on the dependent variable (the trip generated). he explanatory function of the model shows the separate inluence of the independent variables in order to establish the importance of the relationship of each of the independent variables on the dependent variable.
In formulating the explanatory model, through multiple regression, the traditional multi-collinearity problems amongst inter correlated independent vari-ables must irst be eliminated or reduced to be
bar-est minimum. here are various methods to tbar-est for multi-collinearity in a data. hese include the Ei-gen value method and that which entails examina-tion of pairwise correlaexamina-tions among independent variables. here is no general consensus as regards the level of collinearity which adversely afects the estimates of regression parameters. Hauser [1974] noted that a pairwise correlation between explana-tory variables in excess of 0.80 depicts serious collin-earity and this cut of point has been widely used in research [Oyesiku, 1990; Ojo, 1990; Solanke, 2005].
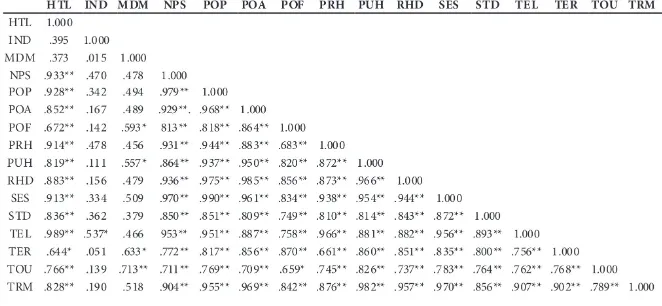
An examination of the zero-order correlation matrix of explanatory variables (socio-economic vari-ables) (Table 3) shows that a very strong positive cor-relation in excess of 0.80 exists between population and each of the following variables: hotels (0.928), pri-mary schools (0.979), postal agencies(0.968), private health facilities (0.944), public health facilities (0.937), ratable hereditaments (0.975), secondary schools (0.990), telephone facilities (0.951), traditional mar-ket (0.955), post oices (0.818), sport facilities (0.851) and tertiary institutions (0.817). Also, strong correla-tion in excess of 0.80 exists between hotel and each of the following: primary schools (0.933), private health centers (0.914), secondary schools (0.93), postal agen-cies (0.852)sport facilities (0.836), telephone facilities (0.898) and traditional markets (0.828). All these are indications of seriouscollinearrity problems among the variables. In order to overcome these problems, the principal component analysis is employed. he principal component analysis technique is also rel-evant in a situation where the number of explanatory variables that are theoretically relevant in a regres-sionmodel is very large relative to or more than the cases (observations) [Oyesiku, 1990; Okoko, 2000]. Table 1. Urban centers in Ogun State, estimated number of households and sample sizes
S/NO Urban Center Estimated number of household Household sample size
1. Abeokuta 141,455 792
2. Ijebu-ode 49,621 278
3. Sagamu 51,136 286
4. Ilaro 15,609 87
5. Ago-iwoye 11,882 67
6. Ota 41,439 232
7. Ijebu-ogbo 26,036 146
8. Ayetoro 12,095 68
9. Ifo 21,033 118
10. Iperu 9,277 52
11. Ado-odo 9,221 52
12. Idi-iroko 6,981 39
13. Owode 15,780 88
14. Alagbado 14,224 80
Total 425,789 2,385
Indonesian Journal of Geography, Vol. 46 No.1, June 2014: 52 - 61
his is the case of the data being used for the re-gression analysis in this study. here are fourteen urban centers (cases) as against sixteen explanatory variables. Principal Component Analysis structures a set of data into truly independent factors and reduces the set of interrelated variables into a smaller group of uncorre-lated orthogonal factors which together explain most variations in the original set of data. Orthogonal trans-formation of a set of variables (X1, X2, X3…Xn) into a new set of uncorrelated variables (Y1, Y2, Y3…Yn) is the main essence of principal components analysis.
A major problem in the application of this tech-nique is how to determine the number of components that the researcher needs to represent the data. he Kaiser’s [1960] eigen-value one criterion and Cattel’s [1966] scree test are recognized approaches as solu-tions to such a problem. he eigen value greater than one criterion has been given wider applications in re-search [Blalock, 1963; Lee, 1972; Oyesiku, 1990; So-lanke, 2005; Raji, 2013] and therefore is used in this study. he results of the principal component analysis on sixteen socio-economic variables of the urban cen-ters are shown in tables 4 and 5. Table 4 shows that there are two components that explain the underlying similarities of the sixteen variables. Table 5 further re-veals that these two principal components accounted for about 88% of the variation in the original data.
On the basis of the high percentage of the total vari-ance explained by these components, they can be de-scribed to have adequately represented the original data. he irst component has Eigenvalues of 12.620 and accounted for about 79% of the variance in the
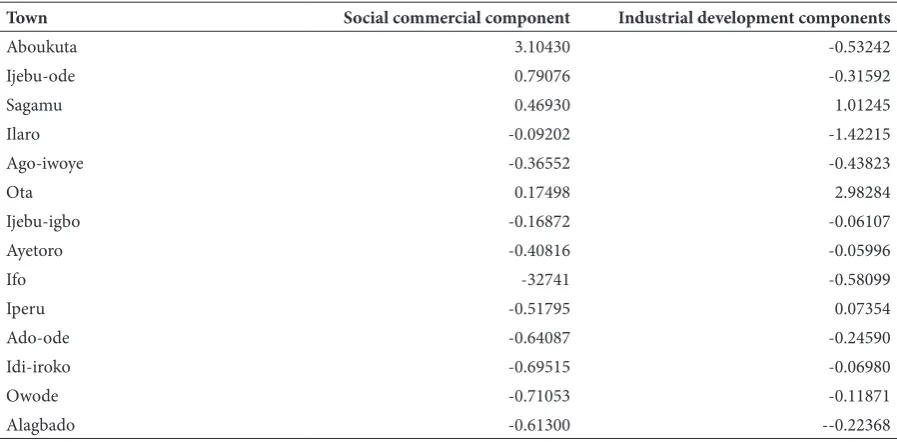
origi-nal data. All these variables, except, industrial es-tablishments loaded highly on this component. All these variables also have positive signs. Component I is named social and commercial factor. he sec-ond component has Eigen value of 1.436. Only one variable (industrial establishments) loaded high-ly on this component and accounted for about 9% of the variance in the original data. Component II is therefore named industrial development factor. Table 6 shows the pattern of the scores of the two components on the urban centers. he pattern re-veals that the three highest urban centers in term of population (Abeokuta, Ijebu-ode and Sagamu) have the highest scores on the social/commercial com-ponent. Also, Otawith the highest proportion of ur-ban industrial establishments [Solanke 2005] has the highest score on industrial development component.
he regression model is now applied to relate the two derived independent factors to the trip generated (dependent variable). he result is presented in table 7. he two components jointly explain 58.68 of the varia-tion in the average intra-city trips generated in the study area. With F ratio of 7.830, this result is signiicant at 95% conidence level. he signs of the co-eicient of the two components show that they are both positive-ly related to the mean trip generated. his shows that the higher the level of these facilities, the higher the trip generated by the urban centers in the study area.
Of the two components the social/com-mercial component alone explains 53.80% of the total variation in the mean trip generated. his is also signiicant at 95% conidence level. he in-Table 2. Relationship between mean trip generated and socio-economic variables of urban centers
Socio-economic variables Relationship with trip generated
Hotel 0.724**
Industry 0.396
Modern market 0.279
Primary school 0.734**
Population 0.737**
Postal agency 0.643*
Post oices 0.531
Private health centers 0.761**
Public health centers 0.688**
Reteablehereditament 0.679**
Secondary school 0.772**
Sport centers 0.700**
Telephone lines 0.744**
Tertiary institution 0.569*
Tourism 0.628*
Traditional markets 0.703**
AN SO
CI
O-EC
O
N
O
MI
C V
ARI
AB
LES
S
o
la
n
k
e M
u
se O
la
yi
w
o
la
58
Table 3. Inter-Relationships Between Socio-Economic Variables Of Urban Centers
HTL IND MDM NPS POP POA POF PRH PUH RHD SES STD TEL TER TOU TRM
HTL 1.000
IND .395 1.000
MDM .373 .015 1.000
NPS .933** .470 .478 1.000
POP .928** .342 .494 .979** 1.000
POA .852** .167 .489 .929**. .968** 1.000
POF .672** .142 .593* 813** .818** .864** 1.000
PRH .914** .478 .456 .931** .944** .883** .683** 1.000
PUH .819** .111 .557* .864** .937** .950** .820** .872** 1.000
RHD .883** .156 .479 .936** .975** .985** .856** .873** .966** 1.000
SES .913** .334 .509 .970** .990** .961** .834** .938** .954** .944** 1.000
STD .836** .362 .379 .850** .851** .809** .749** .810** .814** .843** .872** 1.000
TEL .989** .537* .466 953** .951** .887** .758** .966** .881** .882** .956** .893** 1.000
TER .644* .051 .633* .772** .817** .856** .870** .661** .860** .851** .835** .800** .756** 1.000
TOU .766** .139 .713** .711** .769** .709** .659* .745** .826** .737** .783** .764** .762** .768** 1.000
TRM .828** .190 .518 .904** .955** .969** .842** .876** .982** .957** .970** .856** .907** .902** .789** 1.000
**Correlation is signiicant at the level 0.01 level **Correlation is signiicant at the 0.05 level Note:
HTL - Hotel, RHD -Reteable Hereditaments, IND - Industry
MDM - Modern Market, NPS - Number of Primary School, POP - Population
POA - Postal agency POF - Post Oices PRH - private health centers
PUH - public health centers SES - Secondary Schools STD - Sport Centers
TEL - telephone lines TER - tertiary institutions TOU - Tourist Centers
Indonesian Journal of Geography, Vol. 46 No.1, June 2014: 52 - 61
Table 6. Component scores on the socio-economic development variables of the urban centers in Ogun State
Town Social commercial component Industrial development components
Aboukuta 3.10430 -0.53242
Ijebu-ode 0.79076 -0.31592
Sagamu 0.46930 1.01245
Ilaro -0.09202 -1.42215
Ago-iwoye -0.36552 -0.43823
Ota 0.17498 2.98284
Ijebu-igbo -0.16872 -0.06107
Ayetoro -0.40816 -0.05996
Ifo -32741 -0.58099
Iperu -0.51795 0.07354
Ado-ode -0.64087 -0.24590
Idi-iroko -0.69515 -0.06980
Owode -0.71053 -0.11871
Alagbado -0.61300 --0.22368
Table 7. Summary of the regressionresult between the trip generated and two socio-economic components
Socio-economic com-ponent
B coef Standard
error
Multiple R Level of
expl. %
Cumulative level of expl. %
F value T value
Social/commercial 4.755 1.272 0.734 53.80 53.80 13.982* 3.739*
Industrial development 1.439 1.255 0.766 4.88 58.68 7.830* 1.146 *Signiicant at 95% conidence level.
Table 5. Eigen-values and the total variance percentage explained by each component
Principal component Eigen value % Total Variance Cumulative variance
I 12.620 78.874 78.874
II 1.436 8.978 87.852
Table 4. Rotated Component Matrix of the Sixteen Socio-Economic Variables of the Urban Centers
No Socio-economic variable Principal Components
I II
1 Hotel 0.908* 0.230
2 Industry 0.315 0.844
3 Modern market 0.570* -0.468
4 Primary schools 0.964* 0.194
5 Population 0.986* 0.07681
6 Postal agency 0.962* -0.084
7 Post oice 0.861* -0.229
8 Primary health 0.930* 0.251
9 Public health 0.955* -0.171
10 Reteable hereditament 0.86* -0.081
11 Secondary school 0.991* 0.05325
12 Stadia 0.895* 0.114
13 Telephone 0.957* 0.249
14 Tertiary institution 0.871* -0.341
15 Tourist centers 0.831* -0.241
16 Traditional market 0.972* -0.104
dustrial development component accounts for only 5% of the variation. Although F value is signiicant at 95% level, the t value for this component is not signiicant at 95% conidence level. he implication of this is that the industrial development component does not pro-vide a signiicant explanation towards the variation in intra-city trip generated in urban centers of Ogun State.
he concentrated pattern of distribution of industrial establishment in the state (Solan-ke 2005) may be responsible for this observation. METG = mean trip generated
X = social/commercial component he equation is not due to chance as the F-value is statistically signiicant at 95% conidence level. Since the t value of industrial development component is not sig-niicant, it is not included in the equation. Intra-city trip generation in the study area is thus, a direct function of the level of social/commercial component. his inding is in agreement with earlier inding of Filani [1972] and Lee [1972] (both in industrialized society) and Oyesiku [1990] (in developing country) that population and oth-er socio-economic factors are important factors, posi-tively predicting trips generated by the urban centers at the intra city level. With the above result, it is plausible to state that just as socio-economic variable are im-portant as predictors of inter-city trip, they are equally important in the prediction of intra-city trips. In other words, the indings of scholars like Filani [1972], Lee [1972], and Oyesiku [1990] on travel behavior at inter-city level can be applied to intra-inter-city level by this study.
4.Conclusion
he inluence of socio-economic variables of ur-ban centers on intra-city travel in Ogun State, Nigeria is examined in this study. here exist a positive inter-active pattern between trips generated and
socio-eco-nomic variables of urban centers. his shows that these variables constitute potential for spatial interaction in urban centers. here is high positive correlation coei-cient [ryx>0.7 P ≤ 0.5] between trips generated and the following variables primary schools, hotels, population, private health centers, secondary schools, stadium/ sport centers, telephone lines and traditional markets. here is fairly high positive correlation (ryx between 0.5 and 0. 6), between trips generated and each of postal agencies, public health centers, rate able hereditaments, tertiary institutions, tourist centers and post oices. he strong to fairly high positive correlation between trip generated and most variables other than industrial establishment and modern market shows that these variables are strong potentials and factors of trip gen-eration. he principal component analysis on the socio-economic variables produced two components, Social/ commercialcomponent and industrial establishment component based on the loadings of variables on them.
he two components accounted for 58.68% (F = 7.830 P≤0.5) of the variation in intra-city trips generated in the state. Social and commercial component explains 58.80% (F = 13.982 P≤0.5), while industrial develop-ment component does not provide signiicant explana-tion towards the variaexplana-tion in intra-city trip generated. All socio-economic variables used in this study with the exception of industrial development have direct positive inluence on intra-urban generated. he ind-ing of this study is important to transport geographers, Hitherto, urban geographers and transport planners in particular, tend to rely heavily on socio-economic char-acteristics of residents in their explanation of urban travel behavior. However, the positive signiicant con-tribution of social and economic variables to trip gen-eration shows that researchers need to be critical in us-ing socio-economic characteristics of residents alone as factors of household travel in developing nations. Fur-thermore, development of social and economic vari-ables in cities should be regularly monitored and well planned for because of its inluence on trip generation.
References
Abumere, S.I. (1987), So the rich areas get even richer, some meditations on the duality in the space-econ-omy of Nigeria, Faculty of social scienceslecture, University of Ibadan.
Ademiluyi, I.A. (1996), An analysis of spatio-temporal pattern of inequalities in Ogun State, Nigeria, Un-published PhD hesis, university of Ibadan.
Adeniyi, S.A. (1981), Public transportation and urban Developmet strategy in Nigeria, Unpublished PhD hesis, University of Wales, Pontain.
Adeniji, K. (1985), Urban transportation system in Ni-geria, ODU: A Journal of West African studies 28 : 81-97.
Adeniji, K. (1987), Public transportation and basic
needs satisfaction in Nigeria, Research for develop-ment 4 (1&2): 292–304.
Akanni, C.O. (2000), Physical environment in Onako-maiya, S.O: Odugbemi, O.O., Oyesiku, O.O and Ademiluyi, I.A (eds) Ogun State: local and regional perspectives, center for sandwischprogrammes (CESAP) Ogun State University, Ago-Iwoye:14 – 26.
Ayeni, M.A.O. (1974), Predictive modeling of urban spatial structure: the example of Jos, Benue-Plateau state; Unpublished PhD hesis, University of Ibadan. Ayeni, B. (1979), Concepts and Techniques in urban
analysis, Croom Helm Ltd, London.
Indonesian Journal of Geography, Vol. 46 No.1, June 2014: 52 - 61
Barber, G. (1995), Aggregate characteristics in urban travel’ in Hanson, S. (ed) he geography of urban transportation 2nd edition, the Guilford Press, New York.
Blalock, H.M (1963), Correlated independent variables,
he problems of multi Collinearity Social Forces 42: 233–237.
Cattel, R.B. (1966), he scree test for number of factors,
Multivariate behavioral research 1: 245 – 276.
Dimitriou, H.T. (1995), A Developmental Approach to urban transport planning: an Indonesian illustra-tion, Avebury, Ashgate publishing limited.
Filani, M.O. (1972), Changing pattern of central places and functional regions: temporal and spatial dy-namics of air traic lows in the United States, Un-published PhD hesis, Penn State university. Ghafar, F.A. (1987), Regional inequalities and
Devel-opment in Peninsular Malaysia, Malaysian journal of tropical geography 16: 21 – 36.
Hanson, S., and Schwab, M. (1995), Describing disag-gregate lows: individual and household activity patterns’ in Hanson, S (ed) he geography of urban transportation, 2nd ed., he Guilford Press, New York.
Hauser D.P (1974), Some Problems in he Use of Step-Wise Regression Techniques in GeographicalRe-search, Canadian Geographer XVIII: 148 – 158. Kaiser, H.P. (1960), he application of electronic
com-ponents to factor analysis, Educational and psycho-logical measurement 20: 141 – 151.
Lee, D.T. (1972), Development of a mathematical mod-el and information system for forecasting intercity trip demands for the Taipei Taiwan Metropolitan area, Unpublished PhD hesis, Michigan State uni-versity.
Odugbemi, O.O. (1993), Ogun State’ in Udo, R.K. and Mamman D (eds) Nigeria: Giant in the tropics, Gabumo Press Lagos.
Odugbemi, O.O., & Solanke, M.O. (1997), he geo-graphical region, setting, structure and impact of the Ogun State University in Odugbemi, O.O., Ba-logun, K.A.; Adebanjo A, and Adedoyin, S.F. (ed)
Essential of general studies, Vol 1; center for
sand-wich programmers (CESAP) Ogun State University,
Ago-Iwoye.
Ogunjumo, A. (1986), he pattern of trip generation at Ile-Ife, Journal of Nigeria Institute of town planners VI&VII: 99 – 144.
Ogunsanya A.A. (2002), Maker and Breaker of cities’ he 59th Inaugural lecture, University of Ilorin, Ilorin. Ogunsanya, A.A., &Vandu-Chikolo I. (2004),
Con-clusion where do we go from here?In Vandu-ChikoluOgunsanya, A.A. and Sunmaila, A.G. (eds)
Perspective on urban transportation in Nigeria, NITT, Zaira.
Ojo, O.E (1990), Urban travels-activity patterns: A case study of Ibadan, Nigeria, Unpublished PhD hesis, university of Ibadan.
Okoko, E. (2000), Quantitative techniques in urban analysis, Krat Books Limited.
Onyemelukwe, J.O.C. (1981), Socio-economic indica-tors of development in Nigeria, Monograph Series, No. 1, Department of Geography, University of Ibadan.
Oyebanji, O.J. (1981), Regional inequalities in Econom-ics Growth and Developmen: A case study from Nigeria, Journal of the Nigeria institute of town planners 1(1): 71 – 85.
Oyesiku, O.O. (1990), Inter-urban travels pattern in Ni-geria: A case study of Ogun state, Unpublished PhD hesis, University of Benin.
Oyesiku, O.O. (2010), New cities in urban and regional development planning, Longman, Ikeja.
Raji, B.A (2013), Spatial analysis of pedestrian traic in Ikeja, Lagos State, Nigeria, Unpublished PhD hesis, University of Ibadan.
Solanke, M.O. (2005), Spatial analysis of intra-urban travel pattern in Ogun State, Unpublished PhD the-sis, University of Ibadan.


![[2] UND. PEMBUKTIAN KUALIFIKASI BSE SD,MI.](data:image/gif;base64,R0lGODlhAQABAIAAAP///wAAACH5BAEAAAAALAAAAAABAAEAAAICRAEAOw==)