THIS REPORT CONTAINS ASSESSMENTS OF COMMODITY AND TRADE ISSUES MADE BY USDA STAFF AND NOT NECESSARILY STATEMENTS OF OFFICIAL U.S. GOVERNMENT POLICY
Uncertain seasonal conditions for Australia are expected to slow cattle herd rebuilding. In 2018, cattle slaughter is forecast at 7.6 million head, with beef production at 2.15 million MT due to rising carcass weights. Beef exports are forecast to increase to 1.5 million MT in 2018 for this reason. Pig slaughter is forecast to increase to 5.15 million in 2018, with pig meat production to reach 400,000 MT. Exports are forecast to remain at 40,000 MT in 2018, with imports also stable at 230,000 MT. Biosecurity provisions prevent US imports of fresh, chilled and bone-in pork.
2 EXECUTIVE SUMMARY:
Uncertain seasonal conditions for Australia over 2017 and 2018 are expected to significantly affect the pace of cattle herd rebuilding and overall beef and veal production and exports. Post forecasts that the Australian beef cattle herd will reach 27 million head in 2018, up just 1.9 percent from an estimated 26.6 million in the previous year. The pace of herd re-building is expected to be slowed by less favorable seasonal conditions and poor pasture growth. However, if normal seasonal conditions occur for the next 3 months through November, average pasture growth is possible for some areas of eastern Australia.
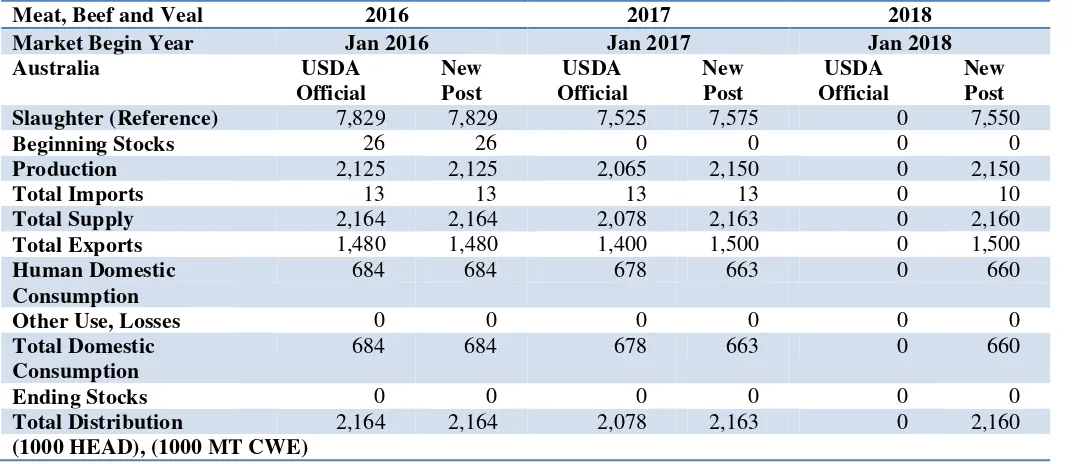
In 2017, Australian cattle slaughter is expected to decline from historic highs in previous years to 7.6 million head, just above the official forecast. Slaughter is forecast to be at the same level in 2018 due to continuing average seasonal conditions. Beef and veal production is estimated at 2.15 million MT carcass weight (cwt) in 2017, above the official estimate due to the continued increase in average carcass weights. Average carcass weights are increasing because of longer feeding times and a higher percentage of steers relative to females being processed.
Beef and veal production in 2018 is forecast to remain at this level, assuming average seasonal conditions. For 2017, beef exports will be maintained at 1.5 million MT, slightly above the current forecast due to an increase in average carcass weights. In 2018, beef exports are forecast to be maintained at 1.5 million MT for the same reason. Live cattle exports in 2017 are estimated at 0.9 million head, and are forecast to remain at that level in 2018.
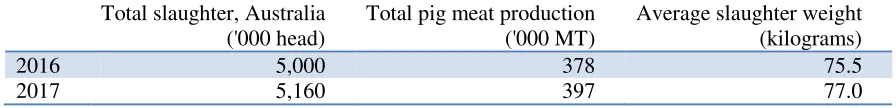
Hog numbers are expected to increase slightly from 2.3 million head in 2017 to reach 2.34 million head in 2018. The total number of breeding sows is forecast to expand from 275,000 in 2017 to 280,000 in 2018. Pig slaughter is estimated at 5.1 million head in 2017, slightly below the current estimate. Then slaughter is forecast to rebound to 5.15 million in 2018. For 2017, pig meat production is expected to increase to 395,000 MT, 2 percent above the previous year. In 2018, Post forecasts pig meat production to reach 400,000 MT.
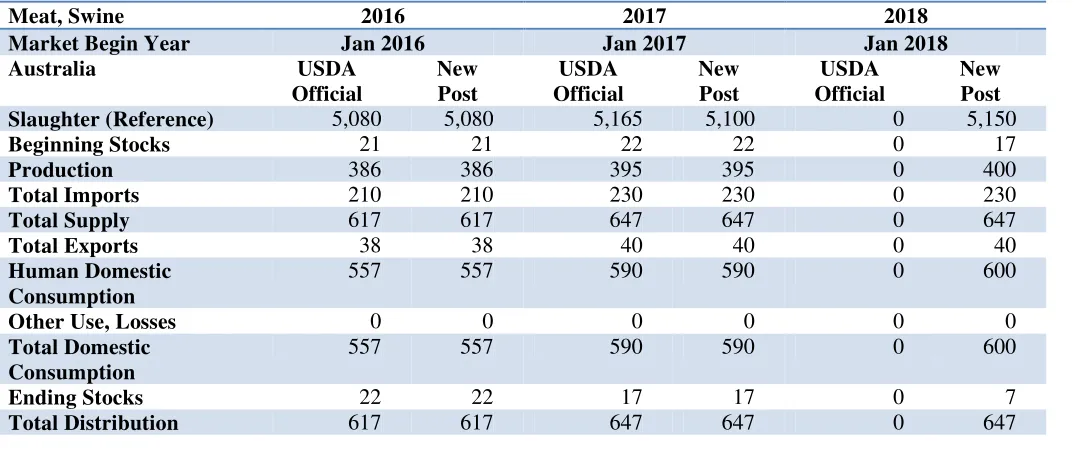
Pork exports and imports in 2017 are expected to remain stable at 40,000 and 230,000 MT, respectively. No change in these trade levels is forecast in 2018. Ostensibly due to biosecurity reasons, Australia bans imports of fresh, chilled or bone-in pork products. With the objective of obtaining approval for imports of U.S fresh, chilled and bone-in pork, Post has requested a review of these specific non-tariff import barriers. Over 70 percent of ham, bacon and other processed pork products consumed in Australia are made from imported frozen pork, which is heat-treated in government accredited facilities and used to make ham and bacon products.
3
Commodities:
SEASONAL OUTLOOK
In Australia, cattle are predominantly grass-fed and the availability of pasture is critical to carrying capacity. Over the three years to mid-2016, drought conditions affected around one third of beef cattle farms across Australia. This contributed to high cattle turn-off (slaughter and live cattle exports) as farmers faced feed shortages and export markets offered high prices. The drought abated in late 2016 with the arrival of good rainfall, but less favorable conditions returned in mid-2017.
Rainfall in June and July 2017 was well below average across most of NSW and Queensland, which are the major states for livestock production. Some areas of eastern and central NSW and western Queensland recorded the driest July for 20 years or the driest on record. The Bureau of Meteorology’s outlook for the 3 months to November (Chart 1) indicates rainfall is likely to be below average for southwest Australia, but for most of NSW and Queensland the chances are for average seasonal conditions.
The Bureau of Meteorology’s temperature outlook for the 3 months to November (Chart 2) forecasts thatdaytime temperatures are likely to be warmer than average for northern and southeastern Australia. Both of Australia's major climate drivers at this time of year, the El Niño–Southern Oscillation (ENSO) and the Indian Ocean Dipole (IOD), are forecast to remain neutral for the rest of 2017.
As a result of low rainfall and higher temperatures in eastern Australia from June 2017, topsoil moisture declined across much of NSW and Queensland. Consequently, pasture growth was limited across these states due to a lack of topsoil moisture, heavy frosts, and grazing pressure. However, if normal seasonal conditions occur for the 3 months to November, average pasture growth is possible for some areas of eastern Australia. Forecasts for pasture growth across the states of NSW and Queensland (Chart 3) and for Australia overall (Chart 4) are given below.
This emerging seasonal weather pattern in eastern Australia will be a major driver of livestock slaughter and livestock prices over the coming months. The drier conditions from mid-2017 have already seen an increase in cattle slaughter, which could continue over the year. Notably, prices for young cattle have fallen to the level of the previous year, due to dry weather and poor export market prices. The Eastern Young Cattle Index (EYCI) peaked at A$7.20/kg in September 2016 due to strong restocker demand, but fell to A$5.50 in August 2017, and is expected to continue falling over 2017.
A major factor in declining cattle prices is the poor outlook for rainfall, slow pasture growth, as well as declining demand in a number of markets. This trend suggests a pause in restocking activity and herd rebuilding until the outlook for pasture growth becomes clearer.
Meat, Swine
4
Chart 1: Chance of exceeding median rainfall for the three months to November 2017
Source: Australian Bureau of Meteorology
Chart 2: Temperature outlook for the three months to October
Source: Australian Bureau of Meteorology
5 Source: Queensland and NSW State Governments (Long Paddock website).
Chart 4: Pasture growth in NSW and Queensland, July 2017
6 expected to be slowed by less favorable seasonal conditions and poor pasture growth, especially in New South Wales (NSW) and Queensland. Over the year to mid-2017, the number of cattle on feed increased 7 percent or over 72,000 head to a record 1.1 million head. The trend towards greater numbers of cattle on feed has been supported by comparatively low grain prices and adverse seasonal conditions in eastern Australia, especially in western Queensland. High cattle prices have limited restocking and encouraged longer retention of cattle in feedlots.
Rebuilding the cattle herd occurred in early 2017 due to lower cow slaughter and the impact of better seasonal conditions on improved survival rates for calves. Notably, female cattle slaughter rates reached a 15-year low in the first 4 months of 2017. However, very poor rainfall beginning in June 2017 has reversed the outlook on cattle numbers. Slaughter rates are now expected to rise somewhat over the year due to an expected decline in pasture growth rates due to forecast low rainfall and higher average temperatures across Australia. In addition, the longer duration of cattle on feed and reduced female slaughter rates have led to increasing carcass weights.
Reflecting this outlook, cattle prices declined during 2017 from very high levels, with the EYCI down from A$6.10 per kilogram in late 2016 to around A$5.50 in August 2017. This decline also reflects lower world prices, a decline in demand for Australian beef in the United States, greater competition in Asian markets from US beef, and lower live cattle exports to Indonesia and Vietnam.
Feedlots
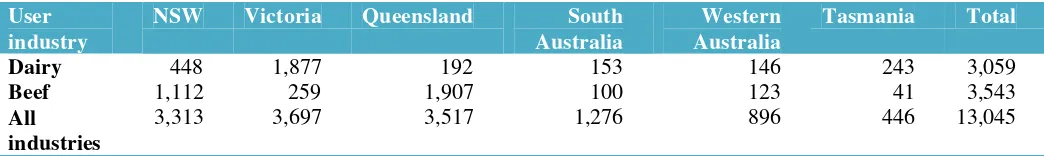
Cattle generally are on feed in feedlots 50 to 120 days, and in 2017 there were over 1 million cattle being finished at any one time. Around 10 percent of cattle slaughtered were finished in feedlots. The increasing number of cattle in feedlots has occurred because of the need to cope with insufficient pasture during dry seasons, especially in western Queensland, as well as rising export demand for grain-fed cattle. Notably, animal feeding is the largest domestic end-use for Australian grains (see Table 1 below).
Table 1: Feed use by industry sector and state, 2016, 000’ MT per year
User industry
NSW Victoria Queensland South
Australia
7 Cattle Slaughter
In 2017, Australian cattle slaughter is expected to decline from historic highs in previous years to 7.6 million head, slightly above the official forecast (Chart 5). Slaughter is forecast to be at the same level in 2018 due to continuing poor to average seasonal conditions. Cow slaughter is expected to slow in 2017 to 3.13 million head, the same as the official estimate (41.3 percent of total slaughter) as female stock is retained. For 2018, female slaughter is forecast at 3.2 million, assuming average seasonal conditions.
Chart 5: Australian cattle slaughter, January 2014 to June 2017 (‘000 head)
Source: Australian Bureau of Statistics (August, 2017).
In 2017, more adverse seasonal conditions are expected to contribute to higher than expected calf slaughter, estimated to increase to 0.6 million, up from the official estimate of 0.55 million. Post has forecast calf slaughter to be maintained at this level in 2018, assuming average seasonal conditions. Other slaughter is expected to be the major category in 2017 at 3.85 million head, matching the official estimate. Other slaughter is forecast to decline slightly to 3.8 million in 2018, assuming average seasonal conditions.
Beef and Veal Production
8
Charts 6-7: The Eastern Young Cattle Indicator (EYCI) and Live cattle exports
Note: The Eastern Young Cattle Indicator (EYCI) is the general benchmark of Australian cattle prices. The indicator is a seven-day rolling average produced daily by MLA's National Livestock Reporting Service (NLRS). The EYCI includes vealer and yearling heifers and steers, grade score C2 or C3, 200kg+ liveweight from saleyards in NSW, QLD and VIC. The results include cattle purchased for slaughter, restocking or lotfeeding and are expressed in cents per kilogram carcass (dressed) weight (c/kg cwt).
Source: Meat and Livestock Australia, August 2017.
Consumption
In 2017, beef consumption is expected to decline slightly due to supply shortages and higher retail prices. Meanwhile, domestic per capita consumption of alternative meats such as chicken and pork continues to increase. The ratio of retail beef prices to chicken in 2017 was among the highest on record and this margin is expected to be maintained in 2018.
Trade
9
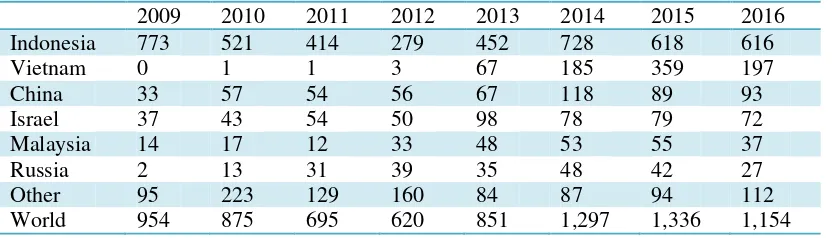
Table 2: Australian beef exports by country, 2009-2016 (‘000 MT)
2009 2010 2011 2012 2013 2014 2015 2016
Source: Global Trade Atlas (shipping weight).
Table 3: Australian live cattle exports by country, 2009-2016 (‘000)
2009 2010 2011 2012 2013 2014 2015 2016
Source: Global Trade Atlas (shipping weight).
10 Australia's beef exports to Korea are expected to decline by around 5 percent in 2017 to 180,000 MT due to strong US competition in the chilled beef market. In 2018, Australia's beef exports to Korea are forecast to be maintained at this level with strong competition from the United States. In 2017, exports to China have declined by around 20 percent as a result of increased competition from Brazil, Uruguay and Argentina. In 2018, beef exports to China are forecast to be around 105,000 MT. The strength of the Australian dollar is likely to be a key factor in constraining Australian competitiveness sin these markets.
On 24 March, 2017, Australia and China signed an agreement on Inspection and Quarantine Cooperation, which is expected to provide Australian exporters with greater market access. The agreement should increase the number of eligible establishments permitted to export chilled and frozen red meat to China. In the last 5 years, China accounted for around 10 percent of Australia's beef exports in volume terms. Most is frozen, but the share of chilled beef relative to frozen beef exported to China has been increasing.
Live Cattle Exports
Live cattle exports in 2017 are estimated at 0.9 million head. For 2018, Post forecasts that live cattle exports will be maintained at this level. During 2017, live cattle exports have been affected by a number of domestic constraints, such as high domestic cattle prices and policy changes in major export markets, including Indonesia. Overall, live cattle exports fell by almost 40 percent over the calendar year to July 2017 to 385,000 head. In addition, exports have been affected by the high Australian dollar and increased saleyard prices for cattle.
11
Table 4: Production, Supply and Distribution Data Statistics (Cattle Numbers)
Animal Numbers,
Note: Not official USDA data.
Table 5: Production, Supply and Distribution Data Statistics (Meat production)
12 SWINE AND PORK
Production
Hog numbers are forecast to increase slightly from 2.3 million head in 2017 to reach 2.34 million head in 2018. The total number of breeding sows is forecast to expand from 275,000 in 2017 to 280,000 in 2018. Numbers are increasing in NSW, but falling slightly in Queensland and South Australia. These trends are linked to less favorable seasonal conditions in Queensland, especially in its western regions, where rainfall has been below average for a number of years.
Post expects pig slaughter to be 5.1 million head, slightly below the official estimate for 2017, and to increase to 5.15 million in 2018. For 2017, pork production is expected to increase to 395,000 MT or 2 percent above the previous year. In 2018, Post forecasts pork production to reach 400,000 MT. Increasing consumption of pork in Australia has been driven by a surge in beef prices due to the lower cattle herd size, as well as an expansion in pig numbers in response to this trend. Herd expansion has also been encouraged by lower grain prices after the record winter crop in 2016/17.
Wholesale pork prices have declined since late 2016 in response to higher production. In August 2017, prices were 25 percent below August last year. Increasing grain prices has affected the industry, which is very grain-intensive, while competition from imports has reportedly increased.
Currently, the pork processing sector consists of 45 abattoirs, of which the largest seven account for over 80 percent slaughter. Larger pig farms in Australia have expanded in response to higher beef prices and the resulting consumer preference for pork. At the same time, smaller pig producers have been leaving the industry. The three major pork processing companies account for well over 50 percent of Australia's production and exports.
Production statistics for the industry are reliable because of the use of an electronic ‘Pig Pass’ for pig production and sales. The coverage rate for the pass is increasing and in mid-2017 the Australian government passed legislation to make registration under the Pig Pass mandatory for producers.
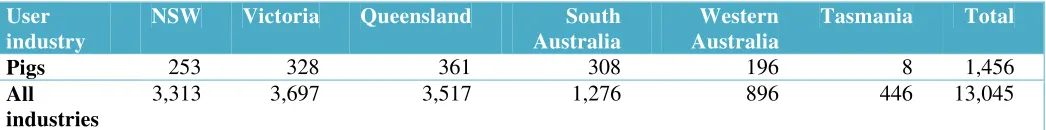
Table 6: Feed use by industry sector and state, 2016, 000’ MT per year
User industry
NSW Victoria Queensland South
Australia
Source: Lot Feeders Association (2017).
13
Table 7: Overview of the Australian pig and pigmeat industry by state, 2016 and 2017 (a)
Slaughter
(000’ head) Production Pig Meat (MT)
South Australia 1,320 101,462 76.9
Western Australia 704 52,146 74.1
Note: (a) Year to June 2017
Source: Australian Bureau of Statistics, 2017
Overall, there are around 1,500 pork farmers in Australia, who are primarily focused on the fresh pork market. This segment faces less competition from imports than frozen meat because of biosecurity barriers on the importation of fresh pork from the United States and other countries. Larger pig farms tend to be vertically integrated, also contracting out pig production in order to specialize in processing activities. The impact of this change is likely to increase the efficiency of the industry, especially as pig farms become larger in scale. In late 2014, JBS acquired the largest domestic producer of ham, bacon and other processed pork products for US$1.25 billion.
Table 8: Australian pig slaughter and pig meat production, 2016 and 2017 (a)
Total slaughter, Australia
14
Chart 8: Average Australian pig and feed grain prices, January 2005 to June 2017
Source: Australian Pork Limited.
Chart 9: Pigs slaughtered by major state, Australia, January 2014 to June 2017 (‘000 head)
15 Consumption
Pork consumption has increased in recent years, in response to falling red meat production and rising prices. Australians consume around 25 kilograms of pork per person annually, made up of ten kilograms of fresh pork and 15 kilograms of processed ham products such as bacon and small goods, which are typically frozen. Pork products account for around ten percent of total fresh meat retail consumption. Fresh pork sold in Australia is domestically produced, while around two thirds of processed pork products (ham, bacon and small goods products) are made from frozen boneless pork imported from Denmark, Canada and the United States.
Consumption of pork has benefitted from higher beef prices in recent years, while pork prices have been relatively stable. This trend has supported increased production increased as consumer preferences have moved away from more expensive beef cuts. In 2015, pork took over from beef as the second most consumed meat protein, after poultry. The domestic pork industry has heavily promoted pork consumption through marketing campaigns such as ‘bacon week’and the ‘get some pork on your fork’. Consumption of the meat generally peaks during Christmas, but is stable over the rest of the year.
Trade
Pork exports are expected to be stable in 2017 at 40,000 MT. Australia exports pork to a range of countries, including Singapore, Hong Kong and New Zealand. Around half of these exports are made on an intra-company basis; from subsidiary to parent company. The largest Australian pig farm exports around one third of its production, mainly to Singapore, Hong Kong and New Zealand. Pork imports into Australia in 2017 are forecast to be stable at 240,000 MT, the same as the official forecast. Although Australia and China have negotiated a free trade agreement (China-Australia Free Trade Agreement or ChAFTA), there is no import protocol currently in place to allow reciprocal trade.
16
Table 9: Production, Supply and Distribution Data Statistics (Swine numbers)
Animal Numbers,
Note: Not official USDA data.
Table 10: Production, Supply and Distribution Data Statistics (Pig meat production)