Full Terms & Conditions of access and use can be found at
http://www.tandfonline.com/action/journalInformation?journalCode=vjeb20
Download by: [Universitas Maritim Raja Ali Haji] Date: 13 January 2016, At: 00:27
Journal of Education for Business
ISSN: 0883-2323 (Print) 1940-3356 (Online) Journal homepage: http://www.tandfonline.com/loi/vjeb20
Factors That Affect College of Business Student
Opinion of Teaching and Learning
James E. Whitworth , Barbara A. Price & Cindy H. Randall
To cite this article: James E. Whitworth , Barbara A. Price & Cindy H. Randall (2002) Factors That Affect College of Business Student Opinion of Teaching and Learning, Journal of Education for Business, 77:5, 282-289, DOI: 10.1080/08832320209599677
To link to this article: http://dx.doi.org/10.1080/08832320209599677
Published online: 31 Mar 2010.
Submit your article to this journal
Article views: 32
View related articles
Factors That Affect College of
Business Student Opinion of
Teaching and Learning
JAMES E. WHITWORTH
BARBARA A. PRICE
CINDY H. RANDALL
zyxwvutsrqponmlkjihgfedcbaZYXWVUTSRQPONMLKJIHGFEDCBA
Georgia Southern
University Statesboro, Georgiaoncerns have often been raised in
C
academia about the practice of using student evaluations to measure the performance or quality of instructors. The use of student opinions to rate facul-ty appears to be
zyxwvutsrqponmlkjihgfedcbaZYXWVUTSRQPONMLKJIHGFEDCBA
all
but universal (South-em Regional Educational Board
zyxwvutsrqponmlkjihgfedcbaZYXWVUTSRQPONMLKJIHGFEDCBA
[SREB],1997). Research studies in general have shown that in many cases student evalu- ations can be statistically reliable and valid. In other words, the evaluation instruments accurately measure what they are designed to measure. Tang (1997) found 12 factors that were predic- tors of overall teaching effectiveness (e.g., clear presentation of material, answering of students’ questions, courte- ous and/or professional treatment of stu- dents, and adequate preparation for class). In an exhaustive review of 41 validity studies of student evaluations, Cohen (1981) concluded that the overall correlation between instructor ratings and student achievement was .43 and that
the overall correlation between course ratings and student achievement was
.47.’ Given that student evaluations have
been proved to be valid, why do faculty members continue to voice concern?
There appear to be two primary areas of concern in the evaluation process. The first focuses on what is actually being measured. Often student ratings have only a slight relationship to student learning (Marchese, 1997). After all, a
ABSTRACT. In this study, the authors analyzed 12,153 student facul- ty evaluations to investigate the effects
of (a) faculty member gender; (b) course type (required business core courses, classes within designated majors, or graduate classes); and (c) course level (graduate versus under- graduate classes) on student faculty evaluations. The authors explored the effect of these three factors on stu- dents’ perceptions of how much they learned in particular classes. They found that female instructors rated better than male ones and that ratings differed significantly by course type and by students’ perceived amount of learning. Graduate students tended to give higher scores than undergradu- ates. These findings could indicate that comparing evaluation data across different courses might not produce valid overall effectiveness rankings.
teacher can motivate students and be concerned, fair, enthusiastic, and pre- pared, yet the students nevertheless might learn very little in that class. The other faculty concern relates to adminis- trators’ use of a single measure derived from student evaluations. Although sev- eral questions may be asked on an eval- uation form, often the only measure- ment item that administrators examine is “Overall the instructor is an excellent teacher.”
Some faculty members believe that the evaluation process should include additional factors beyond this single
measure, such as the quality of syllabi and firsthand observations of class- room performance (Cone, 1996). Oth- ers suggest the use of Work Sampling Methodology, in which teachers include samples of student work over time and link them to evidence of teaching plans and activities to analyze student progress (Darling-Hammond, 1998). Yet amid much discussion, uni- versities continue to use little in the faculty evaluation process other than a group of questions to which students respond.
The chair of a management depart- ment at a regional university in the southeast has struggled for several years to find an equitable method of ranking faculty members for annual perfor- mance evaluation based on student eval- uations. During a recent evaluation peri- od, the chair sorted student evaluations not by faculty member but by course. She noted that there appeared to be a difference among evaluations by course type. If this is true-if a relationship does exist between course type and con- tent and the students’ perception of the faculty member-then faculty members should not be lumped into a single group for ranking but rather broken into smaller groups based on the course taught, and then sorted. Further analysis based on student response to the ques- tion relating to “excellent instructor”
282
zyxwvutsrqponmlkjihgfedcbaZYXWVUTSRQPONMLKJIHGFEDCBA
JournalzyxwvutsrqponmlkjihgfedcbaZYXWVUTSRQPONMLKJIHGFEDCBA
of Education forzyxwvutsrqponmlkjihgfedcbaZYXWVUTSRQPONMLKJIHGFEDCBA
Businessrevealed that instructor gender may also come into play in student opinion.
Both industry and college faculties are predominantly male. It is interesting to note that, although several industry studies have concluded that a gender bias exists favoring men, studies in academia have produced conflicting
results (Basow
zyxwvutsrqponmlkjihgfedcbaZYXWVUTSRQPONMLKJIHGFEDCBA
& Silberg, 1987).Tatro (1995), studying the evaluations of both male and female instructors, found significantly higher ratings given to the female faculty members. Using multiple regression, Tatro was able to use instructor gender and expected grade to predict evaluations. There have been attempts to explain this phenomenon. Taynor and Deaux (1973) theorized that women are viewed as being more deserving than men for the same perfor- mance because of the male-dominated environment in which they must work. Elmore and LaF’ointe (1975) postulated that women are more warm and expres- sive and that these traits-not the instructor’s gender-have a positive cor- relation with student ratings of instructor performance. Wheeless and Potorti (1989) also found evidence that other teacher qualities, excluding the gender of the instructor, produce positive stu- dent attitudes. Those faculty members who exhibited warmth and concern together with assertiveness and domi- nance were more likely to have positive student evaluations (Freeman, 1994).
Basow and Silberg (1987) believed that two important variables, professor gender and professor gender typing, affect student evaluations. This view not only supports the theory that students do evaluate male and female faculty mem- bers differently; it also lends credence to the belief that the perception of instructor qualities can bias an evalua- tion. Basow and Silberg found that the student’s gender and major and the type of question posed also influenced the evaluation. Overall, they found that male students generally evaluated female professors less favorably than they did male professors. In a follow-up study, Basow (1995) found that certain questions created greater bias than oth- ers. Whereas male faculty members were perceived to be more knowledge- able, female faculty members were viewed as being more sensitive and
respectful of student ideas. However, though overall ratings of male profes- sors appeared to be unaffected by stu- dent gender, this was not the case for female professors. Female professors tended to receive their highest ratings from female students and their lowest ratings from male students. In a study of 500 students, Bachen, McLoughlin, and Garcia (1999) found that female stu- dents gave female instructors high rat- ings relative to those they gave to male instructors, but that male students’ eval- uations did not vary according to the
instructor’s gender.
zyxwvutsrqponmlkjihgfedcbaZYXWVUTSRQPONMLKJIHGFEDCBA
Research Questions
One of our goals in this study was to c o n f m or refute that students’ evalua- tions of instructor quality are signifi- cantly related to course type, course level, or gender of the instructor. On the student evaluation form, we included questions addressing excellent teaching, ability to motivate the students to do their best work, level of concern for stu- dents, preparedness for class, level of enthusiasm for the subject matter, stu- dents’ willingness to recommend the instructor to a friend, ability to convey
material clearly, and fairness in evalua- tion (see questions 1-8 and 10, Table 1). Another goal was to c o n f m whether significant relationships exist between students’ assessment of their learning and course type, course level, or gender of the instructor. One question on the evaluation form addressed how much students felt that they had learned in that class compared with other classes (see question 13, Table 1).
We tested the following hypotheses: H,: Student evaluations of instructor quality do not differ significantly by gender of instructor evaluated.
H,: Student evaluations of instructor quality do not differ significantly across courses.
H,: Student evaluations of instructor quality do not differ significantly by course level (graduate vs. undergraduate).
H,: Students’ perceptions of “amount learned” do not differ significantly by gender of instructor evaluated.
H,: Students’ perceptions of “amount learned” do not differ significantly across courses.
H,: Students’ perceptions of “amount learned” do not differ significantly by course level (graduate vs. undergraduate).
TABLE 1. The Management Department Student Evaluation Form
zyxwvutsrqponmlkjihgfedcbaZYXWVUTSRQPONMLKJIHGFEDCBA
1 . Overall, the instructor is an excellent teacher.
zyxwvutsrqponmlkjihgfedcbaZYXWVUTSRQPONMLKJIHGFEDCBA
2. The instructor motivates me to do my best work. 3. The instructor showed genuine concern for the student.
4. The instructor seems well prepared for each class. 5. The instructor is enthusiastic about the subject matter.
6. I would recommend the instructor to a friend.
7. The instructor presented the material clearly and effectively.
8. The instructor evaluates in a fair manner.
9. I usually give lower ratings to instructors who require a lot of work. 10. The instructor is timely in providing feedback on my work.
1 1. I think that courses that require a lot of work are more valuable than courses that do not.
12. On average, the number of hours I studied per week outside of class for this
course was : 1 (1
zyxwvutsrqponmlkjihgfedcbaZYXWVUTSRQPONMLKJIHGFEDCBA
lo), 2 (7-9), 3 ( 4 4 4 (1-3), 5 (< 1)13. Compared with other courses I have taken, in this course I have learned:
1 (much less), 2 (less), 3 (no more or less), 4 (more), 5 (much more) 14. Given my efforts in this course, the grade I expect to receive may not be
the one that I think I deserve. It will be: 1 (much higher), 2 (higher), 3 (the same), 4 (lower), 5 (much lower)
15. The primary reason I signed up for this course is: 1 (I like the prof’s teaching style), 2 (required and only section available), 3 (Prof recommended by
friend), 4 (subject of interest to me),’ 5 (I thought it would be easy to make
good grade), 6 (none of the above)
zyxwvutsrqponmlkjihgfedcbaZYXWVUTSRQPONMLKJIHGFEDCBA
Nore. Questions 1-1 1 were answered on a scale ranging through 1 (strongly disagree),
2 (disagree), 3 (neither disagree nor agree), 4 (agree), and 5 (strongly agree).
May/June 2002 203
Method
zyxwvutsrqponmlkjihgfedcbaZYXWVUTSRQPONMLKJIHGFEDCBA
In fall
zyxwvutsrqponmlkjihgfedcbaZYXWVUTSRQPONMLKJIHGFEDCBA
1997, all department facultymembers were asked to participate in a study examining the current student evaluation document and incorporating workload and learning perception ques- tions for research purposes only (see Table 1). Since that time, we have col- lected data for all courses taught in the department. We used data from seven terms (winter, spring, and fall 1998;
spring and fall 1999; and spring and fall 2000) in this study. A total of 12,153
student evaluation forms were available
for our use in this study.
The survey instrument used in this study (see Table 1) contained 15 items. Questions 1 through 8 were designed to
measure the students’ perceptions of the quality of the instructor. Through factor analysis, we ascertained that the mea- sure was unidimensional; that is, a sin- gle underlying factor supported the 8
items (Whitworth, Randall,
zyxwvutsrqponmlkjihgfedcbaZYXWVUTSRQPONMLKJIHGFEDCBA
& Price,1999). The total variance explained by
the single factor was 66.4%: We used
principal component analysis for an
extraction method, and an Eigenvalue 2
zyxwvutsrqponmlkjihgfedcbaZYXWVUTSRQPONMLKJIHGFEDCBA
1 for the criterion for factor extraction. All factor loadings were greater than .74
and with large sample size were signifi- cant at the .05 level (Hair, Anderson, Tatham, & Black, 1995). Therefore, we
used the single measure “Overall, the instructor is an excellent teacher” as the measurement of students’ perception of the quality of the instructor (see ques- tion 1, Table 1).
Classes were divided into the follow- ing eight categories so that we could investigate differences in course type:
Computers and Applications and Intro- duction to Business (both introductory classes are generally taken during the freshman year); Business Statistics; Quantitative Analysis; Management and Organizational Behavior; Operations Management; Strategic Management; courses within the major; and graduate courses. We compared evaluations from these eight categories by examining the difference between (a) course type and quality of instruction and (b) course type and perceived learning. We also compared evaluations of male and female faculty members and those from graduate and undergraduate classes to investigate differences related to course type and perceived learning.
Results
H,: Student evaluations of instructor quality do not differ significantly by gender of instructor evaluated.
Evaluations for female instructors
zyxwvutsrqponmlkjihgfedcbaZYXWVUTSRQPONMLKJIHGFEDCBA
( n= 4,279) revealed a mean of 4.043,
whereas evaluations for male instructors
(n = 7,872) generated a mean of 3.809.
We found the difference between these two means to be significant at the 0.001 level through an independent samples test, equal variances not assumed. Therefore we concluded that the data in our study did not support the hypothesis stating that instructor quality ratings do not differ significantly by instructor gender.
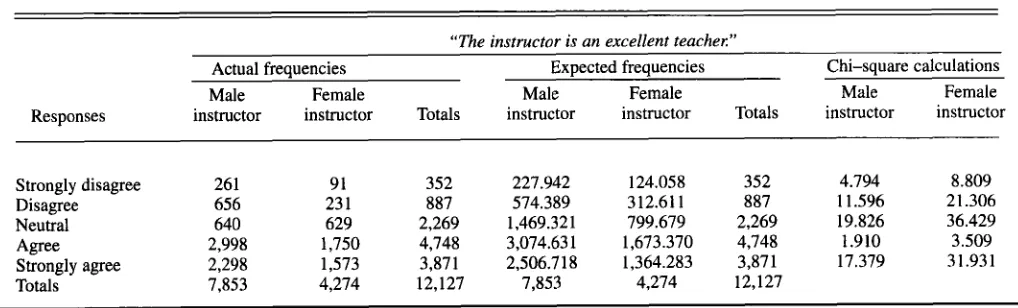
To extend this analysis, we performed a chi-square test of homogeneity of pro- portions. Our intent was to test the the- ory that the breakdown of student
responses by category (i.e., strongly dis-
zyxwvutsrqponmlkjihgfedcbaZYXWVUTSRQPONMLKJIHGFEDCBA
agree, disagree, neither agree not dis-
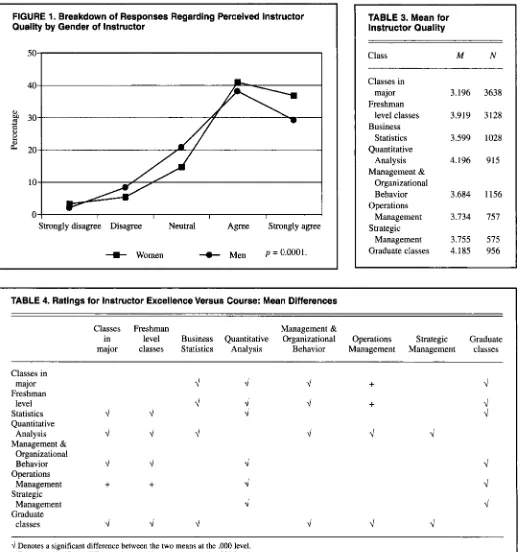
agree, agree, strongly agree) to the question of perceived teaching excel- lence for male instructors would not dif- fer significantly from the corresponding breakdown for female instructors. We found that the test disproved this theory, with a significance level of 0.001. The percentage of female instructors rated as excellent was significantly higher than that of male instructors (see Table 2). In
Figure 1, we illustrate the differences in responses by gender of instructor.
H,: Student evaluations of instructor quality do not differ significantly across courses.
We computed a one-way single-fac- tor analysis of variance so that the means (see Table 3) of instructor quali-
ty could be compared in the eight cate- gories of courses. This test revealed a significant difference at the 0.001 level
in perceived instructor quality among the course types being evaluated. To allow closer examination of the differ- ences in perceived instructor quality by course type, we used pooled t tests to compare each class against the others. The data in Table 4 show the mean sig-
nificant differences between the various courses that we investigated. Of the 56 comparisons, 36 were significantly dif-
ferent. Therefore, the hypothesis stating that student evaluations would not differ significantly across course category could not be supported.
H,: Student evaluations of instructor
quality do not differ significantly by course level (graduate vs. undergradu- ate).
TABLE 2. ChiSquare Test of Homogeneity of Proportions: Perceived Instructor Quality Versus Gender of Instructor
“The instructor is
zyxwvutsrqponmlkjihgfedcbaZYXWVUTSRQPONMLKJIHGFEDCBA
an excellent teaches”Actual frequencies Expected frequencies Chi-square calculations
Male Female Male Female Male Female
Responses instructor instructor Totals instructor instructor Totals instructor instructor
Strongly disagree 261 91 352 227.942 124.058 352 4.794 8.809
Disagree 656 23 1 887 574.389 312.61 1 887 1 1.596 2 1.306
Neutral 640 629 2,269 1,469.321 799.679 2,269 19.826 36.429
Agree 2,998 1,750 4,748 3,074.631 1,673.370 4,748 1.910 3.509
Strongly agree 2,298 1,573 3,871 2,506.718 1,364.283 3,871 17.379 31.931
Totals 7,853 4,274 12,127 7,853 4,274 12,127
[image:4.612.53.562.577.731.2]Using an independent samples test, equal variances not assumed, we found that the difference between the mean
responses of graduate students
zyxwvutsrqponmlkjihgfedcbaZYXWVUTSRQPONMLKJIHGFEDCBA
(rnzyxwvutsrqponmlkjihgfedcbaZYXWVUTSRQPONMLKJIHGFEDCBA
=4.185) and undergraduate students (rn =
zyxwvutsrqponmlkjihgfedcbaZYXWVUTSRQPONMLKJIHGFEDCBA
3.866) was significant at the .OOO level. Graduate students did evaluate faculty members more favorably than did undergraduate students. We also per- formed tests to compare graduate and
undergraduate students’ instructor rat- ings of male and female faculty. When
comparing instructor quality ratings in graduate versus undergraduate classes (means of 4.106 and 4.041 respective- ly), we found that female instructors did not receive significantly different evalu- ations but that male instructors did. In graduate classes, male faculty members earned a mean of 4.194 for instructor
quality, whereas in undergraduate class- es the mean for male faculty members was 3.762, a difference that is signifi-
cantly different at the 0.001 level. We performed further analysis to test the theory that the breakdown of student
responses by category (i.e., strongly
zyxwvutsrqponmlkjihgfedcbaZYXWVUTSRQPONMLKJIHGFEDCBA
dis-zyxwvutsrqponmlkjihgfedcbaZYXWVUTSRQPONMLKJIHGFEDCBA
agree, disagree, neither agree nor dis- agree, agree, strongly agree) to the
[image:5.612.49.571.171.723.2]question regarding perceived teaching
zyxwvutsrqponmlkjihgfedcbaZYXWVUTSRQPONMLKJIHGFEDCBA
FIGURE 1. Breakdown of Responses Regarding Perceived Instructor Quality by Gender of Instructor
I
Strongly disagree Disagree Neutral Agree Strongly agree
+
Women + Men p = 0.0001.TABLE 3. Mean for Instructor Quality
Class
zyxwvutsrqponmlkjihgfedcbaZYXWVUTSRQPONMLKJIHGFEDCBA
M NClasses in major Freshman
level classes Business
Statistics Quantitative
Analysis Management &
Organizational Behavior Operations
Management Strategic
Management Graduate classes
3.196 3.919 3.599 4.196 3.684 3.734 3.755 4.185
3638 3128 1028 915 1156
757 575 956
TABLE 4. Ratings for Instructor Excellence Versus Course: Mean Differences
Classes Freshman Management &
major classes Statistics Analysis Behavior Management Management classes in level Business Quantitative Organizational Operations Strategic Graduate Classes in
major Freshman
level Statistics Quantitative
Analysis Management &
Organizational Behavior Operations
Management Strategic
Management Graduate
classes
zyxwvutsrqponmlkjihgfedcbaZYXWVUTSRQPONMLKJIHGFEDCBA
d Denotes a significant difference between the two means at the ,000 level.
+
Denotes a significant difference between the two means at the ,001 level.May/June 2002 285
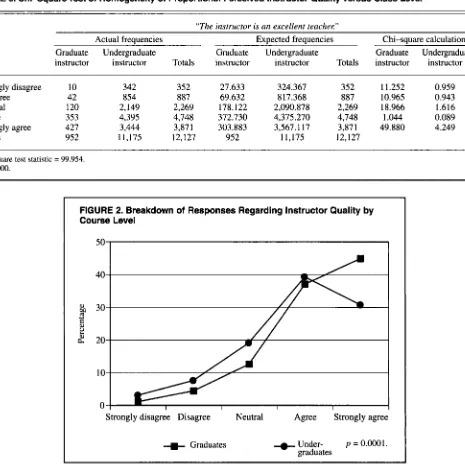
excellence would differ significantly by course level (graduate vs. undergradu- ate). Using a chi-square test of homo- geneity of proportions, we disproved this theory at the 0.001 level of signifi- cance. The percentage of students rating their instructor as excellent was signifi- cantly higher among graduate students than among undergraduates (see Table 5). In Figure 2, we illustrate the differ- ences in responses by class level.
H,: Students’ perceptions of “amount learned” do not differ significantly by
instructor gender.
zyxwvutsrqponmlkjihgfedcbaZYXWVUTSRQPONMLKJIHGFEDCBA
A comparison of mean responses did
not provide data to support this hypoth-
esis. Male instructors received a mean response of 3.154, whereas female fac- ulty members received a mean response of 3.377. Using an independent samples test, equal variances not assumed, we found that the difference between these two means was significant at the 0.001 level.
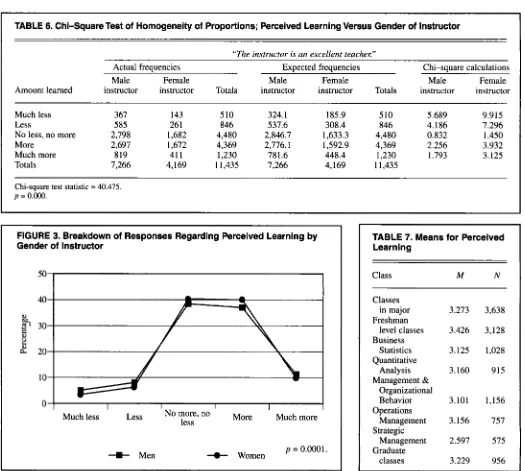
For further analysis, we performed a chi-square test of homogeneity of pro- portions. We sought to test the theory that the breakdown of student responses
by category (i-e.,
zyxwvutsrqponmlkjihgfedcbaZYXWVUTSRQPONMLKJIHGFEDCBA
much less, less,zyxwvutsrqponmlkjihgfedcbaZYXWVUTSRQPONMLKJIHGFEDCBA
nomore or less, more, much more) to the
question regarding perceived amount of learning would not differ significantly by instructor gender. With a significance
level of 0.001, the test disproved this theory. The percentage of classes per- ceived as better learning environments was significantly higher for classes taught by women than for those taught by men (see Table 6). In Figure 3, we illustrate the differences in responses by gender of instructor.
H,: Students’ perceptions of “amount learned” do not differ significantly across courses.
We computed a one-way single-factor analysis of variance so that the means (see Table 7) of amount learned could be compared in the eight categories of
[image:6.612.82.547.268.734.2]courses. This test revealed a significant
zyxwvutsrqponmlkjihgfedcbaZYXWVUTSRQPONMLKJIHGFEDCBA
TABLE 5. Chi-square Test of Homogeneity of Proportions: Percelved Instructor Quality Versus Class Level
“The instructor is an excellent teachex”
Actual frequencies Expected frequencies Chi-square calculations
Graduate Undergraduate Graduate Undergraduate Graduate Undergraduate
Item instructor instructor Totals instructor instructor Totals instructor instructor Strongly disagree 10 342 352 27.633 3 24.367 352 11.252 0.959
Disagree 42 854 887 69.632 817.368 887 10.965 0.943
Neutral 120 2,149 2,269 178.122 2,090.878 2,269 18.966 1.616
Agree 353 4,395 4,748 372.730 4,375.270 4,748 1.044 0.089
Strongly agree 427 3,444 3,871 303.883 3,567.1 17 3,871 49.880 4.249
Totals 952 11,175 12,127 952 11,175 12,127
Chi-square test statistic =
zyxwvutsrqponmlkjihgfedcbaZYXWVUTSRQPONMLKJIHGFEDCBA
99.954.zyxwvutsrqponmlkjihgfedcbaZYXWVUTSRQPONMLKJIHGFEDCBA
p = 0.000.
zyxwvutsrqponmlkjihgfedcbaZYXWVUTSRQPONMLKJIHGFEDCBA
FIGURE 2. Breakdown of Responses Regarding Instructor Quality by Course Level
Strongly disagree Disagree Neutral Agree Strongly agree
+
Graduates + Under- p = 0.0001.graduates
difference at the 0.001 level. To allow closer examination of the differences in perceived amount learned by course type,
we used pooled
zyxwvutsrqponmlkjihgfedcbaZYXWVUTSRQPONMLKJIHGFEDCBA
t tests to compare eachclass type against the others. In Table
zyxwvutsrqponmlkjihgfedcbaZYXWVUTSRQPONMLKJIHGFEDCBA
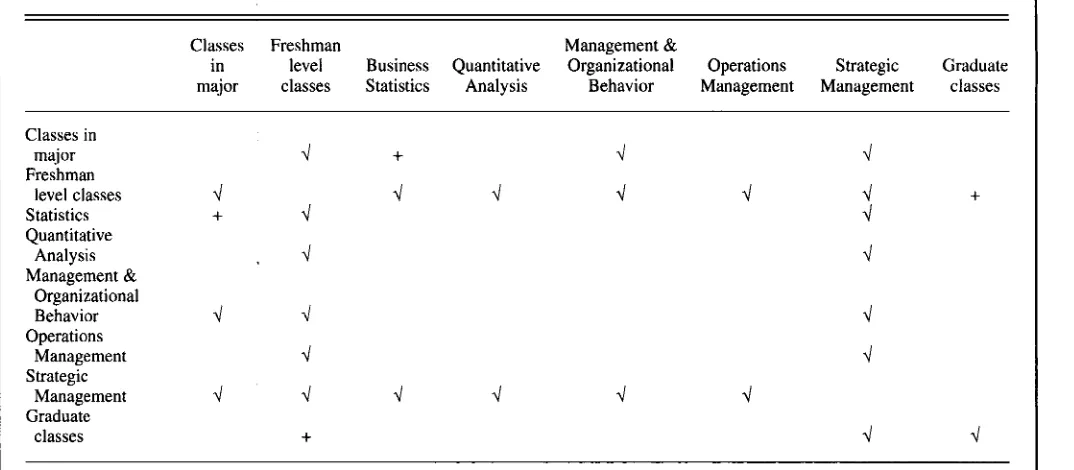
8,we illustrate the mean significant differ- ences between the various classes in our study. Of the 56 comparisons, 30 were significantly different. Therefore, our data did not support the hypothesis that there would be no significant difference between students’ perception of “amount learned” by course type.
H,: Students’ perceptions of “amount
learned” do not differ significantly by course level (graduate vs. undergradu-
ate).
zyxwvutsrqponmlkjihgfedcbaZYXWVUTSRQPONMLKJIHGFEDCBA
“The instructor is an excellent teachef’
Actual frequencies Expected frequencies Chi-square calculations Male Female Male Female Male Female Amount learned instructor instructor Totals instructor instructor Totals instructor instructor Much less 367 143 510 324.1 185.9 510 5.689 9.915
Less 585 26 1 846 537.6 308.4 846 4.186 7.296
No less, no more 2,798 1,682 4,480 2,846.7 1,633.3 4,480 0.832 I .450 More 2,697 1,672 4,369 2,776.1 1,592.9 4,369 2.256 3.932 Much more 8 19 41 1 1,230 781.6 448.4 1,230 1.793 3.125
Totals 7,266 4,169
zyxwvutsrqponmlkjihgfedcbaZYXWVUTSRQPONMLKJIHGFEDCBA
1 1,435 7,266 4,169 1 1,435zyxwvutsrqponmlkjihgfedcbaZYXWVUTSRQPONMLKJIHGFEDCBA
I
Our study results did support this hypothesis. The mean response of grad- uate students was 3.229, compared with a mean response of 3.233 for under- graduate students. Through an indepen- dent samples test, equal variances not assumed, we found no significant differ- ence between the two groups in our measurements of how much students believed that they had learned in that class compared with others.
Once again, we extended our analysis through a chi-square test of homogene- ity of proportions. We sought to test the theory that the breakdown by category of student responses (i.e., much less,
less, no more or less, more, much more)
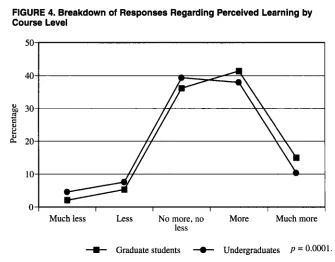
to the question regarding perceived learning would not differ significantly by course level (graduate vs. undergrad- uate). The test disproved this theory, with a significance level of 0.001. Inter- estingly, we found no significant differ- ence between the two groups through an independent samples test, equal vari- ances not assumed. This result supports the hypothesis that students’ perceptions of “amount learned” do not differ sig- nificantly by course level (graduate vs. undergraduate). There was no signifi- cant difference between the mean scores of the two groups. However, when com- paring the percentage of responses by category, we found that graduate stu-
FIGURE 3. Breakdown of Responses Regarding Perceived Learning by
zyxwvutsrqponmlkjihgfedcbaZYXWVUTSRQPONMLKJIHGFEDCBA
Gender of Instructor
50
40
d o 30
!!
zyxwvutsrqponmlkjihgfedcbaZYXWVUTSRQPONMLKJIHGFEDCBA
0
M
5
i
2010
“ I I I I I I
Much less Less No no More Much more less
+
Men Women p = 0.0001.TABLE 7. Means for Perceived Learning
Class
zyxwvutsrqponmlkjihgfedcbaZYXWVUTSRQPONMLKJIHGFEDCBA
MzyxwvutsrqponmlkjihgfedcbaZYXWVUTSRQPONMLKJIHGFEDCBA
NClasses
in major 3.273 3,638 Freshman
level classes 3.426 3,128 Business
Statistics 3.125 1,028 Quantitative
Analysis 3.160 915 Management &
Organizational
Behavior 3.101 1,156 Management 3.156 757 Management 2.597 575 classes 3.229 956 Operations
Strategic Graduate
May/June 2002 287
[image:7.612.45.570.260.731.2]dents were significantly more likely to perceive that they had learned more than
were undergraduate students (see Table
zyxwvutsrqponmlkjihgfedcbaZYXWVUTSRQPONMLKJIHGFEDCBA
9). In Figure 4, we illustrate the differ-
ences in responses by course level.
zyxwvutsrqponmlkjihgfedcbaZYXWVUTSRQPONMLKJIHGFEDCBA
Conclusions
In this study, we found that students perceived that female faculty members were better teachers than their male counterparts. Not only did female instructors rate significantly higher in a measure of instructor quality; students perceived that their class environments
promoted significantly more learning. This finding supports research by Tatro
(1995), Taynor and Deaux (1973), and
Elmore and LaF‘ointe (1975). However,
we hesitate to state that our research was conclusive in its findings regarding differences in student evaluations by instructor gender.
We gathered our data over a 3-year time period for a wide assortment of courses, which resulted in a large sam- ple of student evaluation forms. Though the students completing evaluations var- ied over these years, the faculty mem- bers did not. Therefore, though our data
included many student evaluation forms, only 66 faculty members were
evaluated. Of those 66 faculty members,
zyxwvutsrqponmlkjihgfedcbaZYXWVUTSRQPONMLKJIHGFEDCBA
46 were male and 20 female. Our results
are significant and do support existing research, which appears to lend validity to this study. However, in the future we believe that researchers should gather student evaluation forms across the col- lege or even the university and not limit them to a single department.
We also found that ratings of per- ceived instructor quality differed signif- icantly by course type as well as by stu- dent perception of the amount of
TABLE 8. Ratings for Percelved Amount Learned Versus Course: Mean Differences
Classes Freshman Management &
zyxwvutsrqponmlkjihgfedcbaZYXWVUTSRQPONMLKJIHGFEDCBA
major classes Statistics Analysis Behavior Management Management classes in level Business Quantitative Organizational Operations Strategic Graduate Classes in
major Freshman
level classes Statistics Quantitative
Analysis Management &
Organizational Behavior Operations
Management Strategic
Management Graduate
classes
.I
-+
.I
.I
.I
+
.I
.I
+
.I
.I
.I
+
.I
d Denotes a significant difference between the two means at the
zyxwvutsrqponmlkjihgfedcbaZYXWVUTSRQPONMLKJIHGFEDCBA
.OOO level.+
Denotes a significant difference between the two means at the .002 level.TABLE 9. Chiaquare Test of Homogeneity of Proportions: Perceived Amount of Learning Versus Class Level
“Comuared with other courses I have taken. in this course I have learned: ”
Actual frequencies Expected frequencies Chi-square calculations Amount
learned Graduate Undergraduate Totals Graduate Undergraduate Totals Graduate Undergraduate Much less 18 492 510 38.0 472.0 510 10.560 0.85 1
Less 45 801 846 63.1 782.9 846 5.196 0.419
No less, no more 309 4,171 4,480 334.2 4,145.8 4,480 1.898 0.153
More 353 4,016 4,369 325.9 4,043.1 4,369 2.252 0.182
Much more 128 1,102 1,230 91.8 1,138.2 1,230 14.320 1.154
Totals 853 10,582 1 1,435 853 10,582 11,435
Chi-square test statistic = 36.985.
zyxwvutsrqponmlkjihgfedcbaZYXWVUTSRQPONMLKJIHGFEDCBA
p = o.Oo0.
[image:8.612.50.562.240.711.2] [image:8.612.47.584.256.491.2]FIGURE 4. Breakdown of Responses Regarding Perceived Learning by Course Level
50
zyxwvutsrqponmlkjihgfedcbaZYXWVUTSRQPONMLKJIHGFEDCBA
I I
zyxwvutsrqponmlkjihgfedcbaZYXWVUTSRQPONMLKJIHGFEDCBA
I IMuch less Less No more, no More Much more less
+
Graduate students -t Undergraduates P = 0.0001.learning that took place in their class- room. These findings support the initial findings of our departmental chair and cast doubts on the wisdom of comparing faculty members’ evaluations across departments or colleges.
Graduate students rated the quality of their instruction significantly higher than did undergraduate students. This finding may be attributed to the average age, experience, and maturity difference between the two groups. It is interesting to note that, though the two groups did not differ in mean score regarding per- ception of the amount learned in the classroom, they did differ significantly in responses concerning perceived learning.
In conclusion, student evaluations of faculty members should not be com- pared across disciplines and levels of courses. Instead, student evaluations should be examined within only like
courses or within only one course level (graduate or undergraduate). Within these groups, the department chair should note that student evaluations of male and female faculty members may not be equivalent. Until further studies provide more conclusions, additional factors such as course syllabi, samples of student work, teaching plans, and stu- dent activities should be considered in attempts at rating faculty members.
NOTES
1. Although examining the correlation between instructor ratings and student achievement was not a target of this research study, we found an overall correlation of .41 between instructor rating and perceived learning through use of our 12,153 eval- uation forms. This finding clearly supports earlier findings and lends validity to the results of our study.
2. After adding data from academic year 2000 for this study, we calculated a factor analysis once again. Total variance explained by the single fac- tor was 69.36%. This supports earlier findings and lends validity to the results of this study.
REFERENCES
Bachen, C. M., McLoughlin, M. M., & Garcia, S.
S. (1999). Assessing the role of gender in col-
lege students’ evaluation of faculty.
zyxwvutsrqponmlkjihgfedcbaZYXWVUTSRQPONMLKJIHGFEDCBA
Communi-cation Education, 48(3), 193-2 10.
Basow, S. A. (1995). Student evaluations of col- lege professors: When gender matters. Journal of Educational Psychology, 87(4), 6 5 6 6 6 5 .
Basow, S. A., & Silberg,
zyxwvutsrqponmlkjihgfedcbaZYXWVUTSRQPONMLKJIHGFEDCBA
N. T. (1987). Studentevaluations of college professors: Are female and male professors rated differently? Journal of Educational Psychology, 79(3), 308-3 14. Cohen, P. A. (1981). Student ratings of instruction
and student achievement: A meta-analysis of multisection validity studies. Review of Educa-
tional Research, 51(3). 28 1-309.
Cone, J. D. (1996). Letters to the Editor. The Sun
Diego Tribune, Ed. B-11, p. 3.
Darling-Hammond, L. (1998). Standards for assessing teaching effectiveness are key: A response to Schalock, Schalock, and Myton.
Phi Delta Kappa, 79(6), 47 I .
Elmore, P. B., & LaPointe, K. (1975). Effect of teacher sex, student sex, and teacher warmth on the evaluation of college instructors. Journal of
Educational Psychology, 67, 368-374. Freeman, H. R. (1994). Student evaluations of col-
lege instructors: Effects of type of course taught, instructor gender and gender role, and student gender. Journal of Educational Psy-
chology, 86(4), 6 2 7 4 3 0 .
Hair, J. F., Jr., Anderson, R. E., Tatham, R. L., &
Black, W. C. (1995). Multivariate data analysis. Englewood Cliffs: Prentice-Hall.
Marchese. T. (1997). Student evaluations of teach- ing. Change, SeptembedOctober. p. 4. Southern Regional Educational Board. ( 1977).
Faculty evaluations for improved learning.
Atlanta: Author.
Tang, T. L. (1997). Teaching effectiveness at a pub- lic institution of higher education: Factors relat- ed to the overall teaching effectiveness. Public
Personnel Management, 26(3), 379-387. Tatro, C. N. (1995). Gender effects on student
evaluations of faculty. Journal of Research and
Development in Education, 28, 169-173. Taynor, J., & Deaux, K. (1973). When women are
more deserving than men: Equity, attribution, and perceived sex differences. Journal of Per-
sonality and Social Psychology, 28, 360-367. Wheeless, V. E., & Potorti, P. F. (1989). Student
assessment of teacher masculinity and feminin- ity: A test of the sex role congruency hypothe- sis on student attitudes toward learning. Journal
of Educational Psychology, 8, 259-262.
Whitworth, J. E., Randall, C. H., & Price, B. A. (1999). Assessment among faculty using stu- dent evaluations: Are we comparing apples with oranges? Proceedings, The Southeastern Chap- ter of the Institute for Operations Research and The Management Sciences (pp. 171-180). Myrtle Beach, SC, October.
May/June