Full Terms & Conditions of access and use can be found at
http://www.tandfonline.com/action/journalInformation?journalCode=vjeb20
Download by: [Universitas Maritim Raja Ali Haji] Date: 12 January 2016, At: 23:53
Journal of Education for Business
ISSN: 0883-2323 (Print) 1940-3356 (Online) Journal homepage: http://www.tandfonline.com/loi/vjeb20
Technology in the Classroom: An Assessment of
Hardware and Software Use in Finance Instruction
Mike Cudd , Thomas Lipscomb & John Tanner
To cite this article: Mike Cudd , Thomas Lipscomb & John Tanner (2003) Technology in the Classroom: An Assessment of Hardware and Software Use in Finance Instruction, Journal of Education for Business, 78:5, 244-248, DOI: 10.1080/08832320309598607
To link to this article: http://dx.doi.org/10.1080/08832320309598607
Published online: 31 Mar 2010.
Submit your article to this journal
Article views: 35
View related articles
Technology in the Classroom:
An Assessment of Hardware and
Software Use in Finance
MIKE CUDD
zyxwvutsrqponmlkjihgfedcbaZYXWVUTSRQPONMLKJIHGFEDCBA
Mississippi College
Clinton, Mississippi
THOMAS LIPSCOMB
Southeastern Louisiana University
Hammond, Louisiana
ot everyone agrees on the numer-
N
ous benefits of classroom tech- nology. Faculty costs in time may out- weigh the benefits to pedagogy of learning new technologies (Smith, 2001). In studies comparing technolo- gy-enriched teaching environments with traditional classroom methods, researchers have found no significant difference i n student performance(Agarwal
zyxwvutsrqponmlkjihgfedcbaZYXWVUTSRQPONMLKJIHGFEDCBA
& Day, 1998; Cuban, 2001;Rankin & Hoaas, 2001; Spinelli, 2001). Moreover, students and faculty members accustomed to traditional classroom environments sometimes view online learning products and ser- vices as disruptive (Leydon, 2001).
New user-friendly software permits nontechnical faculty members to make multimedia presentations (Klinger &
Siegel, 1996) by using electronic class- room innovations (Liu & Beamer, 1997). Other researchers have verified that electronic classroom innovations are preferred by students (Basile &
D’Aquila, 2002; Becker & Watts, 1998; Manning, 1996; Navarro & Shoemaker, 2000) and improve student perfor- mance (Hagen, Edwards, & Brown, 1997; Hall, 1997; Karakaya, Ainscough
& Chopoorian, 2001; Leuthold, 1998; Manning, 1996).
Some researchers examined the process of adapting to new classroom technology. In one study, Zhoa, Pugh,
244
zyxwvutsrqponmlkjihgfedcbaZYXWVUTSRQPONMLKJIHGFEDCBA
Journal of Education for BusinesszyxwvutsrqponmlkjihgfedcbaZYXWVUTSRQPONMLKJIHGFEDCBA
~~ ~
ABSTRACT. The use of technology in classrooms is expanding rapidly. Though electronic classroom innova-
tions generally are believed to be ben- eficial, the mode and frequency of use
vary considerably in the area of
finance instruction. In this study, the
authors investigated classroom tech- nology use in finance instruction by
surveying faculty members listed in
the December 2001 Financial Man-
agement Association Directory
zyxwvutsrqponmlkjihgfedcbaZYXWVUTSRQPONMLKJIHGFEDCBA
ofMembership.
Sheldon, and Byers (2002) identified 11 primary factors that influence success of classroom technology innovations. Celsi and Wolfinbarger (2002) dis- cussed three waves in the process of fac- ulty adoption of classroom technology. Hein and Stalcup (2001) focused on the effectiveness of using the Internet and new technology tools in teaching a money and banking course.
Regardless of the perceived value of electronic classroom innovations, instructors today are hitting a technolo- gy wall encountered by industry 2 decades earlier. The first step in addressing this transition problem is identifying teaching practices that employ technology (Soloway, 2000). In this study, we attempted to shed more light on this first step by assessing and profiling the use of classroom technolo- gy in finance instruction.
Instruction
JOHN TANNER
University of Louisiana at Lafayette
Lafayette, Louisiana
Method
We e-mailed all finance faculty mem-
bers associated with
zyxwvutsrqponmlkjihgfedcbaZYXWVUTSRQPONMLKJIHGFEDCBA
U.S. universitiesand colleges listed in the December 2001 Financial Management Associa-
tion Directory of Membership. We asked each faculty member to respond to a technology questionnaire provided
on
zyxwvutsrqponmlkjihgfedcbaZYXWVUTSRQPONMLKJIHGFEDCBA
an Internet homepage and accessible through a provided link. We contacted atotal of 1,468 finance faculty members and received 145 usable responses. The response rate of approximately 10% is considered to be within acceptable lim- its (Alreck & Settle, 1985). The ques- tionnaire contained four sections, which addressed respondent demographics and use of various types of classroom hardware, software, and distance educa- tion methods.
Results and Analysis
Respondent Demographics
In Table 1, we display the demo- graphic characteristics of the respon- dents. Almost 70% were teaching at public state universities. We grouped universities according to size and found that each size group was substantially represented, with the largest percentage (29.7%) of respondents teaching at institutions with enrollments exceeding
20,000 students. Three fourths of the respondents taught in colleges of busi- ness with enrollments of over 1,000 stu- dents. Approximately five out of six respondents represented AACSB- accredited schools of business. Each academic rank was substantially repre- sented, with the associate professor rank comprising 41% of the sample. More than three fourths of the respondents were male, and over 60% had over 10 years of college teaching experience. Consequently, the sample was represen- tative of a broad diversity of finance faculty members with regard to these
demographic variables.
zyxwvutsrqponmlkjihgfedcbaZYXWVUTSRQPONMLKJIHGFEDCBA
Classroom Hardware Use in Finance Instruction
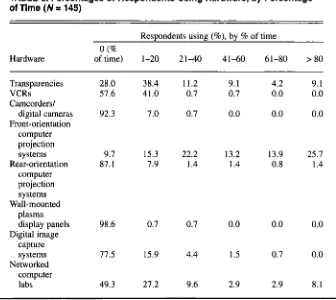
In Table 2, we show the percentage of use of the various types of classroom hardware in finance instruction. Almost 75% of the respondents used the over- head transparency projector, a common classroom hardware device, and over 20% used transparencies in more than 40% of their class meetings. Trans- parencies have long been used in many classrooms, possibly because they are inexpensive and do not require much technical skill.
We found moderate use of the video- cassette recorder (VCR). Less than half of the respondents used this tool in the classroom, and less than 2% used it in more than 20% of their classes. The low VCR use is not surprising; finance classes are highly quantitative and thus less suitable to taped video presenta- tions than more qualitative subject areas are.
We found similar results for cam- corder and digital camera use. About 7.7% of the respondents indicated any use of camcorders and digital cameras, and less than 1% indicated use of such devices in more than 20% of their classes.
Our finding that an extremely high percentage of respondents used some variation of computer image projection (e.g., front-orientation, rear-orientation, or wall-mounted projectors) demon- strates an extensive shift to the use of this tool in finance instruction. Over 90% of the respondents employed front-
orientation computer projection sys-
zyxwvutsrqponmlkjihgfedcbaZYXWVUTSRQPONMLKJIHGFEDCBA
TABLE 1. Demographic Characteristics of Respondents
zyxwvutsrqponmlkjihgfedcbaZYXWVUTSRQPONMLKJIHGFEDCBA
( N =zyxwvutsrqponmlkjihgfedcbaZYXWVUTSRQPONMLKJIHGFEDCBA
145)Category No. %
Type of university
State 99 68.3
Private 44 30.3
No response 2 1.4
Accredited 19 82.1
Not accredited 23 15.9
AACSB accreditation
No response 3 2.1
College enrollment
5 1,000 33 22.8
1,001-2,000 49 33.8
No response 1 0.7
Assistant professor 47 32.4
Associate professor 58 40.0
zyxwvutsrqponmlkjihgfedcbaZYXWVUTSRQPONMLKJIHGFEDCBA
Full professor 39 26.9
No response 1 0.7
Male 108 74.5
Female 33 22.8
No response 1 0.7
1-5 years 19 13.1
5-10 36 24.8
11-15 30 20.7
16-20 15 10.3
> 20 years 44 30.3
No response 1 0.7
> 2,000 50 34.5 Academic rank
Gender
[image:3.612.231.563.58.407.2]Years teaching
TABLE 2. Percentages of Respondents Using Hardware, by Percentage of Time ( N = 145)
Respondents using (%), by % of time
zyxwvutsrqponmlkjihgfedcbaZYXWVUTSRQPONMLKJIHGFEDCBA
0 (%
Hardware oftime) 1-20 21-40 41-60 61-80 > 8 0
Transparencies VCRs Camcorders/
digital cameras Front-orientation
computer projection systems Rear-orientation
computer projection systems Wall-mounted
plasma display panels Digital image
capture systems Networked
computer labs
28.0 38.4 11.2 9.1 4.2 9.1
57.6 41.0 0.7 0.7 0.0 0.0
92.3 7.0 0.7 0.0 0.0 0.0
9.7 15.3 22.2 13.2 13.9 25.7
87.1 7.9 1.4 1.4 0.8 1.4
98.6 0.7 0.7 0.0 0.0 0.0
77.5 15.9 4.4 1.5 0.7 0.0
49.3 27.2 9.6 2.9 2.9 8.1
May/June 2003 245
[image:3.612.229.565.442.742.2]tems, and over half used the systems in over 40% of their class meetings.
Front-orientation computer projection systems are the least expensive method of providing computer image projection, typically involving no more than a com- puter and projector mounted on a cart for a total cost of roughly $3,000 to $4,000. More expensive computer pro- jection systems include rear-orientation systems resembling free-standing, over- sized television sets and wall-mounted plasma display panels that resemble thin-line television sets. These devices often provide digital chalkboard capa- bilities that enable the instructor to write electronically directly on the image and provide slightly better imagery. Their high cost, in the $15,000-t0-$25,000 range, contributes to their scarcity and the subsequent low rates of faculty use indicated in the survey. Only slightly over 10% of the responding faculty members reported any use of rear-orien- tation computer projection systems, and less than 2% employed wall-mounted plasma display units.
Digital image capture systems (also known as “document cameras” or “Elmos”) function as closed-circuit television cameras and bear a physical resemblance to an overhead transparen- cy projector. Unlike overhead trans- parency projectors that simply project a visual image through a magnifying lens, digital image capture systems electronically scan the image, convert it to digital form, and then project it to a viewing screen. This process enables the instructor to simply place a newspa- per or book under the camera to project an enlarged image electronically. A dig- ital image document camera typically is included as an adjunct to an existing front-orientation projection cart. Its rel- atively high cost (roughly $1,000 to $2,500) contributes to the scarcity of this auxiliary device. The simplicity of use, however, makes it attractive to less technologically oriented faculty mem- bers. We found that slightly less than one fourth of the respondents used dig- ital image capture systems, and more
than
zyxwvutsrqponmlkjihgfedcbaZYXWVUTSRQPONMLKJIHGFEDCBA
6% used such systems in morethan 20% of the class meetings. Also, the greater availability of digital images that can be captured through the Inter-
net today may have decreased finance
zyxwvutsrqponmlkjihgfedcbaZYXWVUTSRQPONMLKJIHGFEDCBA
I
faculty members’ need for digital image capture systems.
Networked computer labs permit the instructor to guide students through spreadsheets designed for specific finance cases and through other coordi- nated in-class activities requiring com- puter access. Approximately half of the respondents provided some instruction in networked computer labs, but the bulk of the use involved no more than 20% of the semester class meetings. Rather than being specifically dedicated to use by finance classes, most comput- er labs are generic and have standard spreadsheet software, which enhances their availability. Consequently, the use of computer labs for finance instruction
is largely driven by faculty need.
zyxwvutsrqponmlkjihgfedcbaZYXWVUTSRQPONMLKJIHGFEDCBA
Classroom SofhYare Use in Finance Instruction
In Table 3, we provide data for the various types of software that respon- dents used in finance classes. More than
86% of the responding faculty members
employed computer presentation soft- ware (e.g., Powerpoint), which is con- sistent with the high use rate of comput- er presentation hardware noted earlier. The use rate was relatively uniform, with a fourth of the faculty members using presentation software at the mini- mum number of class meetings and roughly a fourth using it at the maxi- mum number of class meetings. The use of presentation software is especially beneficial in quantitative courses involving graphs and tables, such as finance. Students typically come to class with advance hard copies of the
presentation slides, which permits stu- dents to focus on the instructor’s lecture rather than on copying down the pro- jected images. Textbook publishers have also fueled the popularity of pre- sentation software by supplying author- written presentation software for many textbooks.
Because spreadsheet analysis is the primary tool of the financial manager, we expected to find that over 90% of responding faculty members used spreadsheet software. Publishers also commonly provide student disks with spreadsheet templates for cases and problems. Spreadsheets (e. g
.
, Excel), however, are primarily used for applica- tion purposes, rather than for the intro- duction to financial theory. Consequent- ly, the most common use rate, that of over 40%, occurred with the minimum of class meetings.Database management software (e.g., Access) is most pertinent to financial systems courses, which are relatively scarce in number. It is not surprising, therefore, that only 14.5% of the finance faculty members used database manage- ment software and that an even smaller percentage-2.9%-used it for more than 20% of their class meetings.
Distance Education Activity in Finance Instruction
Some universities are dedicated to course offerings delivered exclusively through distance education (e.g., Uni- versity of Phoenix). Virtually all univer- sities provide distance education deliv- ery for selected courses, and the trend
appears to be toward increasing the
zyxwvutsrqponmlkjihgfedcbaZYXWVUTSRQPONMLKJIHGFEDCBA
TABLE 3. Percentages of Respondents Using Software, by Percentage of
Time
zyxwvutsrqponmlkjihgfedcbaZYXWVUTSRQPONMLKJIHGFEDCBA
( N = 145)Respondents using (%), by % of time
0 (%
Software oftime) 1-20 2 1 4 0 41-60 61-80 >8 0
Computer presentation
software 13.9 25.0 13.2 13.2 11.8 22.9
software 9.1 40.5 23.1 11.9
zyxwvutsrqponmlkjihgfedcbaZYXWVUTSRQPONMLKJIHGFEDCBA
1.7 1.7management Spreadsheet Database
software 85.5 11.6 2.2 0.0 0.0 0.1
246 Journal of Education for Business
number of such courses. In addition to traditional correspondence courses and course lectures offered via the Public Broadcasting System, there are three newer technology-based methods of distance education course delivery.
First, many universities sponsor local sites for course offerings man- aged by intranet software (e.g., Black- Board or WebCT). This software pro- vides an on-line environment for each student to submit questions, obtain responses (from the instructor or other students), obtain course documents (such as course syllabi, presentation software files, spreadsheet files, data management files, special readings documents, etc.), hold chat sessions with other students, obtain course assignments, submit completed assign- ments, and check grade status. The accompanying whiteboard software also gives students and faculty mem- bers the ability to simultaneously write on the same electronic document. This type of visual aid supports virtual class meetings held on-line. Whiteboard software offers practical support of spontaneous student-written replies (i.e., a Socratic environment) only if each student is equipped with an elec- tronic writing tablet.
Second, textbook publishers provide homepages similar to specific textbook offerings. These Internet sites provide the same services and offerings as intranet pages. However, because the publisher-provided homepages are national or international in scope, stu- dents nationwide would not be covering the same chapters at the same time.
A third method of offering courses via distance education is through video conferencing (compressed video). Compressed video conferencing soft- ware (PictureTel, PolyCom, Net Meet- ing, etc.) enables students to attend a local physical classroom and interact with an instructor at a remote location through two-way video and audio hardware and software. One disadvan- tage of this mode of distance education is its relatively high cost, which includes charges for use of the commu- nications lines, remote classrooms, and compressed video equipment at all classroom sites.
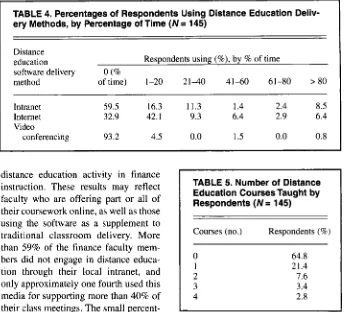
In Table 4, we present our data for
zyxwvutsrqponmlkjihgfedcbaZYXWVUTSRQPONMLKJIHGFEDCBA
TABLE 4. Percentages of Respondents Using Distance Education Deliv-
ery Methods, by Percentage of Time
zyxwvutsrqponmlkjihgfedcbaZYXWVUTSRQPONMLKJIHGFEDCBA
( N =zyxwvutsrqponmlkjihgfedcbaZYXWVUTSRQPONMLKJIHGFEDCBA
145)Distance education
method oftime) 1-20 21-40 41-60 61-80 > 8 0 Respondents using (%), by % of time
software delivery 0 (%
Intranet 59.5 16.3 11.3 1.4 2.4 8.5
Internet 32.9 42.1 9.3 6.4 2.9 6.4
Video
conferencing 93.2 4.5 0.0 1.5 0.0 0.8
distance education activity in finance instruction. These results may reflect faculty who are offering part or all of their coursework online, as well as those using the software as a supplement to traditional classroom delivery. More than 59% of the finance faculty mem- bers did not engage in distance educa- tion through their local intranet, and only approximately one fourth used this media for supporting more than 40% of their class meetings. The small percent- age (< 10%) of respondents who used distance delivery methods for almost all of their class meetings likely were instructors teaching courses that were completely online.
Approximately two thirds of the respondents used Internet-based soft- ware for course instruction, with 42.1% using the Internet for less than 20% of their class meetings. The relatively greater popularity of publisher-based textbook Internet sites may be attributed to several factors. The sites come already tailor-made for the specific text- book, which enhances their ease of use. Furthermore, such sites also may offer downloadable author-prepared comput- er presentation slides and online study quizzes, in addition to the types of materials available with more generic intranet-based homepages.
Our data show that video conferenc- ing was rarely practiced in the delivery
of finance courses, with only
zyxwvutsrqponmlkjihgfedcbaZYXWVUTSRQPONMLKJIHGFEDCBA
6.8% of thefaculty members using this mode and
only
zyxwvutsrqponmlkjihgfedcbaZYXWVUTSRQPONMLKJIHGFEDCBA
2.3% using it for more than 20% oftheir class meetings. Again, the relative- ly high cost of this method of course delivery may be inhibiting its use.
In Table 5, we present a breakdown of the number of finance courses delivered via distance education. Approximately
TABLE 5. Number of Distance Education Courses Taught by Respondents ( N = 145)
Courses (no.) Respondents (7%)
zyxwvutsrqponmlkjihgfedcbaZYXWVUTSRQPONMLKJIHGFEDCBA
64.8 21.4 7.6 3.4 2.8
one third of the respondents taught one or more courses in a distance education environment. Under 15% conducted finance instruction via distance educa- tion for more than one class. The ques- tionnaire, however, did not ask for frac- tional course information concerning distance education. For example, some
courses are offered on a
zyxwvutsrqponmlkjihgfedcbaZYXWVUTSRQPONMLKJIHGFEDCBA
“50/50” basis-that is, 50% of the material is taught online and 50% in a traditional class- room mode. Consequently, some of the above participation percentages may reflect fractional online course activity.
Conclusion
The instructional technologies used in business classrooms are changing. The results of our survey indicate how the use of such technologies is progress- ing in the area of finance instruction. Innovations are occurring at a torrid pace, and current technologies offered by software and hardware developers undoubtedly soon will be surpassed by newer ones. Our national profile and analysis of user activity provide an assessment on the current status of such classroom technology and possible future trends.
May/June 2003 247
[image:5.612.224.570.41.353.2]NOTE
zyxwvutsrqponmlkjihgfedcbaZYXWVUTSRQPONMLKJIHGFEDCBA
I . Lindstrom
zyxwvutsrqponmlkjihgfedcbaZYXWVUTSRQPONMLKJIHGFEDCBA
(1998) noted that PowerPointcontrols over 93% of the presentation software market in the world.
REFERENCES
Agarwar, R., & Day, A. E. (1998). The impact of
the Internet on economic education.
zyxwvutsrqponmlkjihgfedcbaZYXWVUTSRQPONMLKJIHGFEDCBA
JournalzyxwvutsrqponmlkjihgfedcbaZYXWVUTSRQPONMLKJIHGFEDCBA
ofEconomic Education, 29(Spring), 99-1 10.
Alreck, P., & Settle, R. B. The
zyxwvutsrqponmlkjihgfedcbaZYXWVUTSRQPONMLKJIHGFEDCBA
survey handbook.Homewood, 1L: Irwin.
Basile, A., & D’Aquila, J. M. (2002). An experi- mental analysis of computer-mediated instruc- tion and student attitudes in a principles of financial accounting course. Journal of Educa-
tion for Business, 77(3), 137-143.
Becker, W., & Watts, M. (1998). Teaching eco- nomics: What was, is and could be. In Teaching
economics to undergraduates: Alternative to
chalk and talk (pp. 1-10), Northampton, MA:
Elgar Press.
Celsi, R., & Wolfinbarger, M. (2002). Discontinu- ous classroom innovation: Waves of change for marketing education. Journal of Marketing
Education, 24, 64-72.
Cuban, L. (2001). Oversold and underused:
zyxwvutsrqponmlkjihgfedcbaZYXWVUTSRQPONMLKJIHGFEDCBA
Com-puters in the classroom. Boston: Harvard Uni-
versity Press.
Hagen, A., Edwards, K., & Brown, A. (1997). The impact of technology on classroom presenta- tions: An empirical investigation. The Journal
of Private Enterprise, 12(Spring), 54-68.
Hall, B. (1997). Web-based training. New York. Wiley.
Hein, S. E., & Stalcup, K. A. (2001). Using World Wide Web utilities to engage students in money, banking, and credit. Journal of Education for
Business, 76(3), 167-172.
Karakaya, F., Ainscough, T., & Chopoorian, J.
(2001). The effects of class size and learning style on student performance in multimedia- based marketing course. Journal of Marketing
Education, 23(August), 84-90.
Klinger, C., & Siegel, T. (1996). Computer multi- media presentations. The CPA Journal, 66(June), 4 W 9 .
Leuthold, J. (2001). Building a homepage for your economics class. Journal of Economic Educa-
tion, 60(Summer), 247-261.
Leydon, B. (2001). The e-everything revolution: What’s a university to do? Educause Review, 36(January/February), 6 2 4 3 .
Lindstrom, R. (1998). Presentation intelligence: The evolution of presentations in the New Enterprise. Presentations, 12(0ctober), 1-1 1. Liu, D., & Beamer, L. (1997). Multimedia as a
teaching tool in business communication course
delivery. Business Communication Quarterly, 60(June), 5 1 4 6 .
Manning,
zyxwvutsrqponmlkjihgfedcbaZYXWVUTSRQPONMLKJIHGFEDCBA
J. (1996). Economics on the InternetElectronic mail in the classroom. Journal of
Economic Education, 27(Summer), 20 1-204.
Navarro, P., & Shoemaker, J. (2000). Performance and perceptions of distance learners in cyber- space. The American Journal of Distance Edu-
cation, 14, 15-35.
Rankin, E., & Hoaas, D. (2001). Teaching note: Does the use of computer-generated slide pre- sentations in the classroom affect student per- formance and interest? Eastern Economic Jour-
nal, 27(Summer), 355-366.
Smith, L. (2001). Content and delivery: A com- parison and contrast of electronic and tradition- al MBA marketing planning courses. Journal of
Marketing Education, 23(April), 35-44.
Soloway, E. (2000). Teachers and technology: Easing the way. Association for Computing
Machinery. Communications of the ACM,
43(June), 23-24.
Spinelli, M. A. (2001). The use of technology in teaching business statistics. Journal of Educa-
tion for Business, 77( I), 4 1 4 4 .
Zhoa, Y., Pugh, K., Sheldon, S., & Byers, J.
(2002). Conditions for classroom technology innovations. Teachers College Record,
104(April), 482-515.
ERRATUM
In the JanuaryFebruary issue of the Journal of Education for Business, Vol. 78, No. 3, the authorship of “The Future of Accounting Education: A Regional Perspective,” pp.
129-134, incorrectly omitted the name of the second author, Karyn Bybee Friske. The authors are Sharon Burnett and Karvn Bybee Friske, both of West Texas A&M
248 Journal of Education for Business