T H E J O U R N A L O F H U M A N R E S O U R C E S • 45 • 4
Treatment on Worker Absenteeism
Implications for African Firms
James Habyarimana
Bekezela Mbakile
Cristian Pop-Eleches
A B S T R A C T
We characterize medium and long-run labor market impacts of HIV/AIDS and ARV treatment using unique panel data of worker absenteeism and information from an AIDS treatment program at a large mining firm in Botswana. We present robust evidence of an inverse-V shaped pattern in worker absenteeism around the time of ARV treatment inception. Absentee-ism one to four years after treatment start is low and similar to nonen-rolled workers at the firm. Furthermore, our analysis suggests that for the typical manufacturing firm in Africa, the benefits of treatment to the firm cover 8–22 percent of the cost of treatment.
I. Introduction
In this paper we focus on the effect of HIV/AIDS on firms in the most affected African economies and try to understand whether, in an environment where the costs of the disease are high and treatment using antiretroviral therapy (ARVs) is available and effective, it is economically beneficial for firms to provide treatment to their workers. Understanding the implications of HIV/AIDS and its treatment is an interesting case study in human resource management given the high
James Habyarimana is an assistant professor in public policy at Georgetown University. Bekezela Mbakile is HR Planning Superintendent at the Debswana Diamond Company. Cristian Pop-Eleches is an associate professor of economics and public policy at Columbia University. The authors would like to thank two referees, Janet Currie, Mark Duggan, Bill Evans, Josh Graff Zivin, Michael Hislop, Ted Joyce, Sarah Reber, Andrei Shleifer, Harsha Thirumurthy, Eric Verhoogen, and seminar participants at the BREAD, Brookings Institution, Case Western, Cuny-NBER Health Seminar, Columbia, and NBER Summer Institute for helpful comments. Since the data used in this paper are proprietary, other scholars must first ask Dr. Onalethata Johnson (ojohnson@debswana.bw) for permission to use the data. With that permission, the data used in this article can be obtained beginning June 2011 through May 2014 from James Habyarimana, Georgetown University, Public Policy Institute, 3520 Prospect Street, Suite 308A, Washington, DC 20007. E-mail: jph35@georgetown.edu
[Submitted March 2009; accepted September 2009]
prevalence of the disease in the working age population. While the positive health effects of antiretroviral treatments (ARVs) around the world are by now well estab-lished (Hammer et al. 1997; Duggan and Evans 2008; Floridia et al. 2002; Lichten-berg 2006; Koenig et al. 2004; Wools-Kaloustian et al. 2006), the existing evidence has been limited to analyzing only the short run impact of HIV/AIDS and ARV treatment on labor market outcomes (Thirumurthy et al. 2008; Fox et al. 2004; Larson et al. 2008).
We take advantage of a unique data set that permits a description of the medium-and long-termeconomic impacts of HIV/AIDS and the benefits of ARV treatment to workers and firms. More specifically we analyze the pattern of labor market absenteeism of workers with HIV/AIDS in the years prior to and following the start of ARV treatment, using detailed human resource data spanning a period of almost ten years from a large private mining firm in Botswana. Secondly, we evaluate the feasibility of workplace programs for ARV treatment in Africa using our empirical results, data from recent manufacturing surveys on compensation, and assumptions about worker productivity and wage setting behavior. We develop a framework to predict the conditions under which firms will provide ARV treatment to their work-ers. We find that although ARV treatment is extremely effective in reducing absen-teeism in the medium and long run, firms’ willingness to pay for treatment is only a small fraction of treatment costs.
In the first part of our analysis we estimate the impact of HIV/AIDS and ARV treatment on worker absenteeism using data from the Debswana Diamond Company, an enterprise that employs more than 6,500 workers, and which started one of the first free firm-based ARV treatment programs in Africa. The decision to provide treatment came as a response to an HIV prevalence rate among its work force of 28 percent in 1999 and increases in HIV/AIDS related deaths, early retirement and absenteeism (UNAIDS 2006). We carry out our analysis by linking a database of the entire universe of regular and illness related spells of absenteeism at the firm’s two main mining sites with information about the health status and timing of ARV treatment initiation for a group of almost 500 workers enrolled in the company’s treatment program. Because the absence data cover such a long time span, we are in a unique position to observe the labor market behavior of workers with HIV/ AIDS up to five years prior to and following the initiation of ARV therapy. A limitation of our data is that we are unable to measure productivity losses due to presenteeism: losses associated with lower effort while on the job or worker reas-signment in response to illness.1
Firstly, we use the staggered timing of worker treatment initiation between May 2001 and April 2006 to estimate the patterns of absenteeism around the start of ARV treatment. The four main results of our empirical analysis are the following: (1) compared to nonenrolled workers in the firm, we find no difference in the rate of absenteeism of workers enrolled in the HIV/AIDS treatment program in the period of one to five years prior to the start of treatment; (2) about 12–15 months prior to
the start of treatment we observe a sharp increase in absenteeism equivalent to about 20 days in the year prior to the start of treatment and with a peak of five days in the month of treatment initiation; (3) the recovery after the beginning of treatment happens quickly within the first year; and (4) 1–4 years after treatment starts, treated workers display very low rates of absenteeism, similar to the nonenrolled workers at the mining company.
Our main empirical strategy does not allow us to identify the causal effect of ARV treatment on absenteeism since we do not observe labor market outcomes in the absence of treatment. Therefore, we develop a strategy for identifying a coun-terfactual for enrolled workers and present the results of a simple simulation of the health dynamics of untreated late-stage AIDS patients and a productivity-health map-ping that draws from our analysis.2 The results of this strategy suggest large but
plausible long-term treatment effects.
We also provide evidence on the link between the health status of a worker (measured by his/her CD4 count) and worker absenteeism in a given month, using measurements of the CD4 count at zero, six, and 12 months after treatment start.3
Our estimate suggests that within the first year of treatment, an increase equal to 100 cells/l of the CD4 count (the average improvement in health after six months of therapy in this program) causes illness-related absence to decrease by roughly one day per month.
The second part of our analysis develops a framework to provide a rationale for when, where and how much a typical firm in Sub-Saharan Africa is willing to pay towards the cost of treatment. Building on the literature on firm-based skills devel-opment (Becker 1964; Acemoglu and Pischke 1999) and the prevailing cost and efficacy of ARV treatment, we outline the tradeoff firms face in retaining a skilled but infected worker against the cost of treatment and the opportunity cost of not replacing that worker. Our calibration shows that given the current costs of provision of ARVs and a number of plausible assumptions about the labor market, the firm’s willingness to pay for treatment covers only 8–22 percent of the cost of ARV treat-ment across a number of affected countries. Our results suggest that without the provision of public subsidies,4large increases in worker productivity or sizable
re-ductions in the costs of treatment, ARV treatment programs financed by private companies are not economically beneficial to the typical African firm.
2. The World Health Organization has defined a primary infection stage and four clinical stages associated with progression from HIV infection to AIDS. The progression of the disease follows the decline (increase) of crucial immune response CD4 cells (HIV density). Clinical Stage 1 is asymptomatic stage which can last a long time. Stage 2 of the disease is characterized by minor weight loss (⬍10 percent) and respiratory and fungal infections. Stage 3 is characterized by significant weight loss (⬎10 percent), chronic diarrhea, persistent fever, and severe infections. Stage 4 (late stage) is characterized by severe wasting and a wide range of severe bacterial, fungal and viral infections (Revised World Health Organization Clinical Staging of HIV/AIDS for Adults and Adolescents 2005).
3. The CD4 count is a measure of the density of CD4 cells—cells that are crucial in the body’s immune response mechanism. Although there is no reference normal range, CD4 counts⬎500 cells/l are consid-ered healthy (Kaufmann et al. 2002). This is a suitable measure of underlying health as it provides direct measure of the susceptibility of the body to infection.
Our analysis proceeds as follows. We describe the treatment program in Section II. In Section III, we discuss the data, empirical strategy, and regression framework. Section IV presents the results of the main analysis. Section V discusses a plausible strategy to establish a counterfactual for the absenteeism rate of enrolled workers. Section VI presents the results and limitations of a simple model to understand the impact of HIV/AIDS and ARV treatment and provides a rationale for firm-based treatment provision. Section VII concludes.
II. The ARV treatment program at the Debswana
Diamond Company
Our analysis evaluates the impact of HIV/AIDS and ARV treatment on labor market outcomes of infected workers at the Debswana Diamond Company in Botswana, a country that has been hard hit by the HIV/AIDS epidemic with an adult HIV prevalence rate of 24 percent and a life expectancy at birth of only 36 years in 2005 (UNAIDS 2006).
The country’s economic success is closely linked to the fact that Botswana is the largest producer of diamonds in the world. The company that is responsible for the diamond mining activities is the Debswana Diamond Company, a 50-50 joint venture between the Government of Botswana and the De Beers Corporation. Employing more than 6,500 workers, it provides about 60 percent of the government’s revenue, accounts for approximately 33 percent of Botswana’s GDP and over 80 percent of the country’s export earnings.5
Relative to other large firms in Africa, Debswana has been a pioneer in sustained and effective firm-based responses to the HIV/AIDS epidemic. Following the report of the first AIDS case at the Jwaneng Mine Hospital in 1987, the company started an HIV/AIDS education and awareness program in 1988. In the mid-1990s, the effect of the epidemic on the morbidity and mortality of the company’s work force became increasingly conspicuous as the percentage of retirements due to HIV/AIDS rose to 75 percent of ill-health retirements in 1999 and the share of deaths due to AIDS increased to 59 percent in the same year. In 1999, the company conducted the first of a number of voluntary, anonymous prevalence surveys that revealed an HIV prevalence rate of 28 percent. The prevalence rate in 2003 remained high (19.9 percent) and was higher among workers aged 30–39 (26 percent) and among the unskilled and semiskilled work force (23 percent).
In May 2001, Debswana Diamond Company started an ambitious treatment pro-gram that provides free antiretroviral therapy (ARVs) to the company’s work force and their spouses. Enrollment is determined as a consequence of regular health visits in which tests for HIV might be required.6The uptake of voluntary counseling and
5. Debswana is unusually large even in the broader African context. The average firm in manufacturing sectors across much of Africa is about 80 employees with a median of 20–50 employees (World Bank 2003, 2004a, 2004b, 2005).
testing has been low and enrollment is largely driven by the timing of an individual’s infection, their history of health shocks and the robustness of their immune system. The program has been extremely successful—158 patients were enrolled in the first year of operation and that number increased to 721 by April 2006. According to recent data from the company, the treatment program has contributed significantly to the productivity and health of the work force in the period 2003–2005, with reductions in death rates, ill-health retirements, and the number of sick day leaves (Mbakile 2005).7
III. Data and empirical strategy
A. Data
We use two main sources of data for this research. The first is a data set containing the complete records of all the worker absence episodes from Debswana’s two main mines. The Jwaneng data cover the period April 1998 to March 2006, while the data from the Orapa mine only start from January 1, 2001. The human resource records also provide information on gender, age, worker bands as well as the date and reason for discharge in case of job separation.8The absence data distinguish between two
different types of leaves: medical (sick) leaves and ordinary leaves. The administra-tive data used in this paper are of much higher quality than the data cited in other studies of absence in developing countries (see Chaudhry et al. 2006). Firstly, a worker must get a note from a doctor at one of the mine hospitals before he can take a paid sick leave.9 Secondly, since a large fraction of full time and contract
workers are paid on a daily basis, the human resource records are very reliable. Overall, the data set contains almost 200,000 absenteeism spells for 7,661 workers, of which 21 percent are illness-related leaves and 79 percent are ordinary leaves.
We aggregate all leave information by employee and month. On average, a worker is absent just a little over one day a month (1.12) from work and the breakdown by leave-type is 0.32 days for sick leaves and 0.8 days for ordinary leave. The level of absenteeism at Debswana is comparable to survey evidence from manufacturing firms in South Africa (World Bank 2005), where the average self-reported duration of illness-related absence is 0.3 days per month.
The second source of data is a medical database of the ARV treatment program described in the previous section.10 We have information from 721 workers and
spouses who ever enrolled in the program in the period May 2001–April 2006. This
7. These estimates are from a presentation given at the Center for Global Development, Washington, D.C. in October 2005.
8. Worker bands are analogous to occupation categories. The five worker bands are Band A through E, with A corresponding to unskilled production/nonproduction workers, and E to highly skilled managerial positions.
9. Workers can take up to a maximum of 184 sick days in a three-year cycle. Regular or nonpaid leave can then be used if a worker exceeds this limit.
data set has information on the timing of enrollment in the program and the start of ARV therapy.11In addition, we have information about the status of the patient at
the end in April 2006: 81 percent are still in the program, 11 percent are deceased, and the rest have either left the program or the company.12Finally, CD4 counts at
zero, six, and 12 months after ARV treatment initiation are collected for all patients on treatment. Appendix Table A1 provides summary statistics for the treatment pro-gram: Among the 721 patients enrolled are 538 workers and 183 spouses. We were able to match 530 of the 538 workers in the program to their human resource records. Among these 530 workers with matched records, 441 (83 percent) started ARVs at some point during the study period. Although the program has been a success in terms of enrollment levels compared to other company-based treatment programs in Africa (Rosen et al. 2006), the high proportion of workers on ARVs among those enrolled in the treatment program suggests that workers are enrolling in the treatment program and starting ARV treatment much later than is medically recommended. About 60 percent of enrolled workers are diagnosed with WHO clinical Stage 4 at the time of enrollment. Appendix Table A1 shows that the average CD4 count at ARV treatment start is only 163 cells/l and almost 70 percent of patients have a CD4 count at treatment that is lower than the WHO (and the program’s) guideline of 200 CD4 cells/l.13Moreover, about 25 percent of patients have a CD4 count of
under 50 at treatment start and are very close to death. For this group of workers, the patterns of absenteeism prior to ARV treatment start represents a close descrip-tion of absenteeism for workers until very close to death.
B. Empirical strategy
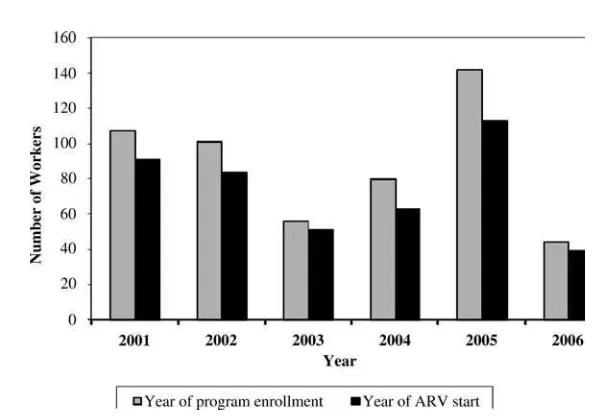
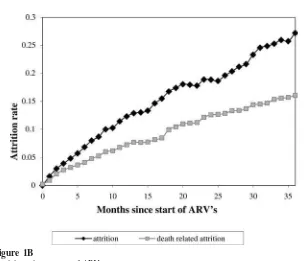
In our analysis, we use two approaches to document the relationship between HIV/ AIDS, ARV treatment, and worker absence. The first approach we employ charac-terizes monthly worker absence duration due to sickness around the time of ARV treatment onset. We use information provided by the treatment program to define the month and year of treatment initiation of each enrolled worker. Of the 441 workers with complete human resource data (see Figure 1A) who were at some point on ARVs, 91 enrolled in 2001, 84 in 2002, 51 in 2003, 63 in 2004, 113 in 2005, and 39 in 2006. Thus, there is substantial variation in the timing of the ini-tiation of ARV treatment.
Our main empirical strategy uses the variation resulting from the staggered timing of the start of treatment as a way to estimate the patterns of absenteeism of HIV-infected workers around the time of ARV therapy inception. In our main specifi-cation we control for month and person fixed effects and moreover we also include as controls the large sample of workers from the company who are not enrolled in
11. These two dates do not necessarily coincide. A worker who enrolls well before becoming symptomatic is likely to start treatment later.
Figure 1A
Timing of program enrollment and ARV treatment start
Notes: Authors’ calculations based on HR and ARV program data. This figure shows the number of people who enrolled in the program and who started on ARVs over time.
the program, which should help us better account for other unobservable factors that might be slowly changing at the firm level over time.
We estimate OLS regressions of the following form:
i
outcome ⳱Ⳮ ␣dist_from_treatment Ⳮ ␦ Ⳮ Ⳮε ,
(1) pt 0
兺
i pt 1 p 2 t pti
where outcomept is the duration of absences due to sickness and/or ordinary leaves, measured in days for each month and person cell. The variables are a set of dummy variables equal to one if a person had
i dist_from_treatment
started ARV therapyimonths ago. We restrictito beⳭ/ⳮ12 months in the main specification but we also show graphical results that extend the time interval to
Ⳮ/ⳮ36 months. In our preferred specifications, we control for person effects ( )␦ p
and month effects ( ). Note that for workers who are not enrolled in the treatmentt
programdist_from_treatmentiis undefined and observations corresponding to these nonenrolled workers are not used to identify␣i. Rather, enrolled workersimonths from treatment onset identify␣i.
The second approach uses a direct measure of health (a person’s CD4 count) to better understand the effect of health on labor market outcomes in the first year of treatment. We estimate a regression of the form:
outcome ⳱Ⳮhealth Ⳮ ␦ Ⳮ Ⳮε ,
(2) pt 0 1 pt 2 p 3 t pt
wherehealthptis measured by the CD4 count of personpat time , and our outcomet
taken. This regression is restricted to those individuals who have started treatment. For the 441 workers on ARVs with matched human resource records we have up to three CD4 counts per worker (at zero, six, and 12 months after treatment start), resulting in 845 observations.14 While this sample contains a limited number of
observations, it has the advantage of offering a direct measure of the health status of the workers enrolled in the ARV treatment program. All specifications include month fixed effects (t)and in some of the specifications we also include person fixed effects (␦p)since we observe up to three observations per patient in the data. In the specifications without person fixed effects we control for age, gender, occu-pational categories, and mining site. One important concern is that mean reversion could explain improved health outcomes after the onset of ARV therapy. This worry is diminished because the natural progression of the disease in the absence of treat-ment is one of continuous decrease of the CD4 count. Nevertheless, it is possible that the timing of ARV treatment start is influenced by an interaction of the condition of a person’s immune system and a random shock to health.
The two empirical strategies are similar given that in both cases the source of variation used comes from the timing of when workers enroll in the ARV program. The fixed effects model in the first strategy estimates the reduced form patterns of absenteeism over a long time window, but also includes healthy/never treated work-ers to identify time effects. The fixed effects model in the second strategy, which uses only workers on ARV treatment, measures the rate of absenteeism and the CD4 count of the same person at up to three points in time (zero, six, and 12 months).
There are two main reasons these strategies do not identify the impact of ARV treatment on absenteeism. Firstly we do not have a reliable control group. In our model, the “no treatment” comparison group is composed of other HIV workers infected at a different time and workers who were never enrolled in the program. As a result, our estimated effects are almost certainly smaller than the “average treatment effect of receiving ARV therapy,” given that in the absence of treatment, many of the workers would have died. Morgan et al. (2002) estimate a median duration of 9.2 months between the development of AIDS and death. We explore an alternative strategy to establish a counterfactual in section five below.
Secondly, the decision to start treatment is certainly affected by health (and po-tentially absenteeism) trends in the period immediately prior to treatment start. In the program-evaluation literature, this source of bias is usually addressed by mod-elling the selection process (for example, Ashenfelter and Card 1985). We have decided against this approach since the estimation of the selection process generally requires an exclusion restriction and in our particular case there are no plausible exclusion restrictions across the selection into treatment and labor market outcome equations.
As discussed above, we expect that estimates around treatment initiation are biased because workers who start treatment are likely to have an unusually low error term associated with treatment start. The importance of these biases for the estimates further away from the treatment start date depends critically on the time series
properties of the error term; biases will be larger if the correlation of the error terms over time is significant. Heckman and Robb (1985) in a context similar to ours have shown that as long as the error process is stationary,15the spurious effect is
sym-metric around the date of treatment. Thus the comparison of the absenteeism rate of a person three years before and after treatment start will not be biased by the possibly endogenous treatment start date. Moreover, because we know from the medical literature that an HIV-infected individual is generally asymptomatic three years prior to treatment start, the difference in absences three years before and after treatment will identify the extent to which ARV drugs restore a person’s ability to supply labor (on the extensive margin) compared to a healthy person.
We have performed a number of alternative specifications in order to test the validity of our results. We present figures based on nonparametric Fan locally weighted regressions to show the pattern of absences before and after the introduc-tion of ARV treatment. Since some of our workers exit the sample due to death or separation from the company, in our main unbalanced sample not all persons have data available for each month relative to the starting date of treatment. Thus, the number of persons identifying a particulardist_from_treatmenti coefficient is not constant and these compositional changes could give rise to possible trends in the data around the starting date. Therefore, we also include results using a “balanced” panel of workers that have at least 12 (36) months of post treatment data. Since the data from one of the mines (Jwaneng) extend over a much longer time period, we can also use intervals that are five years before and four years after the onset of ARV treatment. We also performed a number of additional robustness checks: we reran our specification to compare outcomes by early vs. late enrollment, gender, worker band, and mine. Except in the specifications that include person fixed effects (where we use Huber-White standard errors), we cluster our standard errors at the person level (Bertrand, Duflo, and Mullainathan 2004).
C. Accounting for Attrition
In this section we discuss the patterns of attrition in our data and describe the approach that we take to correct for the potentially selective attrition of participants in the ARV program. While selective attrition is a concern in all longitudinal data sets, it is particularly important in the context of a terminal disease in which attrition as a result of death is likely considerable. In Figure 1B we plot monthly attrition rates for the first three years after the start of ARV therapy. The increase in overall attrition is relatively linear over time and averages below 10 percent per year. The same graph also breaks down the distribution of attrition due to death at the time of exit or regular separation from the company. Roughly 60 percent of separations are due to death while working at the company, although we cannot accurately measure mortality since the company does not track former workers after they sepa-rate from the company.16
15. In the absence of treatment, the stationarity assumption will not hold. However, given that treatment is effective in restoring a patient’s ability to fight health shocks, we are comfortable assuming stationarity of error terms.
Figure 1B
Attrition since start of ARVs
Notes: Authors’ calculations based on HR and ARV program data. This figure shows monthly attrition rates for the first three years after the start of ARV therapy for people enrolled in the program.
We present results that use three different samples to address a number of esti-mation concerns. The balancedsample includes only those individuals for whom we have labor supply information for all the months in the sample window. The sample windows are 12 or 36 months for the regressions that measure the pattern of absenteeism around ARV treatment start and we use a one year interval for the health/CD4 sample.17The second is the unrestrictedunbalancedsample and includes
all available monthly absenteeism observations for as long as the individual is ob-served in the HR database. If selective attrition is severe, we expect the results from the balanced and unbalanced samples to be different. The third sample uses the inverse probability weights (IPW) (Fitzgerald, Gottschalk and Moffitt 1998; Woold-ridge 2002) to adjust for attrition bias due to observable characteristics. We use background as well as absence duration information at the time of ARV treatment start to predict the probability(pi)that an individualiwill still be observed at the end of the sample period. This individual receives a weight equal to 1/pi in the regression analysis, therefore giving more weight in the regression to those individ-uals whose observable characteristics predict higher attrition rates. The observable
characteristics used for this exercise are gender, age, worker band, date of treatment start, and absenteeism in the month prior to treatment start. While the background characteristics have little explanatory power, higher absenteeism in the month prior to treatment start has a positive impact on attrition. This method, while useful, cannot account for possible differential attrition due to unobserved characteristics. In the absence of an exclusion restriction that would predict attrition due to health without a direct impact on worker absenteeism, we will assume that attrition does not depend on unobservables.18
IV. Results
A. Pattern of Absenteeism around ARV Treatment Start
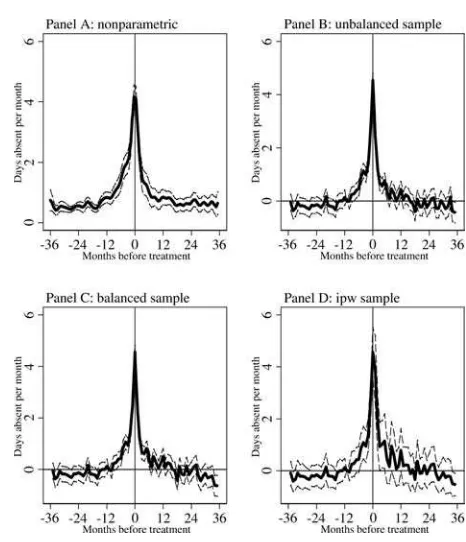
A simple way to depict the main results of the paper is by graphical illustration. Figure 2 plots the relationship between the average number of sick days taken per month and the distance from treatment start measured in months for a three-year window. Panel A uses a nonparametric Fan local regression model while the next three panels come from regressions that contain worker and month fixed effects for the three sampling strategies outlined above. In all panels, one can observe a gradual increase in absenteeism in the 12 months before treatment initiation. The increase in absenteeism is particularly steep in the six months prior to therapy onset and peaks in the final month at roughly five days, which is equivalent to an absence rate of roughly 22 percent. The positive effect of treatment on labor market outcomes is equally stark: Absenteeism falls sharply in the first six months following ARV ther-apy initiation, so that the shape of absences around treatment implementation is almost symmetric.
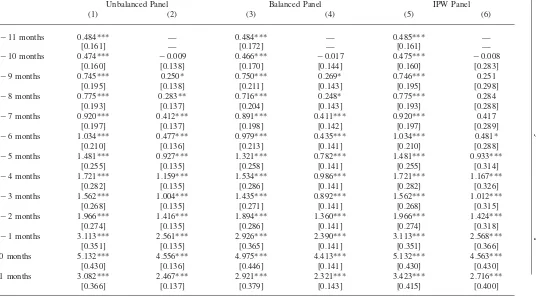
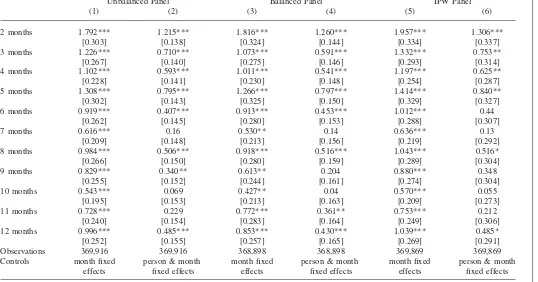
We present regression results of the basic Equation 1 in Table 1. Column 1, which uses an unbalanced sample and includes only month fixed effects, presents estimates of␣i, the coefficients for the treatment dummies corresponding to a 12-month win-dow around the onset of treatment. Compared to workers who are not enrolled in the treatment program, workers enrolled in the treatment program have a higher duration of illness-related absenteeism (0.484 days per month) even a year prior to the start of treatment. The coefficients from this regression display the familiar in-verse-V patterns seen in the nonparametric graphs, peaking at 5.13 days and then declining to less than a day 12 months afterwards.19Column 2 in the same table
shows similar patterns from a regression that also includes person fixed effects. Introducing personal fixed effects requires that we drop one more parameter (ⳮ11
months) since knowing the month and patient perfectly predicts the time to/since treatment. The remaining columns show the same regressions using the balanced
18. The concept of selection on observables in the context of attrition is due to Fitzgerald, Gottschalk and Moffitt (1998) and is similar to the “ignorability condition” (Wooldridge 2002) or the concept of “missing at random” (Little and Rubin 1987).
Figure 2
Effect of ARV treatment: Three-year window
Notes: Panels A is from a Nonparametric Fan locally weighted regression with bootstrapped standard errors clustered by worker. Panels B, C, and D are from a fixed effect regression that includes worker and month fixed effects. Sickness-related absence duration data come from the company’s HR database. The interval used is three years before and after the onset of ARV treatment. Panels A and B use an unbalanced sample, Panel C a balanced sample, and Panel D a sample with weights based on inverse probability weights (IPW)
and the inverse probability weight samples.20The size and significance of the results
is very similar across specifications allaying concerns of attrition bias. The same patterns emerge when we use the sum of regular and illness-related absences and they suggest that enrolled workers do not use additional regular leave days during episodes of poor health.21
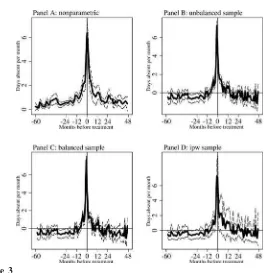
Next, we present the results of the analysis for the widest interval possible. Figure 3 plots illness-related absences using the longer data series from the Jwaneng mine; five years prior to and four years after ARV treatment start. As in Figure 2, most of the changes in absenteeism occur within a one year window. Workers who are on treatment recover remarkably quickly and display very low rates of absenteeism
20. The small reduction in the inverse probability weight sample is due to the fact that some of the observations have missing observable characteristics.
Habyarimana,
Mbakile,
and
Pop-Eleches
821
Dependent variable: Number of days absent from work due to sickness in a month
Unbalanced Panel Balanced Panel IPW Panel
(1) (2) (3) (4) (5) (6)
ⳮ11 months 0.484*** — 0.484*** — 0.485*** —
[0.161] — [0.172] — [0.161] —
ⳮ10 months 0.474*** ⳮ0.009 0.466*** ⳮ0.017 0.475*** ⳮ0.008 [0.160] [0.138] [0.170] [0.144] [0.160] [0.283] ⳮ9 months 0.745*** 0.250* 0.750*** 0.269* 0.746*** 0.251
[0.195] [0.138] [0.211] [0.143] [0.195] [0.298] ⳮ8 months 0.775*** 0.283** 0.716*** 0.248* 0.775*** 0.284
[0.193] [0.137] [0.204] [0.143] [0.193] [0.288] ⳮ7 months 0.920*** 0.412*** 0.891*** 0.411*** 0.920*** 0.417
[0.197] [0.137] [0.198] [0.142] [0.197] [0.289] ⳮ6 months 1.034*** 0.477*** 0.979*** 0.435*** 1.034*** 0.481* [0.210] [0.136] [0.213] [0.141] [0.210] [0.288] ⳮ5 months 1.481*** 0.927*** 1.321*** 0.782*** 1.481*** 0.933***
[0.255] [0.135] [0.258] [0.141] [0.255] [0.314] ⳮ4 months 1.721*** 1.159*** 1.534*** 0.986*** 1.721*** 1.167***
[0.282] [0.135] [0.286] [0.141] [0.282] [0.326] ⳮ3 months 1.562*** 1.004*** 1.435*** 0.892*** 1.562*** 1.012***
[0.268] [0.135] [0.271] [0.141] [0.268] [0.315] ⳮ2 months 1.966*** 1.416*** 1.894*** 1.360*** 1.966*** 1.424***
[0.274] [0.135] [0.286] [0.141] [0.274] [0.318] ⳮ1 months 3.113*** 2.561*** 2.926*** 2.390*** 3.113*** 2.568***
[0.351] [0.135] [0.365] [0.141] [0.351] [0.366] 0 months 5.132*** 4.556*** 4.975*** 4.413*** 5.132*** 4.563***
[0.430] [0.136] [0.446] [0.141] [0.430] [0.430] 1 months 3.082*** 2.467*** 2.921*** 2.321*** 3.423*** 2.716***
[0.366] [0.137] [0.379] [0.143] [0.415] [0.400]
The
Journal
of
Human
Resources
Dependent variable: Number of days absent from work due to sickness in a month
Unbalanced Panel Balanced Panel IPW Panel
(1) (2) (3) (4) (5) (6)
2 months 1.792*** 1.215*** 1.816*** 1.260*** 1.957*** 1.306*** [0.303] [0.138] [0.324] [0.144] [0.334] [0.337] 3 months 1.226*** 0.710*** 1.073*** 0.591*** 1.332*** 0.753** [0.267] [0.140] [0.275] [0.146] [0.293] [0.314] 4 months 1.102*** 0.593*** 1.011*** 0.541*** 1.197*** 0.625** [0.228] [0.141] [0.230] [0.148] [0.254] [0.287] 5 months 1.308*** 0.795*** 1.266*** 0.797*** 1.414*** 0.840** [0.302] [0.143] [0.325] [0.150] [0.329] [0.327] 6 months 0.919*** 0.407*** 0.913*** 0.453*** 1.012*** 0.44
[0.262] [0.145] [0.280] [0.153] [0.288] [0.307] 7 months 0.616*** 0.16 0.530** 0.14 0.636*** 0.13
[0.209] [0.148] [0.213] [0.156] [0.219] [0.292] 8 months 0.984*** 0.506*** 0.918*** 0.516*** 1.043*** 0.516* [0.266] [0.150] [0.280] [0.159] [0.289] [0.304] 9 months 0.829*** 0.340** 0.613** 0.204 0.880*** 0.348
[0.255] [0.152] [0.244] [0.161] [0.274] [0.304] 10 months 0.543*** 0.069 0.427** 0.04 0.570*** 0.055
[0.195] [0.153] [0.213] [0.163] [0.209] [0.273] 11 months 0.728*** 0.229 0.772*** 0.361** 0.753*** 0.212
[0.240] [0.154] [0.283] [0.164] [0.249] [0.306] 12 months 0.996*** 0.485*** 0.853*** 0.430*** 1.039*** 0.485* [0.252] [0.155] [0.257] [0.165] [0.269] [0.291] Observations 369,916 369,916 368,898 368,898 369,869 369,869 Controls month fixed person & month month fixed person & month month fixed person & month
effects fixed effects effects fixed effects effects fixed effects
Figure 3
Effect of ARV treatment: Jwaneng mine
Notes: Panels A is from a Nonparametric Fan locally weighted regression with bootstrapped standard errors clustered by worker. Panels B, C, and D are from a fixed effect regression that includes worker and month fixed effects. Sickness-related absence duration data come from the company’s HR database for the Jwa-neng mine. The intervals used are five years before and four years after the onset of ARV treatment. Panels A and B use an unbalanced sample, Panel C a balanced sample, and Panel D a sample with weights based on inverse probability weights (IPW)
in the medium and long-term (one to four years after treatment initiation). Similarly, an enrolled worker displays a pattern of labor supply that is similar to nonenrolled workers throughout a large part of the postinfection period, a finding that challenges recent estimates in the literature (Fox et al. 2004).
In graphs not reported in the paper we have examined differences in absence patterns across worker types. We find that workers whose enrollment in the treatment program coincided with the start of ARV treatment have higher absenteeism rates than workers who started treatment after program enrollment. This is consistent with the fact that we find lower absenteeism rates in the year prior to treatment for workers with a higher CD4 count at treatment start. In addition, we find no differ-ences in absenteeism between women and men.22
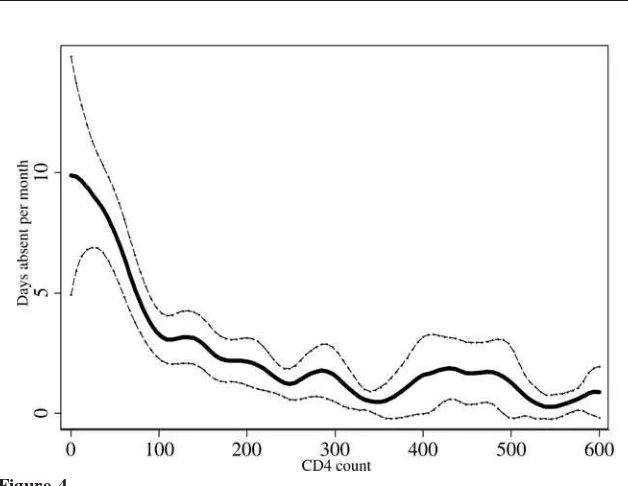
Figure 4
Relationship between CD4 Count and Sick Days from Work
Notes: Nonparametric Fan locally weighted regression with bootstrapped standard errors clustered by worker. Sickness-related absence duration data come from the company’s HR database and was linked to the CD4 count measured at the start of ARV treatment as well as six and 12 months after treatment start. The sample is unbalanced.
In sum, given the unusual length of the absenteeism panel of almost ten years and the fact that Debswana’s ARV program was one of the first in Africa, we were able to map out the short, medium and long run patterns of absenteeism of HIV-infected workers who receive ARV treatment. Our main results are as follows: (1) infected workers are as productive in terms of absence from work for most of the period when they are HIV positive, (2) about one year around the time of ARV treatment start, we see a steep inverse-V shaped pattern of absenteeism that peaks at about five days of absence a month, and (3) in the period one to four years after treatment start, patterns of absenteeism are similar to nonenrolled workers suggesting that ARVs are extremely effective in improving workers health and ability to work.
B. CD4 counts and Worker Absenteeism
In the CD4 count range of 100–400, one can observe a clear increase in absenteeism with deteriorating health and this effect is particularly strong for the sickest em-ployees with CD4 counts below 100. An employee with a CD4 count of 50 is absent from work due to illness about a week a month.
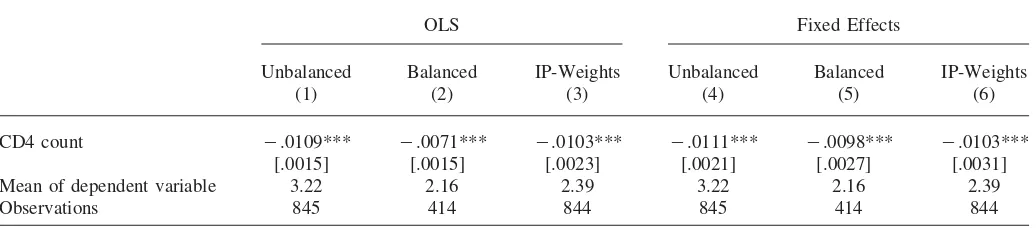
Regression results of the effect of health on worker absenteeism is provided in Table 2. Columns 1–3 present simple OLS regressions for the three samples (un-balanced, (un-balanced, ipw-weights) and include controls for a number of observable characteristics, such as age, gender, worker band, and time effects. Columns 4–6 also use the same samples but include person fixed effects. The results indicate that workers with a higher CD4 count are less likely to be absent from work: the esti-mates across all six specifications are large and highly significant and vary between
ⳮ0.0072 (standard error 0.0015) and ⳮ0.0111 (standard error 0.0021). These
es-timates suggest that a difference in CD4 count of 100 points (which is the average improvement in health after six months of ARV therapy in this treatment program) is associated with a decrease in illness-related absenteeism of roughly one day per month.23 Two main conclusions can be drawn from an analysis of Figure 4 and
Table 2: (1) we find additional evidence that the overall impact of ARV treatment of an HIV-infected individual on worker absenteeism is economically large and (2) the effect is particularly strong for those who are extremely sick (CD4 counts below 100).
V. Thinking About a Counterfactual
Figures 2 and 3 present the absence dynamics of workers who enroll in the treatment program between May 2001 and April 2006. As we discuss in the empirical strategy, the point estimates that trace out the inverse-V shaped trajectory around treatment start are identified using other HIV workers who start treatment at different times. This empirical strategy does not identify the effect of treatment on productivity since this requires observing the productivity dynamics of similar work-ers in the absence of treatment. As with other program evaluations, this exercise faces the same “missing data” problem that treated units are observed in one state and the counterfactual is never observed. In our case, this problem is made even harder because we do not know the HIV status of any worker who is not enrolled in the treatment program. In this section, we explore one approach to construct a counterfactual. We use information on health status at enrollment, the relationship between health and productivity and assumptions about the rate of disease progres-sion in the absence of treatment.24
23. Other studies in a similar setting find a similar CD4 response to ARV treatment. See, for example, Coetzee et al. (2004) and Wools-Kaloustian et al. (2006)
The
Journal
of
Human
Resources
Table 2
CD4 Counts and Absenteeism from Work
Dependent Variable: Number of Sick Days per Month
OLS Fixed Effects
Unbalanced Balanced IP-Weights Unbalanced Balanced IP-Weights
(1) (2) (3) (4) (5) (6)
CD4 count ⳮ.0109*** ⳮ.0071*** ⳮ.0103*** ⳮ.0111*** ⳮ.0098*** ⳮ.0103***
[.0015] [.0015] [.0023] [.0021] [.0027] [.0031]
Mean of dependent variable 3.22 2.16 2.39 3.22 2.16 2.39
Observations 845 414 844 845 414 844
We know that in the absence of treatment, the health of infected workers would deteriorate further culminating in death in a short period. In order to generate the counterfactual trajectory of labor supply, we need to specify a time path of health in the absence of treatment and predict corresponding productivity from the health-productivity mapping shown in Figure 4. We use the results in Morgan et al. (2002) on the median time to death for untreated late-stage HIV patients to specify a very simple linear time path of health: late stage patients lose 12 CD4 cells/l every month and death occurs at a CD4 count of 30 cells/l.25,26The
health-productivity-mapping is drawn from a cross-sectional regression of absence on a quadratic of CD4 count using information of workers at treatment onset (t⳱0). This relationship informs us of the marginal effect on absence of a decline in health of one CD4 cell/
l but predictably cannot provide any guidance on how to treat death. We assign 100 percent absence to all workers at or below our CD4 threshold of 30 cells/l.27
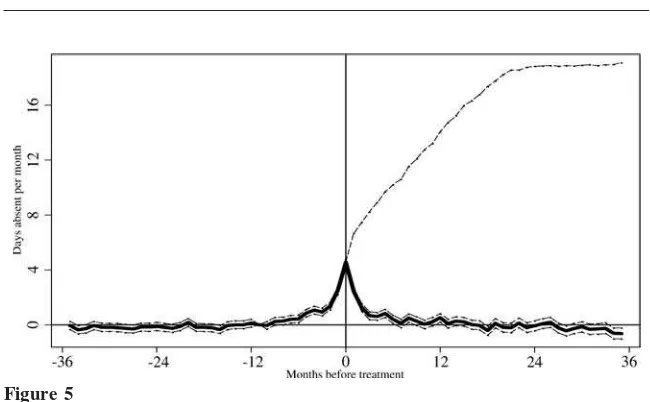
The results of this exercise are shown in Figure 5. The dashed line shows the expected trajectory of worker absence durations under the no-treatment condition for the three-year window corresponding to the balanced panel of figure 2. Under these assumptions, all enrolled workers would be dead within 26 months of their treatment start dates. The difference between this trajectory and the actual time path (dark line) in Figure 5 confirms the large effect of treatment on productivity.
VI. Is it Cost effective for Firms To Provide ARVs?
Our results suggest that to the extent that worker absenteeism is a good proxy for productivity, the ARV treatment program evaluated here is effective in restoring the productivity of infected workers over a considerable duration. But is this evidence enough to motivate firms to provide ARV treatment? In this section, we present a simple framework that models a representative firm’s decision to extend health coverage to include a terminal disease such as HIV/AIDS.28This framework
HIV/AIDS that can then be matched to workers who retire or exit prior to 2001. Secondly, it is likely that the firm’s decision to introduce treatment is optimal with respect to a rising epidemic: That is, the program is introduced at a time when the health of most infected workers has reached a point where treatment is necessary. Finally, it is possible that early victims of the epidemic exit before we can observe their absence profiles in the “posttreatment” period.
25. The Morgan et al. (2002) sample from which our estimates of health decline are drawn is very similar to the treatment program sample studied here. Set in rural Uganda, the median CD4 count for those subjects developing AIDS (Stage 4 of the WHO classification) was 126 (Median CD4 count for enrolled workers is 144). Median CD4 count within six months of death was 61; 20 percent of these subjects had a CD4 count⬍10.
26. The linearity assumption likely generates the most conservative `treatment’ effects. It is likely that the rate of decline is much higher at lower levels of CD4 count which would reduce working time considerably. 27. An alternative assumption would be to assign a company absence ceiling beyond which the employ-ment contract is terminated and a new worker is hired. Modeling the productivity implications of this would require further assumptions on the costs (in days worked) of replacing this worker and getting the new worker to the same level of productivity.
Figure 5
Counterfactual results
Note: The thick line represents actual absences for workers on treatment based on a balanced sample and on a fixed effect regression that includes worker and month fixed effects. The dotted line represents the counterfactual absenteeism rate in the absence of treatment discussed in Section V of the paper.
captures the human resource management problem facing a large number of firms in Sub-Saharan Africa that have to choose between providing/financing treatment for infected experienced workers and hiring new recruits.29
The details of this exercise are laid out in Appendix A. We begin by showing the conditions under which a representative firm will provide treatment in a context with no alternative sources of ARV treatment. Firstly, we show the conditions under which treatment of workers with HIV/AIDS is preferred to nontreatment and sec-ondly we delineate the conditions under which a firm prefers to hire an inexperienced worker instead of providing treatment to an infected (and experienced) worker. Our main treatment condition (Equation 8 in Appendix A) provides useful intuition: Firms compare the productivity benefits of treatment against the cost of treatment and the opportunity cost of keeping the infected worker. If the net benefits of re-taining a treated worker exceed the expected gains of a novice worker staying healthy and becoming highly productive, then firms prefer to retain the treated worker.
Finally using the willingness-to-pay-for-treatment condition (Equation 9), we at-tempt to estimate the share of actual treatment costs that manufacturing firms in Africa are willing to pay. In doing so, we try to account for the additional benefits of treatment along the intensive margin of labor supply. The best evidence comes from a Kenyan study of tea pluckers (Larson et al. 2008) which indicates that con-ditional on being present at work, the productivity of treated women on treatment
is 10–15 percent lower while the productivity of treated men is similar to a control group. In order to obtain a nonnegative willingness-to-pay, two conditions need to be satisfied. Firstly, we require that there is a wedge between the marginal product of labor and wages.30Secondly, we require a positive correlation between the size
of the marginal product-wage gap and worker tenure. Given the limited empirical evidence on the shape of worker productivity-wage relationship, we use the firm-based estimates in Postel-Vinay and Robin (2002) for our calibration. The descrip-tion of the parameter values used in the calibradescrip-tion is discussed in Appendix A and the results of this exercise are presented in Appendix Table 2. Our estimates indicate that manufacturing firms in Africa can finance between 7–21 percent of the costs of ARV treatment when treatment efficacy is low and the productivity-tenure profile is shallow (Column 4) and 13–50 percent when treatment efficacy is high and we assume a steep productivity-tenure profile (Column 1). Our preferred estimates from Column 3 suggest a willingness-to-pay range of 8–22 percent. In sum, despite the evidence that ARV treatment is able to restore the productivity of workers in the medium- and long-term, the benefits to firms of providing ARV treatment are too small for most firms in Africa to be economically feasible.31
B. Limitations of the model
Below we discuss some of the important limitations of our modelling framework. First, our analysis assumes uniformity across and within countries on the labor mar-ket frictions that give rise to positive marginal product-wage gaps. Secondly, our model does not fully account for a possible adverse selection effect that might arise if riskier types of workers select to work for a firm that offers ARV treatment. Thirdly, the decision of the firm to provide treatment also might be influenced by the availability of alternative treatment options. Our analysis in the appendix shows that these two latter factors generally would induce firms to be less inclined to offer treatment to their workers.
At the same time, our model and calibration does not account for a number of mechanisms that could make the provision of treatment profitable for the firm. Firstly the production function assumed exhibits no major complementarities between work-ers. A production function with strong complementarities would likely increase the firm’s willingness to pay for treatment.32Secondly our assumption of a
representa-tive firm precludes important strategic considerations that would have to incorporate the full range of treatment benefits (such as reciprocity effects on uninfected workers and consumers) (Akerlof and Yellen 1990; Fehr and Gachter 2002). Depending on
30. Theoretically this wedge has been posited in different types of models, such as the presence of labor market imperfections (Burdett and Mortensen 1998, in competitive implicit contract models such as Lazear 1979) or in models with symmetric imperfect information (Harris and Holmstrom 1982).
31. As mentioned earlier, we are not considering the socioeconomic benefits from ARV treatment that extend well beyond labor supply. As Graff Zivin et al. (2006) show large gains to the health and schooling of children in households with adults receiving treatment, gains in worker productivity are likely accom-panied by substantial benefits at the household level.
how big these additional benefits are and the relative pay-off to treatment provision, multiple equilibria may exist that include one in which some/all firms finance ARV treatment.
In sum, although we acknowledge some of the limitations of our modeling and calibration exercise, our main finding that the benefits of treatment to African firms is unlikely to cover a large fraction of costs is consistent with the conjecture in Rosen (2006) and projections from recent firm survey data from Sub-Saharan Africa. Using data from the World Bank’s Enterprise Survey web-portal, across 17 African countries surveyed in 2005/6, an average of only 12 percent of manufacturing firms provide HIV-testing services.33Less than one in six firms in South Africa provides
HIV-testing and Tanzania and Rwanda are outliers with more than a quarter of firms providing HIV testing. Since the provision of treatment requires HIV testing, these estimates represent an upper bound of the share of firms providing treatment.
VII. Discussion and Conclusion
In this paper we exploit an unusually long panel data set of worker absenteeism from the Debswana Diamond Company as well as information on one of Africa’s first firm-based ARV treatment programs to understand the effect of HIV/AIDS and ARV treatment on worker productivity. We find evidence that com-pared to other workers at the firm, individuals who are infected with HIV/AIDS display similar patterns of absenteeism until approximately one year prior to treat-ment start, when absenteeism starts to increase sharply. From an absenteeism peak of five days in the month of treatment onset, the workers quickly recover within the first year of treatment and then continue for the next three years to have patterns of absenteeism that are similar to those of healthy workers. Our results suggest that in an African context, ARVs are effective in the short, medium and long run in im-proving the health and productivity of workers and challenge recent claims that global support of ARV treatment will create health pensioners (The Economist, Au-gust 2006).
In the final section of the paper, we discuss a simple model in order to understand when the establishment of workplace AIDS treatment programs is optimal for firms in high prevalence economies. We first show that the decision to provide treatment to an experienced sick worker depends crucially on the assumption that the marginal product-wage gap be larger for workers with longer tenure than newly hired inex-perienced workers. Using a plausiblepositivemeasure of the marginal product-wage gap, data from a range of manufacturing firm surveys in Africa and assumptions on the efficacy of treatment, our preferred estimates suggest that firms are willing to pay 8–22 percent of current treatment costs. Since the cost of treatment exceeds the benefits of treatment across a range of economies in Eastern and Southern Africa, widespread firm-based ARV provision is an unlikely policy option. Moreover, it is unlikely that the rationale for treatment by firms would change if other possible
benefits of ARV treatment to the firm are taken into consideration, such as reductions in medical and health insurance costs, death benefits, funeral costs as well as the benefits to the firm’s reputation from investing in socially responsible programs.
Our conclusions are consistent with the fact that the majority of firms in Africa that have established ARV treatment workplace programs for their employees are very special companies, similar to Debswana. And while relatively recent develop-ments, such as the creation of the Global Business Coalition on HIV/AIDS, fore-shadow an increasing involvement of the private sector in combating HIV/AIDS, some of the recent success stories rely on the provision of significant public subsidies to ARV treatment programs administered by private companies as exemplified by the success of the public-private partnership between DaimlerCrysler and GTZ in South Africa.
References
Acemoglu, Daron, and Jorn-Steffen Pischke. 1999. “Beyond Becker: Training in Imperfect Labor Markets.”Economic Journal109:112–42.
Akerlof, George, and Janet Yellen. 1990. “The Fair Wage-Effort Hypothesis and Unemployment.”Quarterly Journal of Economics105:254–83.
Auer, Peter, Janine Berg, and Ibrahim Coulibaly. 2004. “Is a Stable Work Force Good for the Economy? Insights into the Tenure-Productivity-Employment Relationship.” Employment Strategy Papers 2004–15, International Labour Office.
Becker, Gary. 1964.Human Capital. Chicago: The University of Chicago Press.
Bertrand, Marianne, Esther Duflo, and Sendhil Mullainathan. 2004. “How Much Should We Trust Differences-in-Differences Estimates?”Quarterly Journal of Economics119(1):249– 75.
Burdett, Kenneth, and Dale Mortensen. 1978. “Labor Supply Under Uncertainty.” In Research in Labor Economics, ed. Ronald G. Ehrenberg. Greenwich, Conn.: JAI Press. ———. 1998. “Wage Differentials, Employer Size, and Unemployment.”International
Economic Review39(2):257–73.
Canning, David. 2006. “The Economics of HIV/AIDS in Low-Income Countries: The Case for Prevention.”Journal of Economic Perspectives20(3):121–42.
Carmichael, Lorne. 1983. “Firm-Specific Human Capital and Promotion Ladders.”Bell Journal of Economics14(1):251–58.
Chaudhury, Nazmul, Jeffrey Hammer, Michael Kremer, Karthik Muralidharan, and Halsey Rogers. 2006. “Missing in Action: Teacher and Health Worker Absence in Developing Countries.”Journal of Economic Perspectives20(1):91–116.
Cleary, Susan, Di McIntyre, and Andrew Boulle. 2006. “The Cost-Effectiveness of Antiretroviral Treatment in Khayelitsha, South Africa—A Primary Data Analysis.”Cost Effectiveness and Resource Allocation4:20
Coetzee, David, Katherine Hildebrand, Andrew Boulle, Gary Maartens, Francoise Louis, Veliswa Labatala, Hermann Reuter, Nonthutuzelo Ntwana, and Eric Goemaere. 2004. “Outcomes after two years of providing antiretroviral treatment in Khayelitsha, South Africa.”AIDS18:887–95.
Dehejia, Rajeev, and Sadek Wahba. 1999. “Causal Effects in Nonexperimental Studies: Reevaluating the Evaluation of Training Programs.”Journal of the American Statistical Association94:1053–62.
Duggan, Mark, and William Evans. 2008. “Estimating the Impact of Medical Innovation: A Case Study of HIV Antiretroviral Treatments.”Forum for Health Economics & Policy 11(2):1102.
Fehr, Ernst, and Simon Ga¨chter, S. 2000. “Fairness and Retaliation: The Economics of Reciprocity.”Journal of Economic Perspectives14(3):159–81.
Feyrer, James. 2007. “Demographics and Productivity.”Review of Economics and Statistics 89(1):100–109.
Fitzgerald, John, Peter Gottschalk, and Robert Moffitt. 1998. “An Analysis of the Impact of Sample Attrition on the Second Generation of Respondents in the Michigan Panel Study of Income Dynamics.”Journal of Human Resources33(2):300–44
Floridia, M., V. Fragola, C. M. Galluzzo, G. Giannini, M.F. Pirillo, M. Andreotti, C. Tomino, and S. Vella. 2002. “HIV-Related Morbidity and Mortality in Patients Starting Protease Inhibitors in Very Advanced HIV Disease.”HIV Medicine3(2):75–84. Fox, Matthew, Sydney Rosen, William MacLeod, Monique Wasunna, Margaret Bii,
Ginamarie Foglia, and Jonathon L. Simon. 2004. “The Impact of HIV/AIDS on Labour Productivity in Kenya.”Tropical Medicine and International Health9:318–24. Graff Zivin, Joshua, Harsha Thirumurthy, and Markus Goldstein. 2009. “AIDS Treatment
and Intrahousehold Resource Allocations: Children’s Nutrition and Schooling in Kenya.” Journal of Public Economics93(7–8):1008–1015.
Habyarimana, James, Bekezela Mbakile, and Cristian Pop-Eleches. 2009. “The Impact of HIV/AIDS and ARV Treatment on Worker Absenteeism: Implications for African Firms.” New York: Columbia University. Unpublished.
Hammer, S. M., K. E. Squires, M. D. Hughes, J. M. Grimes, L. M. Demeter, J. S. Currier, J. J. Eron, Jr, J.E. Feinberg, H.H. Balfour, Jr., L. R. Deyton, J. A. Chodakewitz, and M. A. Fischl.1997. “A Controlled Trial of Two Nucleoside Analogues Plus Indinavir in Persons with Human Immunodeficiency Virus Infection and CD4 Cell Counts of 200 per Cubic Millimeter or Less.”New England Journal of Medicine337(11):725–33.
Harris, Milton, and Bengt Holmstrom. 1982. “A Theory of Wage Dynamics.”Review of Economic Studies49:315–33.
Hellerstein, Judith, David Neumark, and Kenneth Troske. 1999. “Wages, Productivity, and Worker Characteristics: Evidence from Plant-Level Production Functions and Wage Equations.”Journal of Labor Economics17(3):409–46.
Heckman, James, and Richard Robb. 1985. “Alternative Methods for Evaluating the Impact of Interventions.’’ InLongitudinal Analysis of the Labor Market Data, ed., J. J. Heckman and B. Singer. Cambridge: Cambridge University Press.
Hutchens, Robert. 1987. “A Test of Lazear’s Theory of Delayed Payment Contracts.” Journal of Labor Economics5(4):S153–70.
Kaufmann G. R., M. Bloch, R. Finlayson, J. Zaunders, D. Smith, and D. A. Cooper. 2002. “The Extent of HIV-1-Related Immunodeficiency and Age Predict the Long-Term CD4 T Lymphocyte Response to Potent Antiretroviral Therapy.”AIDS16:367.
Koenig, Serena, Leandre Fernet, and Paul Farmer. 2004. “Scaling-Up HIV Treatment Programmes in Resource-Limited Settings: The Rural Haiti Experience.”AIDS18:S21– S25.
Kotlikoff, Laurence, and Jagadeesh Gokhale. 1992. “Estimating a Firm’s Age-Productivity Profile Using the Present Value of Workers’ Earnings.”Quarterly Journal of Economics 107(4):1215–42.
Antiretroviral Therapy on Work Performance: Preliminary Results from a Cohort Study of Kenyan Agricultural Workers.”AIDS22(3):421–25.
Lazear, Edward. 1979. “Why is There Mandatory Retirement?’’Journal of Political Economy87(6):1261–84.
———. 1981. “Agency, Earnings Profiles, Productivity, and Hours Restrictions.”American Economic Review71(4):606–20.
Lichtenberg, Frank. 2006. “The Impact of Increased Utilization of HIV Drugs on Longevity and Medical Expenditure: An Assessment Based on Aggregate U.S. Time-Series Data.” Expert Review of Pharmacoeconomics and Outcomes Research6(4):425–36.
Little, Roderick, and Donald Rubin. 1987.Statistical Analysis with Missing Data.New York, Wiley.
Manning, Alan. 2003.Monopsony in Motion. Princeton, N.J.: Princeton University Press. Marins, Jose Ricardo P., Leda F Jamal, Sanny Y. Chen, Marilisa B. Barros, Esther S.
Hudes, Aristides A. Barbosa, Pedro Chequer, Paulo R. Teixeira, and Norman Hearst. 2003. “Dramatic Improvement in Survival Among Adult Brazilian AIDS Patients.”AIDS 17:1675–82.
Mbakile, Bekezela. 2005. Presentation Given at the Center for Global Development, October 2005
Medoff, James, and Katharine Abraham. 1980. “Experience, Performance, and Earnings.” Quarterly Journal of Economics95(4):703–36.
Morgan, Dilys, C. Mahe, B. Mayanja, J. M. Okongo, R. Lubega, and J. A. Whitworth. 2002. “HIV-1 Infection in Rural Africa: Is There a Difference in Median Time to AIDS and Survival Compared With That in Industrialized Countries?”AIDS16:597–603. Postel-Vinay, Fabien, and Jean-Marc Robin. 2002. “Equilibrium Wage Dispersion with
Worker and Employer Heterogeneity.”Econometrica70(6):2295–2350
Ramachandran, Vijaya, Manju Kedia Shah, and Ginger Turner. 2007. “Does the Private Sector Care About AIDS? Evidence from Investment Climate Surveys in East Africa.” AIDS21 Suppl 3:S61–S72.
Rosen, Sydney. 2006. Quoted inFinancial Times, December 1, 2006.
Rosen, Sydney, Rich Feeley, Patrick Connelly and Jonathan Simon. 2006. “The Private Sector and HIV/AIDS in Africa: Taking Stock of Six Years of Applied Research.” Center for International Health and Development Discussion Paper No.7, 2006.
Rosenbaum, Paul, and Donald Rubin. 1983. “The Central Role of the Propensity Score in Observational Studies for Causal Effects.”Biometrika70:41–55
Shapiro, Carl, and Joseph Stiglitz. 1984. “Equilibrium Unemployment as a Worker Discipline Device.”American Economic Review74:433–44.
Shelton, James, Daniel Halperin, and David Wilson. 2006. “Has Global HIV Incidence Peaked?’’Lancet367: 1120–22.
Thirumurthy, Harsha, Joshua Graff-Zivin, and Markus Goldstein, 2008. “The Economic Impact of AIDS Treatment: Labor Supply in Western Kenya.”Journal of Human Resources43(3):511–52.
UNAIDS. 2002. “The Private Sector Responds to the Epidemic: Debswana—A Global Benchmark. Geneva: Joint United Nations Program on HIV/AIDS (UNAIDS Case Study) The Economist. 2006 “Look to the Future: The War Against AIDS.” August 19th 2006. The
Economist Newspapers Ltd. London, UK.
UNAIDS. 2006. Report on the Global AIDS Epidemic 2006. Geneva: Joint United Nations Program on HIV/AIDS (UNAIDS)
Wools-Kaloustian, Kara, et al. 2006. “Viability and Effectiveness of Large-scale HIV Treatment Initiatives in Sub-Saharan Africa: Experience from Western Kenya.”AIDS 20(1):41–48
World Bank. 2005. “South Africa: An Assessment of the Investment Climate.” Washington, D.C.: World Bank.
World Health Organization. 1990. “Interim Proposal for a WHO Staging System for HIV Infection and Disease.” Weekly Epidemiol Rec. 65 (29):221–24.Updated September 2005.
———. 2002. “The World Health Report’’. Geneva, Switzerland. WHO.
Young, Alwyn. 2005. “The Gift of the Dying: The Tragedy of AIDS and the Welfare of Future African Generations.”Quarterly Journal of Economics120(2):423–66.
Appendix A
To motivate the representative firm’s choice we assume that firms are infinitely lived. Workers differ in two attributes: experience and health status. There are three types of representative workers: healthy workers h, sick workers , and inexperienceds
workers n. The healthy and sick workers are assumed to have considerably more firm-specific experience than new recruits. Using asset equations, we can model the firm’s problem as solving the following program.34
rV⳱ Ⳮ(VⳮV)Ⳮ(V ⳮV )
In writing out this program, we have replaced the net instantaneous payoff to the firm(MPLiⳮw)asi.35 ⱖi 0represents the wedge between the marginal product
j j j j
of worker of typej and treatment condition , and wage i.36
僆
{
h,s, n}
i僆{
u,t}
wjAt recruitment, the firm does not know the status of the worker but knows the distribution of disease incidence.37 A worker has a probability of contracting a
34. We borrow the modeling of the firm’s problem from Shapiro and Stiglitz (1984). We abstract from other human-capital enhancements, such as training, that the firm might choose to provide. In our simple framework, productivity increases through the process of learning-by-doing. Incorporating firm-specific training into the model likely strengthens the case for firm-based treatment.
35. Implicit in this setup is a simple additive production function with minimal or no complementarities. We discuss the implications of relaxing this implicit assumption in the discussion section.
36. We assume that the firm earns rents on a worker as a result of frictions in the labor market that make the firm a wage setter (Burdett and Mortensen 1978; Manning 2003; Postel-Vinay and Robin 2002). Labor market imperfections are likely to be more relevant in developing country settings (see Agenor 1995 for a detailed review).
potentially terminal, but treatable chronic disease. If the worker becomes ill, the firm has a choice of whether to keep the infected worker with no treatment, whether to provide treatment to the worker or whether to replace the ill worker with a new worker. More formally, we defineV⳱max
{
Vt,Vu,V}
as the firm’s choiceprob-d s s n
lem conditional on a worker revealing her disease status, whereVst is the value to the firm of a treated worker, Vu is the value to the firm of an untreated infected
s
worker and Vn is the value to the firm of a new recruit. While the provision of treatment is likely to affect separation rates, we assume a constant nonillness-related worker turnover rate ofbper unit of time.38Firms bear the cost of treatment , andc
the probability of illness-related separation is lower under treatmentq .39 ⬍␦
We solve this program sequentially. We consider the firms preference over treat-ment conditional on infection and then between a treated worker and a novice. Solving Equations 5 and 6 above, the firm decides to provide treatment if Vtⳮ
s
. This treatment condition can be stated as follows:
u Vs⬎0
t u t
(qⳭr)(ⳮcⳮ )Ⳮ(␦ⳮq)(ⳮcⳮrV)⬎0
(7) s s s n
There are two parts to the left-hand side of the treatment condition. The first captures the net productivity effects of treatment over the duration that an untreated worker would be in employment.40The second captures the benefit associated with
keeping a more productive worker longer(␦ⳮq)per unit of time and delaying the hiring a new worker
[
tⳮ . This treatment condition illustrates that the firmcⳮrV
]
s nwill face different incentives to offer treatment to different types of workers. In particular, workers for whom the costs of illness (in terms of foregone productivity) are very high relative to treatment costs or workers for whom the returns to tenure are very high are more likely to satisfy the treatment condition.
To complete the model we need to determine the firm’s choice between hiring a new worker or providing treatment when treatment is preferred to nontreatment. We assume that the likelihood that a new worker becomes ill is the same as the likelihood of an experienced worker contracting the disease.41If a worker reveals him/herself
to be ill, then the firm chooses whether they should provide treatment or wait and replace. Learning by doing is the primary channel of productivity increases: with probability per unit of time the novice becomes a healthy experienced worker with value to the firm Vh. Given these parameters, the choice between treated and novice workers is given by the solution to of Equations 3, 4, and 5: ifV t, then
⬎V n s
, otherwise t.
Vd⳱Vn Vd⳱Vs
38. Using the data from Jwaneng that goes back to 1998, we do not find any statistically significant changes in the pattern of exits after 2001.
39. We assume that the wage paid to a treated and untreated ill worker is the samews. We abstract from within-firm deployment responses such as reassignment which could lower infected worker wages (as in Larson et al. 2008).
40. Because we assume that healthy and unhealthy workers with the same characteristics earn the same wages, differences in t uare driven by differences in productivity induced by treatment efficacy.
sⳮs