(IJSBAR)
I SSN 2 3 0 7 - 4 5 3 1
(Print & Online)
http://gssrr.org/index.php?journal=JournalOfBasicAndApplied
---
Assessment of the Constituency Development Fund in
Enhancing KCPE Performance of Public Primary Schools
in Kenya: A Case of Mwala Constituency
Kyiengo C. Maweu
a, Andrew Riechi
b, Gatimu Kiranga
c, Muondwe Samuel
d*a,b,c Kenyatta University, P.O Box438044, Nairobi,00100,kenya
dDedan Kimathi University of Technology, P.O Box 657,Nyeri-10100,Kenya
a
Email: [email protected]
dEmail: [email protected]
Abstract
Public primary schools are faced with many challenges related to the provision of adequate and appropriate
learning facilities and poor financial management skills which have had a negative effect on KCPE
performance. This study therefore investigated the efficiency of the CDF in enhancing KCPE performance in
public primary schools in Mwala Constituency. Data were collected using questionnaires and an observation
schedule. Responses were received from 119 respondents (21 head teachers and 98 teachers). Statistical analysis
was used to analyse closed-ended items and descriptive statistics used to analyse open-ended items using the
statistical package for social sciences (SPSS). The findings were presented in frequency percentage tables,
histograms and pie-charts. The study also revealed that as much as most schools have a number of physical
facilities as well as teaching and learning resources, the facilities are largely inadequate. Study findings also
show that most public primary schools in Mwala Constituency are experiencing a shortage of teachers and
non-teaching staff. It was however revealed that CDF has not been adequately channeled towards this situation hence
impacting negatively on KCPE performance.
---
* Corresponding author.
E-mail address: [email protected]
The study further established that challenges facing schools in regard to CDF funds range from the process of
application for the funds by schools which is prone to manipulation, poor implementation of CDF projects in
schools and lack of minimal support from stakeholders. It was concluded that there is a general feeling among
head teachers that CDF has had a positive impact on KCPE performance to some extent. It was however of
concern that the CDF funds have not been adequately utilised in areas that are crucial towards enhancing KCPE
performance. More emphasis is being placed on constructing more classrooms and forgetting provision of
teaching and learning resources and more teachers. Recommendations have therefore been made to streamline
the CDF management in schools so as to boost KCPE performance.
Keywords: Constituency Development Fund; Enhancing KCPE Performance; Public Primary Schools in Kenya;
Mwala Constituency.
1.Introduction
Universal Primary Education (UPE) is an international development goal which all countries are expected to
achieve by the year 2015 [1]. At the World Conference on Education for All (EFA) held in 1990 the importance
of ‘basic education’ was recognized. Article I of the World Declaration on Education for All adopted at the
conference clearly states that “Every person– child, youth and adult– shall be able to benefit from educational
opportunities designed to meet their basic learning needs”, focusing on value, significance, and effects of
education for individuals. The Dakar Framework for Action of 2000 set the goal with the statement “Ensuring
that by 2015, all children, particularly girls, children in difficult circumstances and those belonging to ethnic
minorities, have access to and complete free and compulsory primary education of good quality.” This was
further reflected in the Millennium Development Goals (MDGs) [1].
The aspect of ‘Investment in Primary Education’ has been a key element in the development process worldwide.
In United States of America (USA) elementary schooling is free and compulsory to all children [3]. In India
central government provide 80% of the financing of Free Primary Education (FPE), while the local states
implement and provide the rest of the financing [2]. African countries like Malawi, Uganda and Lesotho have
implemented FPE [4]. Implementation of FPE in Kenya on its part started laying down strategies of achieving
FPE as was first articulated in Sessional Paper Number Ten of 1965 on African Socialism to eradicate
ignorance, poverty and disease [4]. The first ever giant step towards granting FPE in Kenya was in 1974 [5]. A
presidential decree led to provision of Free Primary Education to pupils in lower classes. As a result, the total
enrolment, which stood at 2.1 million at that time, rose rapidly such that in 1978 it had reached 3.2 million [6].
This number weighed down on institutional growth such that in 1974, there were 3,700 primary schools and by
1980 the number had risen to 13,200 [1]. With enlarged enrolment, a countrywide building program launched to
cope with the required classes, charged school committees with the task of imposing building fund for each
child.
Re-introduction of FPE sought to address the limited progress towards the attainment of Universal Primary
Education witnessed in the last decade (UNESCO, 2003). A new approach to the provision of Free Primary
Education in Kenya was deemed necessary and in January 2003, it was declared in recognition of education as a
basic right for all Kenyan children as articulated in the Children’s Act of 2001. According to the [7], the
government would continue to pay teachers wage bill, support staff, pay for electricity, water and conservancy.
The government would specifically provide to all public primary schools the required basic learning/teaching
materials such as text books, exercise books, pieces of chalk and dusters.
The Ministry of Education through the government of Kenya has also made tremendous efforts to raise funds
from donors such as World Bank, UNICEF, European Union, USAID and Non-Governmental Organizations
(NGOs) like Plan International and CARE Kenya to finance FPE [8]. In Sessional Paper No. 1 of 2004 on
education and Training [9], the Government of Kenya demonstrates its commitment to the development of
education and training through sustained allocation of resources. Financing education, in general, and especially
in the context of the six goals of EFA has emerged as a key area, which needs urgent attention. At the
sub-regional meeting in Kathmandu in April 2001, the South Asia Forum, all Ministers/Secretaries expressed an
urgent need to have a comprehensive grasp of “financing”, ensuring that it reflects strategic policy shifts
vis-à-vis education, both for advocacy within countries and better use of resources for EFA [10].
The government of Kenya in addition to national budgetary allocation encouraged financing of primary
education through devolved funds such as CDF. According to [11]; the Constituency Development Fund (CDF)
is an additional means of financing (sourced from domestic revenue) for community-driven development
including education that is managed at the constituency level by Members of Parliament (MPs) as such it
supplements, or operates parallel to existing funding mechanisms for local government [12].
There has been a steady increase in budgetary allocations towards the CDF fund by the government since its
inception in 2003/2004 financial year
.
1.1.Statement of the Problem
Files According to [13]; as the results for the pioneers of the FPE were released, questions emerged on whether
FPE was a ‘curse’ to public schools. Since 2003, the KCPE mean score in public schools has stagnated at about
240 points compared to 300 points for private schools. Some teachers interviewed by the East African Standard
argued non-completion of the syllabus and congestion of pupils in classes hinders effective learning in public
schools [13]. Education expert Peter Odhengo concedes that congested and overstretched classrooms have
created unhealthy and uncomfortable conditions in most public schools. The PS said that while teachers in
public schools handle big classes, their counterparts in private schools usually teach not more than 40 pupils in a
class [13].
During the Mwala District Education Day, the District Education Officer observed that public schools that used
to be trailblazers now perform below expectation. Some of the former top performing public schools have
nose-dived in KCPE results since. The head teacher of one of such schools in her speech said parents used to be fully
involved in daily running of the school before the introduction of FPE. She said, "In 1980s and 90s, public
schools used to perform well as parents were buying books and library facilities. Since the introduction of FPE,
most of the parents have relaxed. They say Government has provided everything for their children," she
explained. This comes against the much held belief that public primary schools are expected to have overcome
these constrains through public funding by the government through FPE funds, the CDF as well as the Local
Authority Transfer Fund (LATF) putting public primary schools at par with private primary schools. This raises
questions on the efficient utilization of these funds especially in the identification of areas of funding. The
researcher therefore found it necessary to carry out this study with an aim of establishing the efficiency of the
Constituency Development Fund (CDF) in enhancing KCPE performance in public primary schools in Mwala
Constituency.
1.2 Objectives of the Study
The study sought to achieve the following objectives:
1. To assess the extent to which CDF has been used to provide school physical facilities in Mwala
Constituency.
2. To assess the extent to which CDF has been used to provide teaching and learning resources in public
primary schools in Mwala Constituency.
3. To assess the extent to which CDF has been used to provide school personnel in public primary schools in
Mwala Constituency.
4. To establish challenges facing utilization on CDF funds in public primary schools in Mwala Constituency.
1.3 Significance of the Study
This study may go a long way in highlighting to the government and members of the public on the way CDF
funds are being utilized in public primary schools through presenting information on areas being given priority
for funding and how this has influenced KCPE performance. The study may also provide literature for future
research through the information it will gather from the respondents. The study may further provide the
government and other policy makers with an objective assessment of the challenges facing utilization of the
CDF funds in provision of school inputs and therefore planners may be guided when allocating funds through
making more accurate estimates and allocations for the various requirements in the implementation of the
Universal Primary Education
policy.
1.4 Delimitation of the Study
Delimitation is a process of reducing the study population and areas to be surveyed to manageable size. The
study was delimitated by the fact that it was only conducted in public primary school in Mwala Constituency
and did not involve public primary schools from other constituencies in Kenya which are also benefiting from
the CDF funds. Therefore generalisation of the findings to the rest of the country should be done with a lot of
caution.
1.5 Limitation of the Study
The study was limited by the fact that given the sensitivity of issues related to utilisation of the CDF funds,
some respondents might have withheld some information for fear of victimisation. The study was also limited
by time constraints given that the researcher was not on study leave and therefore found it difficult to find spare
time within his work schedule to focus on the study. There were also constraints arising from the high costs of
conducting this study.
1.6 Assumptions of the Study
The study was based on the assumption that:
1. Public primary schools in Mwala Constituency are beneficiaries of the constituency Development Fund
(CDF).
2. Respondents are aware of key priority areas that require funding from the CDF funds.
3. All public primary schools in Mwala constituency have an operational school committee.
1.7 Literature Review
The following are discussed under literature review, dynamics of quality of education, public funding of
education, then impact of basic education financing on pupil performance, economics of financing education
and the concept of devolved state revenue allocations.
1.7.1 The Dynamics of Quality of Education
The question of the quality of education and its main determinants remains controversial amongst scholars,
policy makers and practitioners. Traditionally, teaching and learning inputs and examination scores have been
used as proxies for quality. However, we should remember the extent that factors shaping educational
experience are school-based, while others relate to the child’s family, community, social and cultural aspects of
the child’s environment, educational quality needs to be examined in relation to the social, political, cultural and
economic contexts in which it takes place [5].
Among the most important instructional materials that have been shown to have a significant influence in the
teaching-learning process are textbooks and other reading materials. Studies have pointed to evidence,
particularly in developing countries, that the availability of such materials has a positive effect on school
effectiveness [14,15,16]. Availability of textbooks has been shown to have a direct and positive correlation with
pupil achievement in developing countries. The Kenyan government began providing textbooks in schools
immediately after independence as one of the measures to support children from poor families. Under the Kenya
School Equipment Scheme (KSES), 20 Kenya shillings per child were provided at the primary school level for
the provision of learning materials. Increased enrolment in subsequent years, however, constrained the
government’s ability to fully meet the needs of schools and pupils. Subsequently, the cost-sharing programme
shifted the entire burden of book provision to the parents, and KSES was abolished in 1989. However, the
procurement and supply of textbooks to poor schools under an adjustment credit was re-introduced in the
1990/91 financial year. The importance of textbooks in the FPE programme is underscored by the fact that out
of the FPE funds of KES 1,020 per pupil, about two thirds (KES 650 or 64 percent) is earmarked for the
purchase of textbooks, supplementary readers and reference materials, among other items [14,15,16].
It is generally agreed that the most important manifestations of schooling quality (however defined) are literacy,
greater cognitive abilities and better student performance in examinations [5,17]. Internationally, pupil scores
have been accepted and used as a proxy of achievement. Traditionally, the Kenyan education system has
performed better than that of its neighbors as measured by the relevance and the quality of test items and overall
outcomes. As early as 1982, a comparison of the educational development in Kenya and Tanzania [18] noted the
higher educational attainment of Kenyans compared to Tanzania. They attributed the difference partly to the
more relaxed attitudes taken by the Kenya towards the growth of private schools contrary to the situation in
Tanzania. [17] Further noted that whereas many questions in the Kenyan examination system (KCPE) are
knowledge, there is still a strong emphasis on problem solving and application of knowledge and that as a result,
these examinations may be valid measures of students’ cognitive achievements.
1.7.2 Public Funding of Education
Reference [19] states in the United States of America use different methods to fund public education. State aid
to school districts can be classified in six categories: flat grants, foundation programs, guaranteed tax base
programs, percentage equalization programs, full state funding, and pupil weights. The flat grant is one of the
oldest types of state education aid. It is a straightforward mathematical calculation dividing the available funds
by a simple unit of measure. The state selects the funding unit, such as students or teachers, and distributes an
equal amount of funding per unit to school districts. Flat grants do not take into account the levels of local
funding or special needs of students [19].
According to [20]; Botswana has consistently devoted a greater share of government spending and gross
domestic product (GDP) to education than the other countries. According to [21]; the share of the government
budget going to education has increased in Uganda and is now similar to the share devoted in Botswana and
hence higher than the Sub-Saharan Africa (SSA) average. In Malawi, however, education expenditure has been
slow to grow and education spending as a proportion of government expenditure and GDP is low by SSA
standards. In Malawi and Uganda UPE was associated with a significant increase in spending on education as
would be expected. There is evidence that specific sectors lost out because of this prioritisation of education
[21].
According to [22] in the implementation of free primary education the Kenyan Ministry of Education
established a system in which all 18,000 public primary schools can receive capitation grants straight from the
Ministry through bank accounts. The annual amount is 1,020 Kenyan shillings (14 US dollars) per pupil, which
is earmarked for purchasing educational materials, such as textbooks and notebooks, as well as for the repairing
of school facilities and to ensure quality assurance. The total grant amount is determined by the number of
pupils enrolled, whereby, large-scale schools enjoy advantages over schools with fewer pupils [22]. The
government also allocated an additional 300 million shillings for the administration and monitoring of its
progress [23].
In the national budget for fiscal year 2005/06 (360,087 million shillings), expenditure for the Ministry of
Education (94,927 million shillings) accounted for 26.4% of the total budget and much of it was provided by
donor agencies [24]. The agencies were therefore becoming the primary funders for the education sector rather
than supplementing government efforts. According to [24] the government is fully aware of the high public
expenditure on education and the support it receives from international partners. It is in this regard that serious
consideration is being given to the need for the diversification of funding which has led to devolved funding of
education through CDF and the Local Authority Transfer Fund (LATF) [24].
1.7.3 Economics of Financing Education
According to [25] the first fundamental input for decisions in education is the unit cost per student or graduate
by level of schooling (primary, secondary, university or postgraduate), by curriculum type (general vs
vocational track in secondary education) or by type of faculty in higher education. Such cost must be
decomposed by the many inputs that enter into the production function of education, e.g. teachers' salaries,
rental cost equivalent of school buildings, textbooks, materials and supplies. Unit costs of private schools should
be juxtaposed to those for public schools. Costs must be broken down into public and private, the latter referring
to what the student actually bears. Public costs are the total resource cost of schooling, regardless of who pays
them. A significant part of the cost of schooling, especially in post-compulsory education levels, is the
opportunity cost of student time [25].
According to [27]; it is important to know the unit social (resource) cost of education. Equally, one must know
that the unit cost is of different types of curricula in secondary education, and also the per student cost of
university faculties. Actually, it is astonishing how many decisions on investment in certain levels (beyond
primary) and types of education are being made without explicit consideration of the cost of such provision, let
alone the expected benefits.
According to [27]. we can distinguish two broad classes of educational benefits. One refers to the immediate
educational outcome, or student learning. The other is the eventual labour market outcome, referring, of course,
only to those who will enter the labour market, often measured by the graduate's earnings. Student achievement
can be measured by any of the standard ways, e.g. by asking the student to take a test both at the beginning and
end of the schooling period in order to record the achievement value added, which in turn can be compared to
the pedagogical inputs that went into the learning process [27].
Assessing student achievement as the end product is very important for two reasons. First, many students will
never enter the labor market, or at least the formal modern wage sector. Hence, for them this is practically the
only educational outcome one can measure. But among non-formal labour market participants, market outcomes
can be measured by imputing shadow wages [27]. Second, even among those who will engage solely in
"household production", literacy can contribute to a long series of beneficial outcomes, such as better sanitation
conditions for all family members, awareness of family planning methods and reduced fertility.
Graduate earnings can be decomposed along the same lines as educational costs, i.e. they can correspond to the
graduates of different educational levels, to alternative curriculum types, public or private education, and to
people working in either the public or private sectors of the economy [25]. The latter two distinctions are very
important to make in order to approximate the productivity of graduates, as measured by the earnings of those
working in the private sector. Recording the earnings of graduates in the public sector is also useful, as this
sector can set the signals to which prospective students respond. It is also important to know the absolute (and
therefore, relative) salaries of graduates of the educational system, for studying issues of equity and the factors
determining income distribution [25].
Once the above primary analysis ingredients are available, there is a small step towards assessing the efficiency
with which resources are being used in education. For example, the coefficients of an educational production
function can be related to the cost of providing the respective educational inputs. This analysis can lead to policy
conclusions that one could not have imagined before, such as determining what inputs are more effective in
raising student achievement [26]. Similarly, the information of the costs and earnings/productivity differentials
can easily be combined to produce rates of return to investment in education, along all the dimensions according
to which the costs and benefits have been disaggregated, e.g. by level of schooling or curriculum type [25].
According to [25]; if we axiomatically accept basic education and literacy as a sine qua non right of every
person on this earth – a very tall order to be achieved in a short time period then, other than for academic
reasons, one need not waste time in estimating further returns to primary education. Whatever these monetary
returns are and they have proved to be very high in empirical estimations they are irrelevant when the
population's literacy is at stake [25]. Every child should graduate from basic education knowing the three Rs
(reading, writing and arithmetic), regardless of what a mechanical rate of return estimation to primary education
may show. Information on the above costs and relative salaries can also lead to a reverse rate of return
calculation, i.e. instead of inserting into the rate of return formula the stream of costs and benefits associated
with the investment in question, one can insert just the education costs and solve for the required productivity
benefits that would make the investment break even at a given discount rate. Often, by just inserting the cost of
the investment, it becomes extremely unlikely that the graduates of target educational level X will be 10 times
more productive than the control group to justify the investment [26].
1.7.4 The Concept of Devolved State Revenue Allocations
In making funding allocations to local governments we can think of state education financeinstitutions as a central
authority optimizing a social welfare function containing weighted values of equity, efficiency, and distributive
politics [28]. The state legislature is usually the dominant actor in these. The social welfare function analogy is
merely used as an organizing framework for theoretical discussion and later hypotheses testing. However, we
could easily formalize this approach with state central decision makers optimizing total state welfare by allocating
between school districts on the basis of equity, efficiency, and politics, [28,29].
Revenue allocations are based on a formula developed and approved by the state legislature, but with assistance
from the state education agency. The basis for state formulas varies widely, but usually considers such factors as
local revenue, local tax capacity, economies of scale, as well as other special needs [30]. While state allocations
are usually formula based, the political nature of developing and approving the formulas leaves substantial
leeway for allocation systems to respond to each of these values.
1.7.4.1 Equity
In the USA according to [31]; state decision-makers could assign all the weight in the social welfare function to
equity, by “leveling-out” revenues across districts in an absolute sense. However, this absolutist approach would
ignore the classic moral hazard problem associated with state revenue equalization efforts. If local school districts
recognize that state revenues are forthcoming up to the point of equalization, then there is no incentive for local
taxing authorities to tax their own residents. Therefore, full equalization is never guaranteed, and the state
allocation formula always depends on both local revenue effort and the tax capacity of the local district. Tax
capacity is the ability of citizens of the district to pay for education [31,31]. also report that in USA twenty-four
states use assessed property valuation in evaluating tax capacity. Nine additional states consider property
valuation along with a range of other revenue sources such as user fees, investments, and bonds. An additional
fourteen states consider property valuation and personal income in measuring tax capacity. The formulas whereby
local revenues combine with tax capacity to determine the rate of revenue equalization vary widely [30].
Another reason why absolute equalization might not be an appropriate standard is that it would ignore the special
circumstances that differentiate local districts. For example, rural districts have higher transportation costs and
often suffer diseconomies of scale from smaller student populations [30]. An argument can be made that absolute
equalization would penalize rural districts by not allowing for these differences. On the other hand, urban
taxpayers have higher total tax bills due to higher service levels and a larger number of taxing authorities. An
argument can be made that urban should therefore receive more state funding to compensate taxpayers for these
disadvantages. There are also wide variations in the number of “special need” students across districts. Absolute
revenue equalization ignores the higher costs of educating gifted, disabled, or disadvantaged students, thereby
penalizing other students within a district. Thus, absolute revenue equalization would not actually bring parity of
inputs. It is on this point that this study seeks to determine if revenue equalization is adopted when allocating
funds to public primary schools in Mwala Constituency.
1.7.4.2 Efficiency
State education finance institutions may also consider the positive externalities associated with education in
their allocation decisions. An externality occurs whenever the activities of one economic agent affect the
activities of another economic agent in ways that are not reflected in normal transactions [29]. In other words, a
higher gain to society results if state allocation decisions take into account potential gains beyond the benefit to
the local residents. Reallocation based on positive externalities is generally recognized to result in greater
allocative efficiency. Allocative efficiency means arranging inputs so as to produce the greatest gains for society
[29]. The state produces the greatest allocative efficiency by redistributing funds toward regions with higher
marginal returns [29].
Notes that, generally, educated workers have higher long-term earnings potential, and also provide a more
attractive environment for business investment. By subsidizing local education the state gains the long-term
benefits of a stronger economy and higher tax revenues. Since the potential for improvement is greater in
regions with less well-educated citizens, the state should target these regions to produce higher marginal returns.
Additionally, an educated workforce is important to minimizing such problems as illiteracy, unemployment,
poverty, and crime. Therefore, the state will spend less future money on unemployment compensation, welfare
payments, law enforcement, prisons, and other effects related to low education. Accordingly, states should also
target regions with high unemployment and poverty to maximize marginal gains and minimize future payments
for these problems [29].
Allocation efficiency is a concept that is theoretically distinct from equity and distributive politics. If an
allocation produces higher marginal gains for the state, relative to other possible allocations, then it should be
considered allocationally efficient [29]. Of course, illiteracy, unemployment, poverty, and related anomalies are
typically higher in the same regions where schools are poorly funded. Therefore, it may be difficult to
distinguish between state allocations based on these more specific problems versus a thrust for revenue
equalization [32].
1.7.4.3 Distributive Politics
States may also reallocate resources between regions based purely on political considerations. The weight given
to distributive politics in the social welfare function may be due to a genuine belief by decision-makers that
reallocation is somehow socially beneficial. For example, a social benefit may derive from reallocating toward
regions with heavy concentrations of certain racial or ethnic groups. However, democratic decision-makers need
not have such normative rationale, and may allocate politically on the basis of self-interest and the re-election
incentive [33, 34].
The state politics literature suggests that state decision makers respond to citizen preferences across a variety of
policy arenas. For example, [35]. found that state welfare payments respond to the cultural conservatism of a
state’s citizens. Likewise, [36]. showed that the relative progressiveness of a state’s tax system depends on state
liberalism. [37]. Found that state indebtedness responds democratically to the relative liberalism of a state’s
citizens. More generally, [38]. found congruence between citizen and government liberalism and state
allocations across a range of policy areas. There is also need to control for political responsiveness to various
group effects in the process of evaluating the importance of equity in the social welfare function [38].
According to [39]; over the period 2003-2007, the NARC government expanded fiscal decentralisation efforts
by introducing several constituency level funds that are popularly referred to as devolved funds. These funds are
transferred from central government to constituencies, and the authority to identify and manage projects legally
rests with the residents of the constituencies. They include one block grant—the Local Authority Transfer Fund
(LATF) - introduced in 1999 and financed mainly by 5% of national income tax and targeted grants such as the
Free Primary Education Programme, the Constituency Development Fund (CDF), the Secondary Education
Bursary Scheme (SEBS), the Constituency Aids Fund, the Youth Enterprise Fund, the Rural Electrification
Programme and most recently, the secondary school tuition fee waiver. Most of these funds were implemented
within the last two years of the NARC government. Despite the introduction of these funds, calls for more
political decentralisation remain. Indeed in 2007, one of the key issues on the election platform was whether
Kenya should go into a regional form of government thereby indicating that fiscal decentralisation efforts may
not be addressing pertinent issues of political and economic development adequately [39].
1.7.4.4 The Constituency Development Fund
According to [40]; the State University of New York Center for International Development (SUNY/CID) kicked
off a major project on “constituency development funds’ with a workshop for 25 academicians and practitioners
at the University at Albany’s Rockefeller College on 8-9 December 2009. Constituency development fund
(CDF) is the generic name for a policy tool that dedicates public money to benefit specific political subdivisions
through allocations and/or spending decisions influenced by their representatives in the national parliament.
According to [41]; as economies in the “developing world” grow and their political systems become
increasingly stable, CDFs have become increasingly popular. They are found in a growing and diverse set of
developing countries, such as Kenya, Bhutan, Jamaica and Papua New Guinea, as well as in the distributive
politics (generally called “pork barrel”) in US national and state level policy making. Operations of CDFs
remain controversial in donor communities because they raise fundamental questions about democratic theory,
the efficacy of government service delivery, the extent to which such service delivery can be made accountable,
the role of legislators in selecting development priorities, and how public participation in policy making can be
made more meaningful. It is a propitious time to launch a comprehensive program of exploratory and practical
research on CDFs [41].
CDF is one of the many development initiatives being undertaken by the Government of Kenya to address
poverty in the country. The main purpose of the fund is to ensure that a specific portion of the Annual
Government Ordinary Revenue (AGOR) is devoted to the constituencies for purpose of development and in
particular the fight against poverty at the constituency level. CDF fund projects are community based and
benefit a widespread cross-section of inhabitants of particular area. CDF funds cannot be used for purpose of
supporting political or religious bodies or activities [42].
According to [43]; the fund was established through the CDF Act (2003) and CDF (Amendment) Act 2007. The
Act covers the legal and institutional framework through which the fund operates. It shifts
planning/identification of projects to the local communities, hence a bottom-up planning approach to
development. At least 2.5% of AGOR is allocated for CDF program. Three quarter of the amount is divided
equitably between the 210 constituencies, while the remaining quarter is allocated to constituencies based on
their poverty ranking [43]. CDF Act has created several official bodies to carry out specific functions to ensure
smooth running of the program.
1.7.4.4.1 Assessment of Co-financing of CDF by Donor Agencies
According to [42]; CDF funding is complimentary to other development initiative of government. Therefore, the
government has encouraged CDF beneficiaries to seek other donors to complement its effort. Section 26 & 36 of
the CDF Act allow for co-funding of projects. The Act requires that where co-funding is undertaken, the name
of co-funder shall be acknowledged in the sign board and the amount involved specified. Local Authority
Transfer Fund (LATF) and Parents Teachers Association (PTA) are some of the major co-funders of the CDF
projects. LATF has mainly co-funded in infrastructure and public utility projects like public toilets, roads,
schools and market stalls, while different school PTAs have co-funded some of the school projects like
classrooms, dormitories and laboratories. Some constituencies like Marakwet East and West have co-funded in
projects like Marakwet Medical Training College. Some of the project’s key donors include AIC Church, and
Watt brothers who have contributed over KSh20 million while CDF has contributed over KSh6 million [42].
1.7.4.2 Transparency & Accountability
According to Constituencies Development Fund Act (Amendment) of 2007 there are mechanisms in place
which allow co-funding while at the same time ensures transparency and accountability. Such mechanisms
include the requirement that each co-funder in a joint project fund a specific phase or activity in a project. To
enhance transparency each donor is acknowledged on a sign board which may indicate a specific activity done
and if possible amount of fund contributed. Funds from CDF are banked in an account with suffix word CDF.
These funds are not mixed with other donors or beneficiary’s funds. This is to ensure more accountability and
transparency. This also ensures that CDF funds are protected from any bank overdrafts in the respective
beneficiary account. Separate donor bank account ensures that each donor can examine/query any expenditure
and bank transaction relating to respective donor’s amount [8].
1.8 Emerging issues in CDF utilisation
According to the Constituencies Development Fund Board Report to the Commissioners of Revenue Allocation
Commission on CDF Resource Allocation Criteria, implementation of the CDF programme is facing a number
of challenges. They include:
1. Low capacity of the committees leading to poor projects implementation.
2. Lack of community participation which leads to implementation of projects that are non-aligned to their
needs.
3. Spreading of funds to too many projects – This is caused by lack of proper planning and giving
consideration to political expedience rather than considering the benefits to the communities.
4. Lack of proper architectural designs and drawings make the most estimates too low with the effect that
most projects are allocated insufficient funds.
5. Poor quality of work due to non-involvement of professionals.
6. Lack of proper Bill of Quanities which leads to difficulties in monitoring works in progress.
7. Lack of supervision by the technical departments which leads to poor quality of projects and
misappropriation of funds.
8. Multiple roles by different government officials which makes it difficult to coordinate the results from the
projects.
9. Lack of proper records at the grass root level such as PMC and CDFC.
10. Political interests and struggle for scarce resources results in skewed projects in one side of the
constituency.
11. Abandonment of projects which results in wastage of resources.
12. Failure to differentiate between white elephant projects and key projects.
13. Lack of separation of powers between the MPs and CDF committees (conflict of interest) [44].
The CFD board has attempted to address these challenges in the following ways:
1. The Board partners with international organizations such as UNDP, ADB etc on periodic capacity-building
and preparation of manuals of main CDF stakeholders especially grass roots management units.
2. Computerization of the CDF Board hopes to link the secretariat office to the constituencies in an attempt to
improve data processing and access to information by all stakeholders.
3. The CDF Board has formulated a Strategic Plan for 2010 – 2014 aimed at guiding its operations.
4. To address mismanagement of the Fund, the Board has put in place key measures such as coming up with
policy guidelines and the Taskforce Review whose recommendations will address the existing gaps within
the CDF Act.
5. Strengthening of audit systems and collaboration with investigating agencies i.e. Kenya Anti-Corruption
Commission and Criminal Investigation Department on cases touching on fraud.
6. To intensify Monitoring and Evaluation Unit, the Board is in the process of hiring registered Structural
Engineers, Quality Surveyors and other staff on full-time basis. Their key role will be to monitor and
evaluate CDF projects.
7. Public education campaigns to create awareness and to enhance community participation in project
identification and implementation [44].
This study therefore sought to establish the extent to which these solutions to the challenges have enhanced
CDF’s efficiency in enhancing KCPE performance in public primary schools in Mwala Constituency.
According to [45]; construction of new schools and the freeze on teacher employment are the main factors
behind the severe shortage of staff, which was declared a national crisis by principals at their conference in
Mombasa. According to the Republic of Kenya in 2009 the number of classrooms in primary schools rose from
209,000 in 2008 to 220,000 in 2009. The pupil enrolment also went up from 8.6 million to 8.8 million, an
increase of nearly three million from 2002 levels. But all the expansion has not been met by a corresponding
increase in the number of teachers. Currently, there are only 219,387 teachers in public primary and secondary
schools, down from an average of 240,000 in the last decade when enrolment was much lower [11].
A survey by [45]; established that at least 1,000 new schools have been established using the Constituency
Development Fund at a time when the government has stopped hiring teachers. It is mostly these new schools
that have led to the creation of 13,223 classrooms in primary and secondary schools over a one-year period
between 2008 and 2009. It revealed that all regions in the country fear that the quality of learning is quickly
deteriorating as a rise in the number of pupils remains unmatched by the supply of teachers. It is estimated that
65,000 more staff are required to ensure quality learning, according to TSC statistics for last year (2009) [45].
According to [13] in the East African Standard 30th December 2010, in the North Rift and Western, education officials and parents want construction of additional schools using CDF stopped with parents saying that they
were being forced to employ teachers for the new schools. On average 10 schools have been built in each of the
constituencies in the North Rift region using the CDF. "Teachers are being transferred from long established
schools to those set up using CDF, causing serious imbalance of staff," Wareng district education officer
Elizabeth Otieno said. She disclosed that the district was faced with a shortage of 301 primary school teachers
[13]. "One teacher has to coach a stream of between 120 and 150 students which amounts to an over-load,"
MsOtieno said. The situation is similar in Eldoret East with the district education officer Jama Gama adding that
at Kiptechmet Primary School, three teachers were handling an average of 300 pupils while at Chelelek in the
same area, four teachers handle up to 400 pupils [45]. Parents called for planned use of the CDF money instead
of duplication of projects as in the case of "unnecessary" schools. Eldoret parent William Koech proposed
merging some of the schools to resolve the under-staffing problem (East African Standard 30th December (2010).
1.9 Impact of Basic Education Financing on Pupil Performance
As the EFA Global Monitoring Report 2005pointed out, lack of textbooks and other teaching materials (vital for
better learning) are also causes for concern in the education sectors. While there is no general theory as to what
determines the quality of education, studies conducted in developing countries point to significant relationships
between cognitive achievement and school expenditure. Evidence from a growing body of experimental studies
suggests that school performance (as measured by test scores) is significantly improved by textbook provision,
smaller class sizes, adequate instructional time, teacher qualifications and training, and teaching practices. These
findings are particularly true for children belonging to disadvantaged social backgrounds [46].
Reference [47] noted that the cross-country studies of quality outcomes show consistent effect of resources on
education outcomes. Studies using internationally comparable test scores tend to show that resources have a
significant impact, but the direction of this impact differs across studies. In [47]; the pupil-teacher ratio has a
negative and significant impact on achievement. Using similar data, the [48] study reports a positive but
insignificant result, while the [49] study, using class size as the resource variable, reports a positive and
significant impact. These last two results suggest that smaller class sizes are associated with better achievement
and, that the greater the level of resources available, the better the performance. Other measures of resources
used in these studies also show inconclusive or counter-intuitive results. The two studies that explore the impact
of per pupil expenditures on test scores, for instance, find that higher levels of expenditure are associated with
higher levels of achievement, although in only one of these studies is this effect significant [47,48].
No low-income countries were represented, and only South Africa from the African continent. It is unclear,
therefore, whether the absence of a consistent link between public expenditure and education resources would
also be found in low-income developing countries, and in particular in Sub- Saharan Africa which forms a basis
of the current study.
In a study by [47]. the pupil-teacher ratio is positively and significantly associated with these measures of
quality outcomes. These results, coupled with the results from the test score studies, suggest that larger
pupil-teacher ratios are associated with poorer internal efficiency and therefore poorer test scores. In addition to these
results, Reference [50] looks at the impact of resources on Grade 5 survival rates. This study shows that per
pupil expenditure is a significant determinant of primary school survival rates: higher levels of per pupil
expenditure tend to increase the persistence of primary school pupils.
Reference [51] argues, however, that there may be a slightly stronger link between resources and achievement in
developing countries, because education systems in developing countries tend to be so severely under-resourced
compared to developed countries that marginal increases in resourcing are likely to have much larger impacts on
education outcomes than in developed countries. A study of Tanzania documents clearly shows how different
values of the same education expenditure measure are reported in different documents for the same year [52].
In some countries, a large proportion of education expenditure is not allocated to specific education sub-sectors
and, in some cases, this unallocated category includes expenditure that is in fact sub-sector specific. For
example, textbook provision for all levels of the education system, in many SSA countries, is centrally
controlled, and this expenditure falls into the unallocated category as it is not always disaggregated by education
level [52]. While UNESCO attempts to ensure the resource measures it reports are comparable, it is likely that
there is some variation in the definition of these resource variables across countries. Further inaccuracies in the
education expenditure data may occur because expenditure recorded as being spent on education may in fact be
diverted for other uses. For example, in Uganda a public expenditure tracking survey found that only 30 per cent
of capitation grants intended for schools actually reached them [53].
According to [54] the effectiveness of the public expenditure management system is also an important area in
which the link between resources and outcomes is mediated. Unfortunately, no data are available to measure the
effectiveness of public education expenditure. The budgetary process and the relationship between planning and
budgeting are key to understanding the relationship between public expenditure and education outcomes, and it
has been argued that a major reason why education reforms have failed in the past is because they have
neglected the budgeting process [54,54]. further notes that in many developing countries, decisions regarding
the composition of education expenditure are partly determined by budgetary outturns. When available
resources fall short of planned expenditure it is easier to cut back on textbook provision than on teachers’
salaries, which leads to inefficient resource allocations.
Reference [55] argues that current allocations of resources across different input categories (e.g. teachers,
textbooks) are inconsistent with an output maximizing model of input choice. They argue that if this
composition were altered by, for example, spending additional resources in a different way, this spending would
lead to better education outcomes. Evidence from studies suggests that the cost-effectiveness of teacher salaries
is low in comparison with other inputs such as textbooks and other instructional materials. This implies that
additional resources concentrated towards non-salary inputs may have larger impacts on education out comes
[55].
In a study by Kennedy Omondi Otieno [13] on teaching and learning resources and academic performance in
mathematics in secondary schools in Bondo District of Kenya, the results show that classroom/laboratories and
stationeries/teaching aids are significant. These findings are in consonance with the findings of [56] and the
report by [57]. which opined that teaching/learning materials such as textbooks, class rooms, teaching aids
(chalk, board, ruler and protractor), stationeries and laboratories affect academic performance of the learners.
Also the result of the findings agreed with that of [58] who asserted that learning is strengthened when there are
enough reference materials such as textbooks, exercise books, teaching aids and class rooms. He further asserted
that academic achievement illustrates per excellence the correct use of these materials. The implication of this
result is that provision of conducive classrooms and laboratories and other teaching/learning resources can
positively change teachers’ attitude to the teaching of mathematics and make the subject to be very interesting,
meaningful and exciting to the students and hence will encourage mathematical exploration and manipulation by
students which will keep them alive and thinking and will also help them to realize the applications of
mathematics [58].
The implication of this finding is that without government financial support to the schools, most of the
infrastructures like classroom buildings and other learning materials may not be available for use by the
students. It is therefore necessary that the government should increase its support both financially and materially
towards support of teaching/learning of mathematics in all schools in Kenya. Lack of trained teachers was found
to be significant [58]. This is in agreement with that of [59] who asserted that experience and qualification is the
best asset for handling a task. In his findings, teaching is one of the duties that require both qualification and
experience for better delivery. Recruitment of competent teachers to improve teacher-student ratio is a necessary
measure in improving performance.
2. Research Methodology
The study adopted the descriptive survey design. Survey research design can be defined as a technique where
detailed information concerning social phenomena is collected by posing questions to respondents such that it
becomes possible to find explanation of social phenomena in question. Survey design concerns with gathering
of facts or pertinent and precise information concerning the correct status of phenomena and when possible
conclusions from the facts discovered. The design was used to investigate the efficiency of the CDF funds on
enhancing KCPE performance in public primary schools in Mwala Constituency.
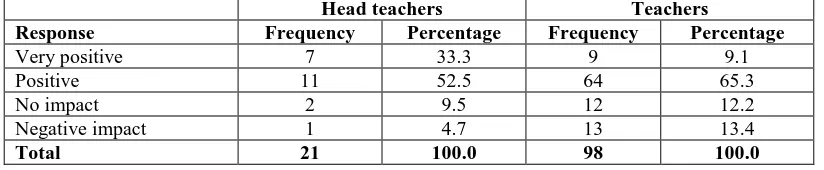
Table 2.1: Impact of CDF funds on performance
Head teachers Teachers
Response Frequency Percentage Frequency Percentage
Very positive 7 33.3 9 9.1
Positive 11 52.5 64 65.3
No impact 2 9.5 12 12.2
Negative impact 1 4.7 13 13.4
Total 21 100.0 98 100.0
Table 2.2: Use of CDF on provision of physical facilities
Head teachers Teachers
Solution Response F % F %
CDF has been used to ease overcrowding in classes by being used to build extra classes.
Yes 15 71.4 74 75.5
No 6 28.6 24 24.5
Total 21 100.0 98 100.0
CDF has been used to acquire more land for the inadequate playground.
Yes 2 9.5 12 12.2
No 19 90.5 86 87.8
Total 21 100.0 98 100.0
CDF has been used to build extra toilets and renovate existing ones.
CDF has been used to provide clean drinking water to the school.
Yes 1 4.7 14 14.2
No 20 95.3 84 85.8
Total 21 100.0 98 100.0
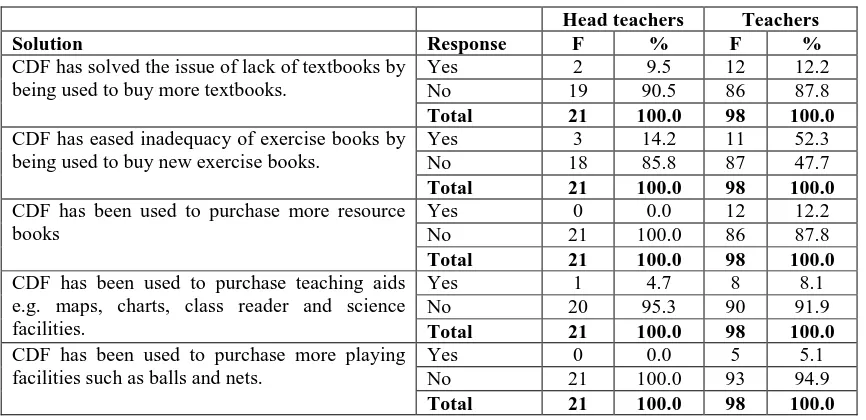
Table 2.3: Use of CDF in providing teaching and learning resources
Head teachers Teachers
Solution Response F % F %
CDF has solved the issue of lack of textbooks by being used to buy more textbooks.
Yes 2 9.5 12 12.2
No 19 90.5 86 87.8
Total 21 100.0 98 100.0
CDF has eased inadequacy of exercise books by being used to buy new exercise books.
Yes 3 14.2 11 52.3
No 18 85.8 87 47.7
Total 21 100.0 98 100.0
CDF has been used to purchase more resource books
Yes 0 0.0 12 12.2
No 21 100.0 86 87.8
Total 21 100.0 98 100.0
CDF has been used to purchase teaching aids e.g. maps, charts, class reader and science facilities.
Yes 1 4.7 8 8.1
No 20 95.3 90 91.9
Total 21 100.0 98 100.0
CDF has been used to purchase more playing facilities such as balls and nets.
Yes 0 0.0 5 5.1
No 21 100.0 93 94.9
Total 21 100.0 98 100.0
2.1 Data Analysis and Discussion of Results
This study assessed the efficiency of the CDF in enhancing KCPE performance in public primary schools in
Mwala Constituency. It looked into the efficiency of CDF in the provision of school physical facilities, teaching
and learning resources and school personnel. The study also examined CDF-related challenges experienced by
schools.
Table 2.4: CDF’s impact on provision of school personnel
Head teachers Teachers
Solution Response F % F %
CDF has been used to hire more teachers to ease the issue of teacher shortage.
Yes 2 9.5 3 3.0
No 19 90.5 95 97.0
Total 21 100.0 98 100.0
CDF has been used to employ more non-teaching staff
Yes 0 0.0 2 2.0
No 21 100.0 96 98.0
Total 21 100.0 98 100.0
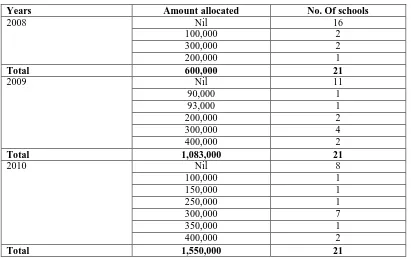
Table 2.5: Allocation of CDF funds to schools
Response Frequency Percentage
Have received CDF funds 21 100.0
Have not received CDF funds 0 0.0
Total 21 100.0
Table 2.6: Amount allocated to schools
Years Amount allocated No. Of schools
2008 Nil 16
Table 2.7: Attendance of CDF in-service training by head teachers
Response Frequency Percentage
Have attended 2 9.5
Have not attended 19 90.5
Total 21 100.0
Table 2.8: Teachers’ involvement in CDF application
Response Frequency Percentage
Are involved 30 30.6
Are not involved 68 69.4
Total 98 100.0
Table 2.9: Role of teachers during CDF application. N = 30.
Response Frequency Percentage
Giving opinion about the projects to be undertaken. 23 76.6 Presenting views on the problems in the school such as
shortage of instructional materials.
21 70.0
Participate in the preparation of the Bill of Quantity. 19 63.3 Participating in the school development committee. 18 60.0
Planning and management of CDF funds. 17 56.6
Calculating the sum required for the projects. 16 53.3
Taking the bill of quantity to CDF offices 3 10.0
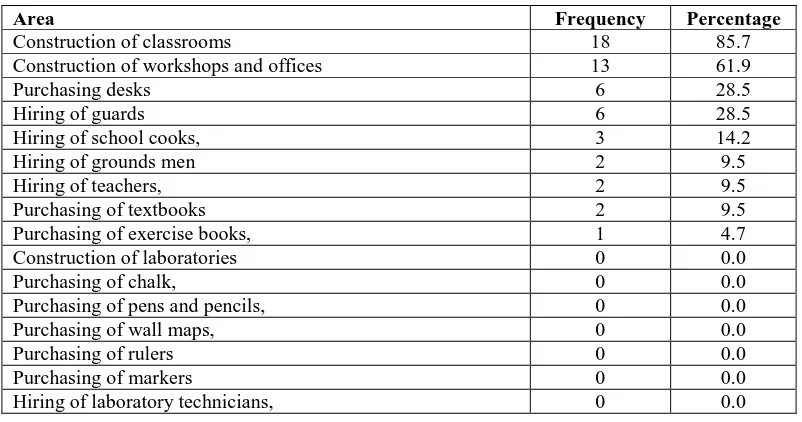
Table 2.10: Priority areas for CDF funding. N = 21.
Area Frequency Percentage
Construction of classrooms 18 85.7
Construction of workshops and offices 13 61.9
Purchasing desks 6 28.5
Hiring of guards 6 28.5
Hiring of school cooks, 3 14.2
Hiring of grounds men 2 9.5
Hiring of teachers, 2 9.5
Purchasing of textbooks 2 9.5
Purchasing of exercise books, 1 4.7
Construction of laboratories 0 0.0
Purchasing of chalk, 0 0.0
Purchasing of pens and pencils, 0 0.0
Purchasing of wall maps, 0 0.0
Purchasing of rulers 0 0.0
Purchasing of markers 0 0.0
Hiring of laboratory technicians, 0 0.0
Table 2.11: Identification of funding areas. N = 98.
Response Frequency Percentage
Recommendations from the school committee 72 73.4
Recommendation from departments 31 31.6
Recommendations on the CDF committee 20 20.4
Headteachers’ discretion 8 8.1
Area member of parliaments discretion 5 5.1
Table 2.1: Factors considered when allocating funds
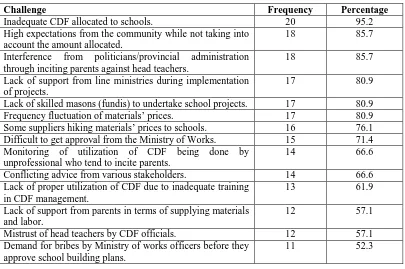
Table 2.13: Challenges facing utilisation of CDF according to head teachers. N = 21.
Challenge Frequency Percentage
Inadequate CDF allocated to schools. 20 95.2
High expectations from the community while not taking into account the amount allocated.
18 85.7
Interference from politicians/provincial administration through inciting parents against head teachers.
18 85.7
Lack of support from line ministries during implementation of projects.
17 80.9
Lack of skilled masons (fundis) to undertake school projects. 17 80.9
Frequency fluctuation of materials’ prices. 17 80.9
Some suppliers hiking materials’ prices to schools. 16 76.1 Difficult to get approval from the Ministry of Works. 15 71.4 Monitoring of utilization of CDF being done by
unprofessional who tend to incite parents.
14 66.6
Conflicting advice from various stakeholders. 14 66.6 Lack of proper utilization of CDF due to inadequate training
in CDF management.
13 61.9
Lack of support from parents in terms of supplying materials and labor.
12 57.1
Mistrust of head teachers by CDF officials. 12 57.1
Demand for bribes by Ministry of works officers before they approve school building plans.
11 52.3
Table 2.14: Solutions to Challenges facing utilisation of CDF according to head teachers. N = 21.
Challenge Frequency Percentage
Adequate funds should be allocated as per project needs. 20 95.2 Money should be allocated when needed without delay. 18 85.7 CDF committees should carry out a needs assessment in all
schools in the constituency.
17 80.9
.
The CDF application process should be reformed to make it less tedious.
16 76.1
CDF should come up with clear requirements on how to allocate the funds instead of schools having to use influential people.
16 76.1
Fairness should be exercised when allocating CDF funds to schools.
15 71.4
Teachers should be included in the CDF committees for they know better the needs of schools.
15 71.4
CDF should be channeled through NGOs and non-partisan (political) individuals.
12 57.1
The results of this study revealed that:
1. There is a general feeling among head teachers and teachers of public primary schools in Mwala
Constituency that the introduction of CDF for schools has had a positive impact on KCPE performance.
2. That as much as most schools have a number of physical facilities, the facilities are largely inadequate and
therefore have had a negative impact on KCPE performance. It was established that most schools in the
constituency lack adequate water for use in schools, desks and playgrounds, an indication that CDF funds
are not adequately being channeled towards providing these facilities. It was further revealed that CDF
funds have mostly been channeled towards construction of classrooms and offices.
3. The study also revealed that as much as all schools have teaching and learning resources, most of these
resources are largely inadequate and that CDF has not largely been channeled towards providing these
resources.
4. Study findings also show that most public primary schools in Mwala Constituency are experiencing a
shortage of teachers as shown by the fact that most of the schools have one teacher per class. Further, the
CDF has not been widely used to employ more teachers in most schools as seen by very few teachers
having been employed by school committees. The findings also show that teachers are teaching many or all
subjects which may affect their lesson planning as well as content delivery thus affecting KCPE
performance. It was also revealed that schools are faced with a problem of shortage of school non-teaching
personnel and that CDF has not been adequately channeled to these school personnel.
5. Inequitable allocation of CDF funds was found to be one of the challenges facing public primary schools in
Mwala Constituency. Schools also have to go through challenges associated to application for funds
through terms which involve having to present strong cases to the CDF committees so as to qualify for
allocation of these funds. A substantial number of head teachers found the CDF application process not
convenient and therefore a challenge to them. Some schools are also faced with a challenge of having to
lobby for CDF funds which exposes them to acts of extortion from unscrupulous CDF officials.
6. The study also established that head teachers are experiencing a challenge of lack of training on CDF funds
and therefore lack adequate knowledge on issues pertaining to the CDF fund and may therefore experience
problems when applying for the funds as well as when utilising the funds. Another challenge was that most
teachers are never involved in the CDF application process and therefore being the implementers of the
school programmers, their views are not incorporated leading to a situation where priorities for funds are
not very beneficial to pupils thus affecting their performance. Other major challenges include:
(a) Inadequate CDF funds allocated to schools.
(b) High expectations from the community while not taking into account the amount allocated.
(c) Interference by politicians/provincial administration through inciting parents against the head
teachers.
(d) Lack of support from line ministries during implementation of projects,
(e) Lack of skilled masons (fundis) to undertake school projects,
(f) Frequent fluctuations of prices of materials,
(g) Some suppliers hiking materials’ prices for schools,
(h) Lack of teachers’ involvement in budgeting and procurement processes,
(i) Poor management of CDF funds,
(j) Embezzlement of CDF funds meant for the school projects,
(k) Long application process before allocation is approved.
7. Solutions included:
(a) Adequate funds should be allocated as per project needs,
(b) CDF money should be allocated when needed without delay,
(c) CDF committees should carry out a needs assessment in all schools in the constituency.
2.2. Implications of the Study
The findings of the study have the following implications:
It was established that as much as most schools have a number of physical facilities, the facilities are largely
inadequate. This means that most public primary schools in Mwala constituency have fallen short of providing
an ideal learning environment for pupils. Most schools in the constituency also lack adequate water for use in
schools which may expose pupils to discomfort caused by thirst or even to water borne diseases due to use of
dirty water from streams. Lack of desks was also widely acknowledged which makes the learning process
uncomfortable for pupils. Schools also lack playgrounds which deny pupils opportunities to play. It was also
revealed that CDF funds have mostly been channeled towards construction of classrooms and offices. This has
led to a situation where schools have adequate classrooms which cannot be fully utilised due to lack of teachers.
It was therefore clear that inadequate school physical facilities has made teaching and learning in public primary
schools in Mwala Constituency difficult and therefore impacted negatively on KCPE performance.
The study also revealed that as much as all schools have teaching and learning resources, most of these
resources are largely inadequate. Lack of teaching and learning resources limits the effectiveness of any
instructional processes and therefore leads to poor performance in KCPE. The fact that CDF has not largely
been channeled towards providing these resources means that most schools are experiencing shortage of these
facilities and therefore affecting KCPE performance negatively.
Study findings also show that CDF has not been widely used to employ school personnel in most public primary
schools in Mwala Constituency. This means that schools are experiencing shortage of teachers and non-teaching
staff forcing teachers to teach many subjects which interferes with their preparation for lessons thus affecting
their content delivery. It also means that teachers have to deal with large classes of pupils which limit
individual attention to the pupils, giving and marking of exercises and general control of classes during lessons.
Shortage of non-teaching personnel means that schools lack personnel such as librarians, laboratory technicians
and school cooks. This hampers school programmers leading to poor KCPE performance.
From the study findings, it was clear that schools are faced with challenges such as inequitable allocation of
CDF funds, challenges associated with application for funds and utilisation of CDF funds. This means that many
schools are denied a chance to have adequate funds at the right time and may not be able to properly implement