M – 34
Classification of “kelurahan” and rural area into urban/rural class basically meant to form a layer (stratum) were used in the survey sampling techniques. With the status of urban and rural areas, the sample can represent the entire population correctly. Proper selection of variables could distinguish village into urban and rural class.
The purpose of this study was to provide an alternative selection of the most influential variables to determine the classification of villages in Indonesia with a mix method of bootstrap and binary logistic regression. The data used in this case is data Potensi Desa (PODES) 2011 which conducted by Badan Pusat Statistik. The methods used in this study are binary logistic regression and bootstrap. Logistic regression is one method of non-parametric regression where the response variable is categorical data. This method can also be used for data classification. Bootstrap, is known as one of the data simulation method, intended to simplify the inferential statistical analysis but produces a more robust analysis.
From previous studies showed that the variable density of population, the number of farm households, and the presence of the primary facility is the most influential variables in the classification of villages in Indonesia. From the previous studies also can be concluded that the bootstrap approach give small mistake of goodness in variance covariance matrix. The more bootstrap replication is used, the more robust the resulting analysis. The results showed that the presence of variable existence of Junior High School and hotels can be removed from the model without effecting goodness of fit of the model. The addition of new variables, existence of the internet cafe and bank is able to produce more powerful model for classification of the village.
Keywords: bootstrap, binary logistic regression, urban/rural village classification
INTRODUCTION Background
The main purpose of the development by Government of Indonesia was to improve people's lives, both material and spiritual enhancement. To achieve the goals, the development planning should be created carefully. One aspect to support in development planning is the availability of detailed data until the lowest level of region. Detail information until the lowest region could be used as a guidance in making policy so that it could be more precise.
level of the village. Due to the use of the term Desa/Kelurahan which was more appropriate for administrative purposes, Central Statistics Agency (BPS) performed village classification into urban or rural status. Classification based on urban and rural status was considered better in describing the characteristics of the village. Village classification into urban/rural status basically meant to perform a layer (stratum) which were used in the survey sampling techniques. With the status of urban and rural, the expected sample could be drawn to make better representation of the entire population. In the analysis, the villages classification into urban / rural status will give better results depict the actual situation compared with the classification of the Desa/Kelurahan (Imawan, 1986).
Formulation of The Problem
As a result from the successful development, some of criteria that was used in the classification of urban / rural status also changed. So we need to review what criteria that still could be used as distinctive variables between urban and rural status. From an economic perspective, renewal of variables was expected to reduce the cost of data collection if renewal process produce fewer selected variables. However, the emergence of new variables considered were able to classify the village better. Therefore, the selection of variables should be done well.
There were many methods can be used in the variables selection. Science development also enrich the variable selection method. One method was considered better in classifying urban and rural than other methods. Imawan (1986) have used the Principal Component Analysis (PCA) in the variables selection of distinguishing urban and rural. Developments in the data simulation was also providing substantial contribution in the variable selection method. Bootstrap method was regarded as sufficiently robust methods in inferential analysis (Efron, 1979). Otok et al. (2007) has conducted research using the bootstrap method combined with ordinal logistic regression and with MARS. The result was classification accuracy of bootstrap approach to each method gives a good small error both for unequal variance covariance matrix and the equal variance covariance matrix. Based on those studies, a combination of the bootstrap method and binary logistic regression could be applied to the selection of variables in the classification of urban / rural village status.
Goal and Benefit of The Research Project
The main question of this study is what variable could currently be used as a determinant for urban/rural village classification? The purpose of this study is to provide an alternative selection of the most influential variables in determining the classification of villages in Indonesia with a mix bootstrap method and binary logistic regression. The benefits of this research is enrich the knowledge of statistics with the adoption of bootstrap binary logistic regression in determinant variables selection in urban/rural classification in Indonesia. In the future, this research is expected to be used as a pilot to develop this method on other issues.
RESEARCH METHOD
Material/Subject
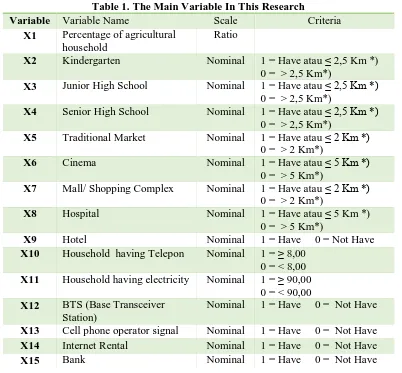
Table 1. The Main Variable In This Research
Variable Variable Name Scale Criteria
X1 Percentage of agricultural function of the area of government services, social services and economic activity. Urban is the status of a village-level administrative area / villages that meet the classification criteria of urban areas.
Rural Area
According to World Bank (2008) rural areas can be defined by the number of settlements, population density, distance to the metropolitan area, administrative segregation and the role of the agricultural sector. The Organization for Economic Co-operation and Development uses a population density of 150 people per km2 for defining rural areas.
Rural areas, according to Undang-Undang No. 26 of 2007 on the National Spatial Plan is a region that has a major agricultural activity, including natural resource management with the composition as a function of the area of rural settlements, government services, social services and economic activity. In Kamus Besar Bahasa Indonesia (2005), the village is a unit area inhabited by a panel of families who have a system of self-government (headed by a village head) or a group of houses in the villages outside the city which is unity.
Binary Logistic Regression
Logistic regression is one method of non-parametric regression where the response variable is categorical data. Binary logistic regression was used if the response variable consists of two categories (Agresti, 2002). In Binary Logistic Regression method can be used for data classification. Response variable Y = 1 states that the incidence of "successful" (in the category), while for Y = 0 indicates that the incidence of "fail" (not in the category). Variables Y will follow Binomial distribution.
The general form of logistic regression models odds with k independent variables is formulated as follows:
( ) = exp( + + ⋯+ )
1 + exp( + + ⋯+ ) …. ( 1)
If the models in the above equation is transformed by using the logit transformation of π(x), then the logistic model can be written as equation (Azen, 2011):
( ) = ( )
( ) = + + ⋯+ …. ( 2)
Parameter estimation in logistic regression using Maximum Likelihood Estimation. These methods estimate the parameter β by maximizing the likelihood function (Hosmer & Lemeshow, 2000). Predicted values of parameters are then tested to determine which independent variables that significantly affect the model. Testing the independent variables can be performed simultaneously or partially.
The hypothesis in partial parameter testing is: H0: βj = 0
H1: βj≠ 0, j = 1, 2, …., k
Partial parameter testing using Wald’s Test is (Azen and Walker, 2011):
= − ~ dengandf = 1 …. ( 3)
Parameter testing can be carried out simultaneously with the likelihood ratio test statistic (Likelihood Ratio Test) G by the following equation (Azen and Walker, 2011):
= −2 ~ ( ) …. ( 4)
One method that could be used to select the best model (goodness-of-fit and parsimony of the model) is Akaike’s An Information Criterion (Perlich, Provost & Simonoff et al., 2003):
= −2( − ℎ ) + 2( ) …. ( 5)
The lower AIC we had, the better model we got.
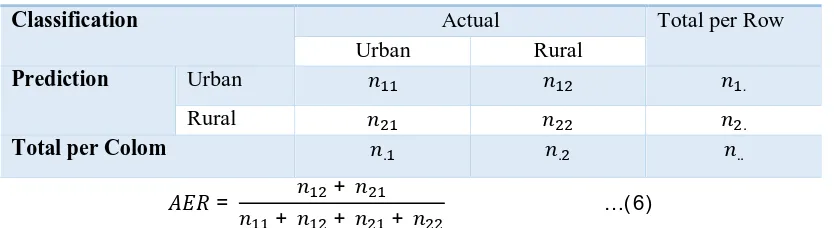
One method that could be used to measure the ability of the classification method in predicting a new dataset is Apparent Error Rate (Rencher and Chistensen, 2012). The illustration of this method could be seen in the table below:
Table 2. Two-way Classification Table
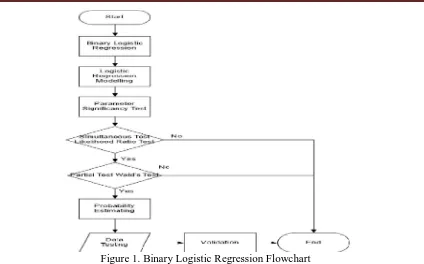
Figure 1. Binary Logistic Regression Flowchart Bootstrap
Bootstrap, known as one of the data simulation method, were becoming increasingly popular as a statistical methodology. Bootstrap was intended to simplify the analysis of statistical inference, which was sometimes difficult to obtain in certain situations the results of analysis. Along with the development of computer technology increasingly fast and reliable, time and effort required in the bootstrap process decreases to a level where the bootstrap become available alternatives to standard parametric techniques.
Bootstrap method was introduced by Efron (1979) to estimate the parameters of the distribution of unknown form. Bootstrap is a modification of the Jackknife technique introduced by Quenouille in 1948. Initially bootstrap was not using weight in probability model, but only based on the data, so that the bootstrap was known as a data driven approach. In the bootstrap re-sampling process was carried out from the data sample which was available with replacement procedure and then calculated the statistics of the sample hoping these examples represent the actual population. Usually the resampling process is done thousands of times in order to represent the data population. Bootstrapping allows one to perform statistical inference without making assumptions prior distribution.
Analysis Procedure
1. Selecting previous variables which have the smallest contribution for the model. Memilih peubah lama yang memiliki kontribusi paling kecil terhadap model. Variable selection could be done by using bootstrap simulation. The steps were:
a. Doing bootstrap simulation with n sample size and repeated for B times. The B is called replication.
b. For each bootstrap replication, we generate binary logistic regression model, so that we could have B model and their partial testing.
c. From B partial testing, we could see which variable that always significant in every replication and which are not. After that we made variable rank to decide which variable could be excluded first from the model.
2. Making new model without including variable the lowest rank, second lowest rank, and so forth, until we get the optimum model which has minimum variable and minimum error. 3. Adding new variable and repeating step 1 and 2, so that we could get new powerful model
with minimum error. RESULT AND DISCUSSION Selecting Main Variables
The first step is to create the initial model with binary logistic regression using variable X1-X11. From the partial parameters test results obtained that all predictor variables significant in distinguishing urban and rural areas. Because the p-values of all predictor variables were significantly different at α = 0.05 then all the variables was included in the initial model. The early models had AIC = 30.034 with AER=7.635%. Coefficient parameters and Z-Value shown in the following table:
Replication will be repeated as many as 10.000 (called B) times. So we would have 10.000 model. From these models, we could see which variables always significant in every replication. After that, we made percentage significance of each variable with the formula:
% = 100% …( 7)
The simulation above shows, if the bootstrap sample size equal to the actual sample size then the sensitivity of significance will be higher. All variables seemed alright, there would not need to reduce the amount of variables. Whereas if the bootstrap sample size is reduced, it would be seen which variables were not always significant. To support the objectives of the research, it will be ranked significance variable percentage of sample size 5000. The sequence of variables to be removed from the successive model is X3, X9, X5, X11, X6, X2, and X4.
Furthermore, the new model will be made by excluding one by one variable that has a smaller percentage of significance. To maintain powerful analysis, we used cross validation method called k-fold cross validation. In k-fold cross validation, the data will be divided into k parts. Then the test is done by making the first part as training data and (k-1) other parts as data testing. This is repeated k times, and then calculated the average error and the accuracy of each model. K value commonly used was 10. Then, we would compare the prediction error of the estimated value and the estimate of accuracy from each model. The results are as follows:
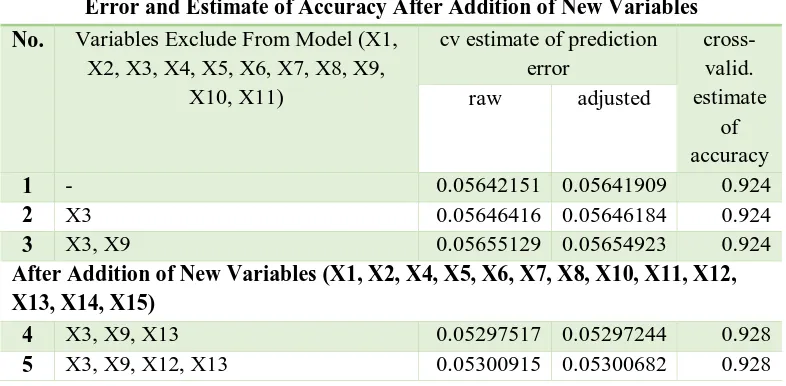
From the table above showed that when the variable X3 and X9 removed from the model, the level of accuracy of the model were as good as models with complete variables. So the decision to exclude X3 and X9 from the model is the right decision. The AIC of this model was 30.013 and AER was 7, 616.
Adding New Variables
X5, X6, X7, X8, X10, X11, X12, X13, X14, X15) turns simultaneous test and partial test of the new models also provide results that all the significant variables with the value of AIC = 28.308 and AER = 7, 201%. If we compared with the first model (consist of X1, X2, X3, X4, X5, X6, X7, X8, X9, X10, X11) and the second model (consist of X1, X2, X4, X5, X6, X7, X8, X10, X11) shows that the model with the new variable has the smallest AIC among the three and has a smaller classification error rate is also among the three. By repeating the bootstrap simulations on the model with an additional X12-X15, obtained the following results:
Table 7. Percentage of Significancy Variables in 10000 Bootstrap Replication and Variable Rank to be Included in The Model significance that a smaller percentage will then be compare the prediction error of the estimated value and the estimate of accuracy from each model. The results are as follows:
Table 8. . Simulation Variables Selection in Model With Estimate of Prediction Error and Estimate of Accuracy After Addition of New Variables
No. Variables Exclude From Model (X1,
After Addition of New Variables (X1, X2, X4, X5, X6, X7, X8, X10, X11, X12, X13, X14, X15)
4 X3, X9, X13 0.05297517 0.05297244 0.928
5 X3, X9, X12, X13 0.05300915 0.05300682 0.928
CONCLUSION AND SUGGESTION The conclusion of this studies were:
1. Model which consist of nine predictor variables (without junior high school and hotel variables) was better than complete model (consist of eleven main variables)
2. Model with four addition variables could increase classification accuracy.\
3. New Model which consist of X1, X2, X4, X5, X6, X7, X8, X10, X11, X14, and X15
is the optimum model because it had high accuracy and low prediction error. So this is the alternative determinant variables which could be used to classify the village into urban and rural status.
Suggestion for further research:
1. It is necessary to add more new variables that can improve the classification accuracy. 2. For further research, classification can be expand into more than two criteria.
REFERENCE
Agresti, A. (2002). Categorical Data Analysis. New York: John Wiley & Sons, Inc.
Azen, R. & Walker, C. M. (2011). Categorical Data Analysis for Behavioral and Social Science. New York: Routledge.
Badan Pusat Statistik. (2010). Peraturan Kepala Badan Pusat Statistik No.37 tahun 2010 Tentang Klasifikasi Perkotaan dan Perdesaan di Indonesia. Jakarta: BPS.
Barker, Nancy. (2005). A Practical Introduction to The Bootstrap Using the SAS System. Proceedings of the Pharmaceutical Users Software Exchange Conference, Paper PK02. Department of Economic and Social Affairs Statistiks Division. (2008). Principles and
Recommendations for Population and Housing Censuses. New York: United Nation. . (2014). Principles and Recommendations for a Vital Statistiks System. New York: United Nation.
Efron, B. & Tibshirani, R. (1993). An Introduction to Bootstrap. New York: Chapman &Hall.
Office for National Statistics. (2013). 2011 Rural Urban Classification. London: Government Statistical Service.
Otok,B.W,. Akbar, M.S. Guritno, S., & Subanar. (2007). Pendekatan Bootstrap pada Klasifikasi Pemodelan Respon Ordinal. Jurnal Ilmu Dasar, 8(1), 54-67.
Imawan, W. (1986). Penerapan Fungsi Diskriminan Dalam Penggolongan Desa di Jawa Timur. Jakarta: Universitas Indonesia.
Landis, P. H. (1948). Pengantar Sosiologi Pedesaan dan Pertanian. Jakarta: Gramedia Pustaka Utama.
Lapoliwa, H. (2005). Kamus Besar Bahasa Indonesia. Jakarta: Balai Pustaka.
Mailvaganam, H. (2007). Data Modeling and Mining: Modeling for Data Mining Retrieved from website: http://www.dwreview.com/Data_mining/DM_models.html.
Perlich, C., Provost, F., & Simanoff.J.S. (2003). Tree Induction vs. Logistic Regression: A Learning-Curve Analysis. Journal of Machine Learning Research, 4, 211-255.
Rencher, A.C. & Christensen, W.F. (2012). Methods of Multivariate Analysis Third Edition. New Jersey: John Wiley & Sons, Inc.