Rural Urban Disparity in and around Surabaya
Region, Indonesia
Vely Kukinul Siswanto
1, Jayant K. Routray
2and Rima Dewi
3AbstractA shift in development towards the outskirts of urban areas changes the characteristics of the region and can ultimately lead to urban disparities in economic and social terms. The current study has tried to divide the study area covers the areas of surrounding Surabaya as urban, peri urban and rural areas with reference to three time periods (2008, 2009 and 2010) and shows that the typology in the study area changes each year. Furthermore, based on the theil index analysis, using a number of pre-prosperous household for social disparity and per capita GDP (Gross Domestic Product) for economic disparity shows that urban and peri urban areas have medium and high level of social and economic disparity compare with rural area which have low levels of disparity. Through multivariate correlation analysis can be seen that the health center distance, electricity and water users effecting the social disparity. Moreover, the financial, industrial, electricity, trade, construction, transportation, agriculture, and mining sector's productivity have a significant relationship with the economic disparity. Health facilities, water and electricity improvement strategies to be followed for reducing the social disparity. Electricity improvement, water, services sector, transportation infrastructure, and industrial development to reduce the economic disparity
.
KeywordsSocial Disparity, Economic Disparity, Urban, Peri Urban, Rural Areas, Development, Surabaya
AbstrakPergeseran dalam pembangunan menuju pinggiran perkotaan perubahan karakteristik wilayah dan akhirnya dapat menyebabkan kesenjangan perkotaan dalam hal ekonomi dan sosial. Penelitian saat ini telah mencoba untuk membagi daerah penelitian meliputi bidang sekitarnya Surabaya sebagai kota, pinggiran perkotaan dan pedesaan dengan mengacu pada tiga periode waktu (2008, 2009 dan 2010) dan menunjukkan bahwa tipologi di daerah penelitian berubah setiap tahun. Selanjutnya, berdasarkan analisis indeks theil, menggunakan sejumlah rumah tangga pra-sejahtera untuk kesenjangan sosial dan kapita PDB (Produk Domestik Bruto) untuk kesenjangan ekonomi per menunjukkan bahwa daerah perkotaan dan pinggiran perkotaan memiliki tingkat menengah dan tinggi kesenjangan sosial dan ekonomi membandingkan dengan daerah pedesaan yang memiliki tingkat rendah kesenjangan. Melalui analisis korelasi multivariat dapat dilihat bahwa pengguna jarak puskesmas, listrik dan air mempengaruhi kesenjangan sosial. Selain itu,,, listrik, perdagangan, konstruksi, transportasi, pertanian, dan produktivitas sektor pertambangan industri keuangan memiliki hubungan yang signifikan dengan kesenjangan ekonomi. Fasilitas kesehatan, air dan strategi perbaikan listrik yang harus diikuti untuk mengurangi kesenjangan sosial. Perbaikan listrik, air, sektor jasa, infrastruktur transportasi, dan pengembangan industri untuk mengurangi kesenjangan ekonomi.
KeywordsDisparitas sosial, Disparitas Ekonomi, Perkotaan, Peri Urban, Perdesaan, Pembangunan, Surabaya
I.INTRODUCTION1
ithin the next two decades, a majority of the population in the Asia-pacific region was live in urban areas. The growth of urban population is a result of three processes: natural growth, rural-urban migration, and reclassification of rural into urban areas. Reclassification is a consequence of natural population growth and rural-urban migration, as rapidly expanding urban areas spill over into surrounding rural areas. These areas subsequently require reclassification into urban areas. In this process of urbanization, cities grow and mega-cities emerge. On the other hand, the urban population does not live in large cities, but in small and medium-sized towns [1]. The expansion of the city is caused by population growth and increased urbanization. The increasing population of the city led to the increasing public demand for housing, offices, and other socio-economic facilities [2]. The physically expanding in urban areas because of increasing population in surrounding urban can be called urban sprawl [3].
1
Vely Kukinul Siswanto is with Urban Development Management, Sepuluh Nopember Institute of Technology, Surabaya, Indonesia. [email protected]
2Jayant K. Routray is with Regional and Rural Development Planning,
Asian Institute of Technology, Pathumthani, Thailand. [email protected]
3Rima Dewi Urban and Regional Planning, Sepuluh Nopember
Institute of Technology, Surabaya, Indonesia.
Urban sprawl now can be seen in Surabaya city which is the second biggest city in Indonesia. It can be seen from the land use condition in this city, 90% of the existing land is developed land [4]. This condition led to an increase in land prices, and the people began to change their preferences to stay in the peri urban region. These stages take place in many cities around the world, both in developed and developing countries. After starting the migration phase to the peri urban, the urban sprawl phenomenon was beginning to occur in this area. The expansion of activity continued to the Surabaya city as the core towards Sidoarjo and Gresik district as the rim region [5].
The impact of the phenomenon of urban sprawl that has occurred in the city of Surabaya can also be seen through the high volume of transportation peri urban areas to downtown Surabaya and vice versa. At this time, the amount of movement of the peri urban area itself has exceeded the amount of movement that occurs in the city of Surabaya [6]. Total movement from the peri urban into the city of Surabaya in Ahmad Yani Street using cars reached 1,481,344 units per day. This movement is farther when compared with road corridors in the city, like the Pemuda Street who just passed 79,936 units per day [7].
It can be seen from the change of undeveloped land become developed land. This occurs almost happened in Gresik and Sidoarjo districts. With the average
percentage of change in the conversion of agricultural land into non-agricultural in 2006-2009 reached 8.38% in all districts in Sidoarjo, and land conversion occurring drastic happens in the Taman, Waru and Buduran sub-district that administrative directly adjacent to the city of Surabaya [8].
Gerbangkertasusila region is a region that is administratively separate but physically, economically, and socially integrated because of the reciprocal impact of the economy of Surabaya city to Gresik, Bangkalan, Mojokerto, Sidoarjo and Lamongan district [9]. Unification of both economic and social activity in this region may indicate urban sprawl events in Surabaya become the core city Gresik and Sidoarjo become the peri and rural areas. Symptoms occurring the urban sprawl will lead the trend of development city will shift to urban and peri urban (Facilities and Space Utilization Control Guidelines Completion of Urban and Sub Urban Area, I-1).
The shift in development towards the outskirts of the urban area will be able to change the characteristics of the economy and social in the region. The region is defined as a large area of land that is different from other areas of land because of some geographical, cultural, or economic characteristics [10]. Because of the uneven development of urbanization there will be space diversity in region into several group which include [11] :
• Sub Urban: area affected by urban sprawl due to the emergence of the issue which can facilitate the mobility of people heading to the outskirts of the city core. This led to the emergence of sub-urban area dependence with the city core.
• Peri urban: Peri urban area is an area that is experiencing growth due to migration of urban residents to rural areas far from the city. Peri urban areas still have a strong dependency to the city core, this happened because most of the people who are in peri urban areas still working in the city's core. • Rural Urban: It is a process of change in rural
communities in remote areas because of surplus agricultural or development in local potential that creates changes in rural communities (trade). So, from trading activities undertaken by other villages, will form trade relations would lead to a sub-node of urban as the rural network. This process will ultimately create spaces woke solid with a heterogeneous community activity. Activity in the form of non-agricultural and heterogeneous nature of urbanity in the rural urban is a system that integrates between rural and urban activities.
This research not only seen the region which has impact of urban sprawl but also the area which made the urban sprawl (urban area). As a result, this research was divided the region become three typology among others: • Urban Typology is the city's core that causes urban sprawl stricken suburbs. The majority of land use in urban are non-agricultural land use.
• Peri urban typology is the area that shows the transition zone between the core cities and rural areas that show a gradual transition from the appearance of non-agricultural land use to agriculture. All the
• Typology of Rural areas is the area which dominated by the agrarian sector and the degree of dependence on urban areas are still very small.
Urban sprawl gives several negative impacts in the environment, social and economic impact. From social perspective urban sprawl generates greater segregation of residential development and income.
East Java Province is one of province in Indonesia that has a higher-level index of disparity compared to other provinces in Java with an index of 1.38 until 1.61 [12]. Furthermore, Surabaya which is the second largest city in Indonesia that was located in East Java Province take an important role in achieving the highest level of economic inequality in this province.
Disparities between regions in Java mainly because of economic activity in the economic centers caused the flow of raw materials and labor from the supporters region (hinterland) to the centers of economic growth [12].
Disparity and imbalances between regions in Surabaya, Sidoarjo and Gresik (belonged to the Gerbangkertasusila region), not only be seen in terms of population, but also from an economic and social perspective. This is evident from the results of a study conducted by the regional planning agency stating that economic disparity index contained in the Gerbangkertasusila region increasing each year. In 2006 the level of disparity in Gerbangkertosusila region reaches a value of 0.89, in 2007 through 2010, respectively from 0.89; 0.9;0.93 to 0.95 [13]. While for social inequality in the province of East Java each year has increased from 0.29 in 2009, 0.31 in 2010 and 0.34 in 2011 [14]. Disparity in the area is high when the index of disparity reaches values of one of these data; there was an indication of the disparity in urban, peri urban, and rural areas located in Gerbangkertosusila.
Formation of Gerbangkertosusila region, according to the East Java Provincial Regulation No.4/1996 on national spatial planning, aims to achieve equitable development between regions. However, until now the disparity between the district and city in the Gerbangkertosusila region is still happening [15].
In the East Java Provincial Spatial Plan 2020, stated that the scope of the region Gerbangkertosusila, Surabaya City as a center of growth poles has grown so rapidly, leaving behind areas (hinterland). Surabaya growth tends to sprawl make the disparity between core city and the peri urban increased and it is a deviation from the goal of developing Gerbangkertosusila regions [15].
II.METHOD
Regional Typology In and Around Surabaya A.
Factor analysis was used to analyze which variable that can be used to divine the urban, peri urban and rural area. Factor analysis is used mostly for data reduction purposes [16]:
To get a small set of variables (preferably uncorrelated) from a large set of variables (most of which are correlated to each other).
To create indexes with variables that measure similar things (conceptually).
Specifically, factor analysis aims to find underlying latent factors, whereas principal components analysis aims to summarize observed variability by a smaller number of components [17]. By using the factor analysis, the variable which is related to each other can be found and the variable which is outlier will be removed.
Afterwards, the analysis used to divide the sub-district in study area becomes urban, peri urban and rural area with cluster analysis. The purpose of cluster analysis is grouping objects based on similar characteristics between these objects. The characteristics of a good cluster that have:
• Homogeneity internal (within cluster), the similarity between members of a cluster.
• Heterogeneity external (between clusters), is the difference between one cluster to another cluster. Cluster analysis primarily used for data reduction, is the process to summarize a number of variables into fewer and named as cluster or group. Using this analysis, it is from the various sub-districts in the study area were divided into three clusters or groups of several districts that have similar characteristics to form clusters urban, peri urban and rural.
After cluster analysis the next step to do is to merge or to overlay the data into a form of spatial data. Overlay itself is a merger of two or more maps that function to search map analysis. By doing this analysis technique are obtained which region has the characteristics of urban, peri urban and rural area.
Variables that will be used for cluster analysis among others: population density per unit of area, number of housing units per hectare, proportion of agricultural area, proportion of non-agricultural area, distance to the city center, road density, number of high schools per 10.000 people, proportion of non-agricultural labor, proportion of primary sector in GDP, proportion of secondary and tertiary sector in GDP, percentage of household covered under water distribution network and percentage of household have electricity.
Rural-Urban Disparity In Surabaya Region B.
To analyze the value of disparity based on economic and social characteristics in each typology that had been founded in Surabaya, Sidoarjo and Gresik district was done by using Theil index analysis. The calculation formula as follows [18]:
∑ [ ] [ ] (1)
Where for social disparity: Es is Social Theil Index, yi is Proportion of Pre-prosperous family in sub
district, is average Pre-prosperous family in study area and n is total data.
Where for economy disparity : Es is economic Theil Index, yi is total GDP in each sub district, is average GDP in study area and n is total data. Theil index will shows the disparity index among others [19] :
• 0 - 0.25 is in low level of disparity
• 0.25 – 0.50 is in medium level of disparity
• 0.50 – 0.75 is in a high level of disparity
• 0.75 - 1 is in very high level disparity
Furthermore, quartile method was used to explain the condition of the disparity in each typology. Quantile represents a classification of data in which each class contains a similar number of units (records, polygons). This analysis will help to dividing data into four classes produces quartiles separated by three class breaks. The formulas used are:
Determine the Quartile 1
(2)
where is Quartile 1and N is total Data Determine the Quartile 2
(3)
where is Quartile 2 and N is total Data Determine the Quartile 3
(4)
where is Quartile 3 and N is total Data
To calculate is from value until maximum value.
Factor Influence The Socio Economic Disparity In C.
Surabaya Region
The analysis was used to determine the factors contributing to the economic and social disparities between districts in study area by using correlation analysis techniques.
Correlation is a statistical term that states the degree of closeness of the linear relationship between two or more variables, which were found by Pearson Kearl in early 1990. This correlation is known as the Pearson Product Moment Correlation (PPM).
Correlation analysis tools used in the present study are multivariate correlation analysis. Multivariate correlation analysis is useful to know the relationship of one variable is called an explained variable with more than two variables explain (the explanatory). The first variable is also known as the dependent variable and the second variable is called the independent variable. The independent in this research are social and
economic disparity index.
III.RESULT AND DISCUSSION
A. Regional Typology In And Around Surabaya
Based on the factor analysis, variables that can be used for cluster analysis among others : population density per unit of area, number of housing units per hectare, proportion of agricultural area, proportion of non-agricultural area, distance to the city center, road density, number of high schools per 10.000 people, proportion of non-agricultural labor, proportion of primary sector in gdp, proportion of secondary and tertiary sector in GDP, percentage of household covered under water distribution network and percentage of household have electricity.
Based on the cluster analysis, there are three cluster formed as shown in Table 1 and Table 2. In brief, the characteristic of each typology is:
An urban area is an area which has the agricultural characteristic (have a high non-agricultural land area and non-non-agricultural labor), have a good infrastructure, close with core area. The agricultural land and labor is very less in this area. The peri urban area is an area which has the
characteristic of urban and rural area. The condition of non-agriculture and agriculture is equal each other. Some of the land in this area was used for non-agricultural area (industry, settlement, facility) and some of the land was used for agriculture area (field, fish pond).
Rural area is an area which has an agricultural characteristic (high agricultural land and labor), less infrastructure and far from the core area.
There are two sub-district which change the typology in 2008, 2009 and 2010. There are several variables that change and make the typology of sub-districts also change among others:
(1)Porong Sub-Districts
a. The changes typology from rural become peri urban area in 2009-2010
- Decreasing the percentage of primary production: this happens because the mining sector was decreased 2.5% from 11.82% become 9.31% from total GDP or from the 55,341 million rupiah become 44,339 million rupiah or decrease around 11,002 million rupiah. The decreasing of mining sector makes the percentage of secondary and tertiary sector increase and change the typology of the Porong sub - district from rural area become peri urban area. This occurs due to the impact of the mudflow disaster that occurred on 29 May 2006. This leads to approximately 21 large companies / medium and 2,335 small and medium businesses lost due to this disaster recorded 1,873 workers affected by the mud should lose his job. This led to economic transactions increasingly hampered by the closing of highways and railway lines due to exposure to the mudflow. Sector productivity fell this year is agriculture, quarrying, processing and construction industries. The negative impact of this disaster makes the GDP especially mining sector is decreasing. The decreasing of the mining sector in 2010 make this sub-districts change from rural area become peri urban area.
(2) Manyar Sub-Districts
a. The changes typology from rural become peri urban area in 2008-2009
- Increasing of population density: the population density increase from 8.84 people per km2 become 10.55 people per km2 or increase 1.71 person per km2.
- Increasing of housing density: the housing density increase from 1.82 building /hectare become 2.58 buildings/hectare or increase around 0.76 building/hectare. This happens because there are increasing in population and make the housing need is increasing. As a result, the housing density also increases as long as the increasing of population. b. The changes typology from peri urban become rural
in 2009-2010
- Decreasing the percentage of secondary and tertiary production: this happens because the industrial sector was decreased 50,4% from 22,9% become 5,5% from total GDP or from 1,186,671 million rupiah become 40,761 million rupiah or decrease around 1,146,000 million rupiah. The decreasing of the industry makes the proportion of secondary and tertiary production decrease and automatically increase the proportion of the primary sector in this sub-district.
The decreasing of industry sector is happening because in 2009 there is spilling thousands of liters of diesel belonging to Gresik Distribution Terminal (GDT) in Maspion Industrial Area (KIM) Manyar Sub district, Gresik regency, East Java, is alleged to have run over to pollute the sea. Gresik Distribution Terminal (GDT) is the company which distributes the diesel, electricity and other energy to the Maspion Industrial area. The spilling of diesel makes the supply of energy to this industrial estate was obstructed and makes the production decrease. As a result, the industrial sector productivity in this sub-district was decreased.
B. Rural-Urban Disparity In Surabaya Region
1) Social Disparity
From the figure above can be seen that the social disparity is fluctuating in each typology annually. Urban and peri urban typology have medium social disparity. However, rural area has a small social disparity in every year. immigration makes the social disparity higher because most of the immigrant came from a rural area. They come to urban because they interest with the lifestyle in an urban area, easy to find a good job, have a high income and they will come back again to their hometown and show the relatives that they already success. However, the in reality they can’t find the job due to the lack skill and education. But it is hard for them to go back in the hometown because they do not get success. Finally, they decided to stay in urban areas. They live in a slum and a squatter area with lack of public facility (water and electricity). This happens because they stay in
illegal building. Not only can’t get the facility, their
they did not have an identity card to stay in an urban area that required to get free health services. Their children also cannot get a good education because they didn’t have money to pay tuition fee and they can’t get a scholarship because they didn’t have an identity card to show they are natives in urban areas. On the other hand, there are many people who have good income because they have a skill that very useful to find a good job. They can get health and education, water and electricity facilities very easy. This makes the social disparity become bigger in urban areas. On the right side there are many high buildings with luxury, but on the other side there are many non-permanent houses (slum area) which is very dirty and unsuitable for habitation with a high transition of urban and rural area. Many people work in non-agricultural sector and agricultural sector and they have difference income and difference needs. However, most of the people who work in urban area and live in peri urban area who work in the non - agriculture sector is in middle and high class and they have higher income than the people who work in the agricultural sector. They migrate from urban area to peri urban area because they want to buy houses in urban area due to the high price of land. However, for the high class people want to live in the house which has a large back yard with good nature and good environment. In the other hand, there are many people who still live in agriculture sector and they don’t have much income compare with migrant groups. The migrant groups can take their children to take school and use the health center in urban area because they didn’t have difficulty to pay the additional cost to go to urban area and this condition is very different with the indigenous people who live and work in agriculture sector with small incomes. They cannot go to urban area which has a good quality of social facility. These differences make the social disparity increase and surpass the social disparity in urban areas.
Otherwise, the rural typology has the smallest index of social disparity. In 2008, the social disparity in rural area is 0.10 and decrease until 0.07 and increase in 2010 around 0.10. This happens because the pre-prosperous household is very high than in urban and peri urban area but the differences of social condition among them it’s not quite different. Most of the people in rural area become a farmer or another job in the agricultural sector and the income is not quite each other. The small amount of income makes most of rural people just finished the education until junior high school, go to the health center if they get sick and their life very simple with non-permanent house because this is their culture.
The quartile method used the ratio of their index. This ratio explains about how the difference is the number of pre-prosperous family in each sub-district with the whole average pre-prosperous family in some areas. This method will help to know which sub-districts have a high disparity and make the disparity in the region higher.
The sub-district that caused the social disparity high is the sub-district which is included in Q4. This happened
because this quartile consists of sub-districts which have the highest ratio of social disparity. The high ratio of social disparity shows the more different value of total pre-prosperous and total household compare with other sub-districts.
From the quartile method the sub-districts can be classified into low, medium, high, and very high disparity. The sub-districts which include in several category always change. But, there are several sub-districts that didn’t change in every year among others: Low disparity (Q1): Dukuh Pakis, Sidayu, Waru,
Gayungan, Gunung Anyar, Sidoarjo, Pabean Cantikan, Rungkut, Sawahan , and Sukolilo sub-districts.
Medium disparity (Q2): Ujung Pangkah, Sukodono, Candi, Gedangan, Bungah, Mulyorejo and Genteng sub-distrcts.
High disparity (Q3): Buduran, Tandes, Krembangan, Cerme, Tanggulangin, Tarik, Dukun, Gresik and Panceng sub-distrcts.
Very high disparity (Q4): Tegalsari, Bulak, Benjeng, Menganti, Lakarsantri, Driyorejo, Kedamean, and Kenjeran sub-districts.
Furthermore, there are 33 sub-districts which always change among others:
Fluctuating social disparity: Asemrowo, Benowo, Semampir, Tenggilis Mejoyo, Wonocolo, Kebomas, Manyar and Sangkapura sub-districts. The fluctuating disparity is happening because there is some fluctuating in terms of total pre-prosperous family in sub-district.
Increase social disparity: Gubeng, Jambangan, Pakal, Simokerto, Wiyung, Balongbendo, Krian, Porong, Jabon, Duduksampeyan and Wringinanom districts. This happened because most of this sub-district have increased the number of pre-prosperous family.
Decreased social disparity: Karangpilang, Sambikerep, Sukomanunggal, Tambaksari, Wonokromo, Bubutan, Krembung, Prambon, Sedati, Taman, Tulangan, Wonoayu and Tambak sub-districts. This happened because most of the sub-district which change can decrease the number of pre-prosperous family.
2) Economic Disparity
From the figure above shows that urban area has a medium level of economic disparity in each year from 0.24 in 2008 increase become 0.29 and decrease again become 0.20. The economic disparity in urban area has happened even though the pre-prosperous household in urban area is less than in peri urban and rural typology. This happens because most of the household in urban area is prosperous but the rest household is poor. The differences in terms of occupation with different levels of income make the economic disparity higher.
The economic disparity in peri urban is in medium level. In 2008, the economic disparity in peri urban area is 0.24 and increase to 0.38 in 2009 and 0.29 in 2010. This happens because peri urban is the transition of urban and rural area. There are differences in terms of income because many people work in non-agricultural sector and also in agricultural sector. The differences in occupation make the economic disparity higher because they have greater differences of income.
economic disparity. The economic disparity is around 0.11 in 2008, increase become 0.04 in 2009 and 0.03 in 2010. This happens because most of the people in rural area have less difference in terms of occupation and income. Most of them work in the field become farmer or other occupation that related to agriculture.
From the quartile method the sub-districts can be classified into low, medium, high and very high disparity. The sub-districts which include in several category always change. But, there are several
sub-districts that didn’t change in every year among others:
Low disparity (Q1): Dukun, Sangkapura, Tambak, Jambangan, Sukomanunggal, Balongbendo, Sukodono, Krembangan, Tanggulangin, Menganti and Wonoayu sub-distrcts.
Medium disparity (Q2): Buduran, Krembung, Krian, Taman, Mulyorejo, Sambikerep and Simokerto sub-distrcts.
High disparity (Q3): Tandes, Karangpilang, Kenjeran, Benowo, Tambaksari, Wiyung, Tarik, Waru, Pakal and Gedangan sub-distrcts.
Very high disparity (Q4): Dukuh Pakis, Genteng, Sedati, Sukolilo, Gubeng and Gunung Anyar sub-distrcts.
Furthermore, there are 34 sub-districts which always change among others:
Fluctuating economic disparity: Lakarsantri, Bubutan, Tenggilis Mejoyo and Kedamean sub-districts. This happened because of many sub-district was fluctuating of total number of GDP.
Increase economy disparity: Gayungan, Pabean Cantikan, Sawahan, Semampir, Wonokromo, Bulak, Camdi, Prambon, Sidoarjo, Tulangan, Jabon, Balongpanggang, Bungah, Panceng, Sidayu and Ujungpangkah sub-districts. This happened because there are many sub-district which can increase the GDP highly and become more developed. As a result, the sub-districts which cannot develop they will become more backward and make the economic disparity highest.
Decreased economic disparity: Rugkut, Tegalsari, Wonocolo, Porong, Benjeng, Cerme, Driyorejo, Duduk Sampeyan, Gresik, Kebomas, Manyar and Wringinanom districts. This happened because some of the sub-district decreased their total GDP because of many reasons
C. Factor Influence The Socio Economic Disparity In
Surabaya Region
The analysis was used to determine the factors contributing to the economic and social disparities between districts in study area by using correlation analysis techniques.
Several variables in 2008, 2009, and 2010 were chosen to become the independent variable to see the social factor which causes social disparity. This variable comes from the indicator to determine the pre-prosperous household. Most of the variable that was used in this analysis is the proxy variables from the indicator of pre-prosperous household. The dependent variable in this research for social disparity are population growth, population of children completed elementary education, density of health center per 100 km2 area, percentage of households have safe drinking water and the percentage
of households have electricity. The independent in this research are social disparity index.
The dependent variables for economic disparity in this analysis are economic disparity index from previous analysis. The dependent variable in this research for economic disparity are nine sectors in GDP among others agriculture sector, mining sectors, industrial processing sector, electricity sector, construction sectors, trade sector, transport sector, financial sector, and other sectors.
1) Factor Contributing Social Disparity in Urban
Areas
Y = 1.516 – 0.492 percentage of electricity users Based on the regression result, the percentage of electricity users is correlated with social disparity (Y). The percentage of electricity users has 0.492 values it means if there is increasing in 1 unit (1 percent of electricity users) of can decrease 0.492 values of social disparity. This variable has correlation with social disparity. Provision of adequate demand for electricity in any region can help in boosting economy and the most important thinks is the electricity is becoming the basic needs of household, business to industry. If some area cannot provide this basic needs directly will effect to lower economic growth and also lowest the social condition of the household in that area and can increase the social disparity.
2) Factor Contributing Social Disparity in Peri Urban
Area
Y = 0.406 + 3.105 health center services
Based on the regression result, the health center services have the correlation with the social disparity index (Y). The health center services has 3.105 values it means if there is increasing in 1 unit (1 unit health center for 100 km2) can increase 3.105 values of social disparity. The differences of health center will lead to social disparities in the regions. If health center services are not available in some area it will become a big problem especially for poor people. They need health center due to less transportation cost. The poor class also cannot undergo treatment from the good hospitals in their area. They need the cheap and closed health center to fulfill their health needs. Whereas, an area which has good services of the health center will be able to serve all the poor, middle or high class population in that area. The differences of health center will lead to social disparities in the regions.
3) Factor Contributing Social Disparity in Rural Area
be associated with percentage of water users. Thus clean drinking water can be a cause of social disparity.
4) Factor Contributing Economic Disparity in Urban
Areas independent variables the economy disparity index (Y) will have 0.266 values.
-Financial sector: Financial sector has the relationship with increasing the economic disparity (Y) in urban areas. Based on the model, the financial sector has 1.448E-6 value. It means if there is increasing 1 unit (1 million rupiah) value in financial sectors there will be increasing 1.448E-6 in economic disparity. -Industrial sector: The industrial sector has 3.506E-7
value it means if there is increasing in 1 unit (1 million rupiah) of industrial sector productivity can increase 3.506E-7 value of economic disparity (Y). -Electricity sector: Electricity sector has the
relationship with increasing the economic disparity (Y) in urban areas.. Based on the model, the electricity sector has 1.139E-6 value. It means if there is increasing 1 unit (1 million rupiah) value in electricity sectors there will be increasing 1.139E-6 in economic disparity.
5) Factor Contributing Economic Disparity in Peri
Urban Area
Y = 0.27+ 6.46E-07 Trade + 1.42E-06 Construction + 5.34E-07 Financial + 2.64E-07 Transportation Based on the regression result, there are several variables that have a relationship with the economy disparity index, among others:
-Trade sector: The trade sector has 6.46E-07 value it means if there is increasing in 1 unit (1 million rupiah) of trade sector productivity can increase 6.46E-07 value of economic disparity (Y).
-Construction sector: The Construction sector has 1.42E-06 value it means if there is increasing in 1 unit (1 million rupiah) of Construction sector productivity can increase 1.42E-06 value of economic disparity (Y). -Transportation sector: The transportation sector has
5.34E-07 value it means if there is increasing in 1 unit (1 million rupiah) of transportation sector productivity can increase 5.34E-07 value of economic disparity (Y). -Industrial sector: The industrial sector has 2.64E-07 value it means if there is increasing in 1 unit (1 million rupiah) of industrial sector productivity can decrease 2.64E-07 value of economic disparity (Y).
6) Factor Contributing Economic Disparity in Rural
Area million rupiah) of industrial sector productivity can increase 1.58E-06 value of economic disparity (Y).
- Agriculture sector: The agriculture sector has 4.85E -06
value it means if there is increasing in 1 unit (1 million rupiah) of agriculture sector productivity can increase 4.85E-06 value of economic disparity (Y). Mining sector: The mining sector has 4.85E-06 3.16E-06 value it means if there is increasing in 1 unit (1 million rupiah) of mining sector productivity can increase 4.85E -06
value of economic disparity (Y).
III.CONCLUSION
Urban sprawl from Surabaya city to the surrounding areas makes the typology difference. The urban characteristic in surrounding area began to appear. This condition makes the peri urban areas have urban and rural characteristics. The development of the peri urban area now becomes more advance due to the changes of social and economic aspect. The changes of social economy in peri urban area and make the disparity between urban, peri urban and rural are increasing. There are several findings obtained from this study.
Firstly, based on the cluster analysis can be seen that sub-districts which in urban, peri urban and rural typology always different in every year. Findings show that the sub-districts which include in rural area is very little compared with peri urban and urban area.
Secondly, the characteristic rural area of the analysis is an area which has an agricultural characteristic, a lot of agriculture labor, productivity, and agricultural land use. Rural areas also have lack of infrastructure and primary sector as the potential sector in this area. The peri urban area is the area which has the urban and rural characteristic. This area have agricultural and non-agricultural characteristic in one area. This area has an average level in terms of infrastructure services with the secondary sector as the potential sector in this area. The urban area is the area which has the non-agricultural characteristic. Urban area has a good infrastructure services, a lot of non-agricultural labor and less primary sector productivity due to the small area for agricultural land use.
Thirdly, from the result of the Theil Index can be seen that the social and economic disparity in rural area is very low than in urban and peri urban area. The urban and peri urban area is in the middle or high level in social and economic disparity.
Fourthly, the percentage of electricity users are affecting the social disparity in urban area, health center service distance affecting the social disparity in peri urban area and the percentage of water users effecting the social disparity in rural area. Moreover, the financial, industrial and electricity sector's production caused the economic disparity in urban areas. Trade, construction, transportation, and industrial sectors caused the economic disparity in peri urban area. Whereas, industrial, agriculture and mining sectors can cause the economic disparity in rural area.
From the finding and conclusion that have been obtained in this research, there are several policy recommendations that can be done to solve the problem in the study area, among others:
Prevent the spread effect of development from urban areas
urban and peri urban area. The urban sprawl in around Surabaya is spread unplanned. The growing of settlement is faster than the government plan. This condition makes the negative impact especially the existence of agriculture and protected areas such as catchment areas, mangrove, forest areas and many others in the study area. To prevent the spread effect of development from urban area there are several programs that should be done by government, among others:
-Create the zonation land use planning to give the protection for the agricultural land in peri urban and rural area: the government should make zonation planning to prevent the agricultural land conversion. This policy should be strictly with give the punishment to the individual or group which against this policy. Through the zonation, the government will know what the potential land use in every area is. For example, the area which has potential for agriculture will be maintained for agriculture and just several activities which does not interfere the agriculture activity can be located in this area. This regulation should be done for the future planning. How much agriculture productivity, settlement, industry and facility must be provided so they can urban area to prevent the land conversion spreading widely: Create the growth center should be done to prevent the sprawling of the area. Urban sprawl that happened in the study area is spread and led to the difficulties of government to fulfill the infrastructure for the people. A growth center in peri urban area will become the center agriculture market for the rural or peri urban productivity, the center of public facilities and settlement area. So, the government will be able to fulfill the infrastructure needs especially for settlement activity which always increase in this area. This policy also will alleviate the agricultural land conversion to become built up area.
Economic and social distribution
The economic and social distribution to alleviate the disparity can be done with several programs among others:
-Social development for the poor people: The government can give the subsidy for the poor people to get the education and health facilities so they can use this facility with the price that can be afforded by theme. This policy can select Prambon, Krembung, Bulak, Tulangan, Asemrowo, Driyorejo, Menganti, Benowo, Lakarsantri, Krian, Wiyung and Porong to become the priority target area.
-Infrastructure development with equal distribution in each typology: Based on the multivariate analysis several infrastructure sectors must be improved, among others: cannot provide this basic needs directly will affect to the lowest economic growth and it will increase the economic disparity and give the social disparity because of lack income and make them difficult to fulfill all the social needs and will affect the social condition and disparity.
oTransportation system: the condition of transportation especially road effect the efficiency of transportation. If there are some area which have a high average and poor road condition will cannot accelerate the economy growth. These occur because investment for high labor industry doesn’t want to invest in this area due to the high cost of transportation. As a result this area will suffer and the areas which have low average and poor condition of road will have a high investment and can boost their economic growth. There are several sub-districts that can improve the transportation system among others Lakarsantri, Kebomas, Sedati, Asemrowo, Gunung Anyar, Sukolilo, Dukuh Pakis, Manyar and Bulak.
-Industrial development : The production of the area gives the implication for economic disparity. The production has the high relationship with the highest investment in any sector. Government must distribute the investment base on the potential sector in each region. The high investment can be used as capital to build the industry in large, medium, or small size industry (Micro Industry). As a result, unemployment will decrease and many people have an enough income and can decrease the economic disparity. There are several areas that can become the leading industry such as Tegalsari, Tenggilis Mejoyo, Gubeng, Genteng, Bubutan, Kenjeran, Simokerto, Duduksampeyan, Wringinanom, Manyar, Jabon, Sidayu, Ujungpangkah and Panceng sub-districts.
communities to develop their agro business until in agro processing of production. Develop the road accessibility in accordance with the requirements of the road from the rice field, collector until arterial road. The zoning regulation must be consistent to reduce the high conversion of agricultural land use become built up area.
The government should develop the human resources through providing guidance on how to optimize agricultural production, the production process to increase the value added to how to market their agricultural products is very important in rural areas. If the quality of human resources is increasing, they will have the initiative to make their profit bigger, they will able to operate the advance technology to increase agricultural production and they also can sell their products with high profit. This policy can increase the agricultural sector productivity. This policy will be concentrating on sub-district which is include in rural areas especially in Duduksampeyan, Wringinanom, Manyar, Jabon, Sidayu, Ujungpangkah and Panceng sub-districts.
-Improve the services sector: The financial, real estate, business, trade, hotel, restaurant, and construction sector are very important to reduce the economic disparity. This happens because those variables can boost the economy through absorbing employment and make the economy activity growth and can make the economic disparity decreased. The financial, real estate, business sectors must be developed in Tegalsari, Tenggilis Mejoyo, Gubeng, Genteng, Bubutan, Kenjeran and Simokerto sub-districts. The trade, hotel, restaurant, and construction must develop in Lakarsantri, Kebomas, Sedati, Asemrowo, Gunung Anyar, Sukolilo, Dukuh Pakis, Manyar and Bulak.
- Improve the natural resources benefit: There are
several sub-districts that can improve the mining production to increase the income and decrease the economic disparity, among others Duduksampeyan, Wringinanom, Manyar, Jabon, Sidayu, Ujungpangkah and Panceng sub-districts.
REFERENCE
[1] Y. K. Sheng, "Poverty Allevation through Rural-Urban Linkages : Policy Implications," Economic and Social Commision for Asia and the Pacific, Bangkok, 2002.
[2] M. Rosul, "Urban Sprawl," 2008. [Online]. Available: http://mrosul,edublogs,org. [Accessed 6 October 2011].
[3] European Commission, "Urban Sprawl in Europe," European Environment Agency, Copenhagen, 2006.
[4] M. Dewi, "Spatial Planning Base on Ecology: Concept Roof Garden and Urban Farming In Improving Air Quality in Surabaya," Surabaya, Institute Technology of Sepuluh Nopember, 2006.
[5] R. a. D. I. LPMM-ITS, "Urban Sprawl Phenomena Research Proposal in Surabaya Metropolitan Area," Sepuluh Nopember Institute of Technology, Surabaya, 2007.
[6] Rachmadita, "Referrals Capital Policy Shift to Private Vehicles For City Bus Workers commute Waru Sidoarjo-Surabaya District. Surabaya," Sepuluh Nopember Institute of Technology, Surabaya, 2009.
[7] U. P. a. D. A. o. S. BAPPEKO-Surabaya, "Surabaya City Spatial Plan 2000-2013," Surabaya, 2000.
[8] S. Bakkialakshmi, P. Selvarani, S. Chenthamarai, Fluorescence quenching of Rhodamine B base by two amines, Department of Physics, Annamalai University, Annamalainagar 608 002, Tamil Nadu, India, 2013.
[9] J. Alarcon, Fiber Optic Devince For Sensing Analysis and Metode Of Making Same, GooglePatent US 7787923 B2, 2010. [10] United Nations, "Reducing Disparities: Balanced Development of
Urban and Rural Areas and Regions Within The Countries of Asia and The Pacific," United Nations, New York, 2001. [11] A. Garnier, Les Nouvelles Cités Dortoirs, Presses Politechniques
Romandes, 1984.
[12] E. Rustiadi, "Planning and Regional Developmnet in Jakarta," Yayasan Pusaka Obor Indonesia, Jakarta, 2011.
[13] BAPPEPROP-Jatim, "Reports Indicate Adaptive Synchronization Program and Budget To Reduce Spatial Disparities in the Area of East Java," Planning and Development Agency of East Java Province, Surabaya, 2011.
[14] D. Muhammad, "Gaps Between Classes in Java More Width,"
2013. [Online]. Available:
http://www.republika.co.id/berita/nasional/jawa- timur/13/01/01/mfxgdm-kesenjangan-antarkelas-di-jatim-kian-lebar. [Accessed 9 March 2013].
[15] F. A. Handayani, Gap Analysis in Gerbangkertasusila area in terms of economic, social and environmental, Surabaya : Sepuluh Nopember Institute of Technology, 2006.
[16] O. Torres-Reyna, "Getting Started in Factor Analysis (using stata 10)," Princeton University, New Jersey, 2010.
[17] J. Anglim, "Cluster Analysis and Factor Analysis," 2007. [18] L. G. Bellù, "Describing Income Inequality Theil Index and
Entropy Class Indexes," Italy, 2006.
[19] Kusmantoro, "Disparity and specialitation manufacture industry in Central Java," Univerity of Semarang, Semarang, 2007. [20] E. L. Glaeser, "Urban Inequality," NBER Working Paper Series,
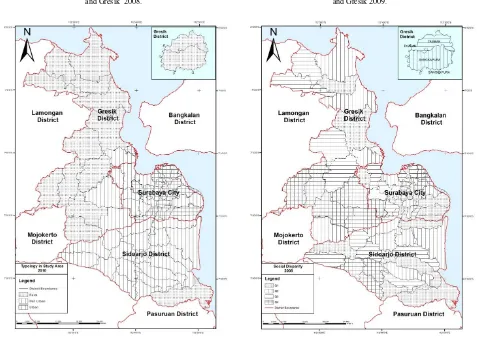
Figure 1. Typology Urban, Peri Urban and Rural in Surabaya, Sidoarjo and Gresik 2008.
Figure 2. Typology Urban, Peri Urban and Rural in Surabaya, Sidoarjo and Gresik 2009.
Figure 3. Typology Urban, Peri Urban and Rural In Surabaya, Sidoarjo and Gresik 2010.
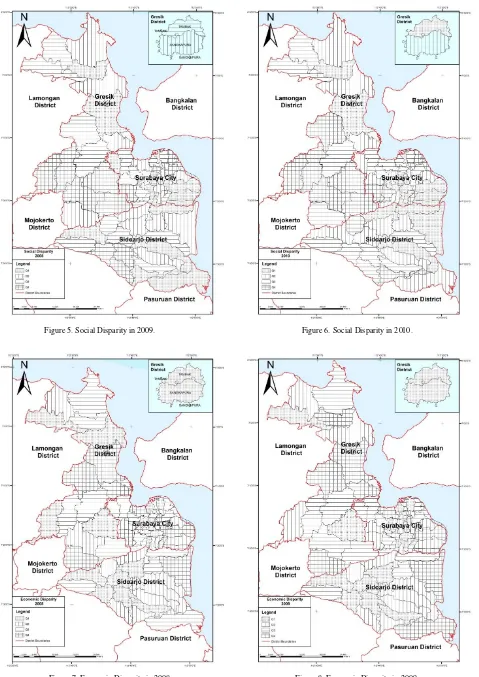
Figure 5. Social Disparity in 2009. Figure 6. Social Disparity in 2010.
Figure 9. Economic Disparity in 2010.
Figure 10. Theil index for Social Disparity in Surabaya, Sidoarjo and Gresik (2008, 2009 and 2010).
Figure 11. Theil Index for Economy Disparity in Surabaya, Sidoarjo and Gresik (2008, 2009 and 2010).
TABLE 1.
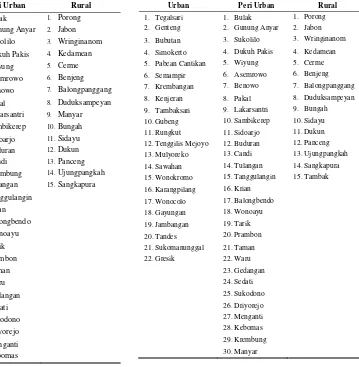
URBAN,PERI URBAN AND RURAL TYPOLOGY IN STUDY AREA IN 2008
Urban Peri Urban Rural
1. Tegalsari 1. Bulak 1. Porong
2. Genteng 2. Gunung Anyar 2. Jabon
3. Bubutan 3. Sukolilo 3. Wringinanom
4. Simokerto 4. Dukuh Pakis 4. Kedamean
5. Pabean Cantikan 5. Wiyung 5. Cerme
6. Semampir 6. Asemrowo 6. Benjeng
7. Krembangan 7. Benowo 7. Balongpanggang
8. Kenjeran 8. Pakal 8. Duduksampeyan
9. Tambaksari 9. Lakarsantri 9. Manyar
10.Gubeng 10.Sambikerep 10.Bungah
11.Rungkut 11.Sidoarjo 11.Sidayu
12.Tenggilis Mejoyo 12.Buduran 12.Dukun
13.Mulyoreko 13.Candi 13.Panceng
14.Sawahan 14.Krembung 14.Ujungpangkah
15.Wonokromo 15.Tulangan 15.Sangkapura
16.Karangpilang 16.Tanggulangin
17.Wonocolo 17.Krian
18.Gayungan 18.Balongbendo
19.Jambangan 19.Wonoayu
20.Tandes 20.Tarik
21.Sukomanunggal 21.Prambon
22.Gresik 22.Taman
23.Waru 24.Gedangan 25.Sedati 26.Sukodono 27.Driyorejo 28.Menganti 29.Kebomas
TABLE 2.
URBAN,PERI URBAN AND RURAL TYPOLOGY IN STUDY AREA IN 2009
Urban Peri Urban Rural
1. Tegalsari 1. Bulak 1. Porong 2. Genteng 2. Gunung Anyar 2. Jabon
3. Bubutan 3. Sukolilo 3. Wringinanom
4. Simokerto 4. Dukuh Pakis 4. Kedamean 5. Pabean Cantikan 5. Wiyung 5. Cerme
6. Semampir 6. Asemrowo 6. Benjeng 7. Krembangan 7. Benowo 7. Balongpanggang 8. Kenjeran 8. Pakal 8. Duduksampeyan
9. Tambaksari 9. Lakarsantri 9. Bungah 10.Gubeng 10.Sambikerep 10.Sidayu 11.Rungkut 11.Sidoarjo 11.Dukun 12.Tenggilis Mejoyo 12.Buduran 12.Panceng 13.Mulyoreko 13.Candi 13.Ujungpangkah 14.Sawahan 14.Tulangan 14.Sangkapura 15.Wonokromo 15.Tanggulangin 15.Tambak
16.Karangpilang 16.Krian 17.Wonocolo 17.Balongbendo
18.Gayungan 18.Wonoayu 19.Jambangan 19.Tarik
20.Tandes 20.Prambon 21.Sukomanunggal 21.Taman 22.Gresik 22.Waru
23.Gedangan
24.Sedati 25.Sukodono 26.Driyorejo
27.Menganti 28.Kebomas 29.Krembung 30.Manyar
0.53
0.27
0.36
0.34 0.33 0.36
0.10 0.07 0.10
0 0.2 0.4 0.6
2008 2009 2010
Urban (Theil)2 Periphery (Theil) Rural (Theil)
0.24
0.29
0.20 0.24
0.38
0.29
0.11
0.04 0.03
0 0.1 0.2 0.3 0.4
2008 2009 2010
TABEL 3.
URBAN,PERI URBAN AND RURAL TYPOLOGY IN STUDY AREA IN 2010
Urban Peri Urban Rural
1. Tegalsari 1. Bulak 1. Jabon
2. Genteng 2. Gunung Anyar 2. Wringinanom
3. Bubutan 3. Sukolilo 3. Kedamean
4. Simokerto 4. Dukuh Pakis 4. Cerme
5. Pabean Cantikan 5. Wiyung 5. Benjeng
6. Semampir 6. Asemrowo 6. Balongpanggang
7. Krembangan 7. Benowo 7. Duduksampeyan
8. Kenjeran 8. Pakal 8. Manyar
9. Tambaksari 9. Lakarsantri 9. Bungah
10.Gubeng 10.Sambikerep 10.Sidayu
11.Rungkut 11.Sidoarjo 11.Dukun
12.Tenggilis Mejoyo 12.Buduran 12.Panceng
13.Mulyoreko 13.Candi 13.Ujungpangkah
14.Sawahan 14.Porong 14.Sangkapura
15.Wonokromo 15.Krembung
16.Karangpilang 16.Tulangan
17.Wonocolo 17.Tanggulangin
18.Gayungan 18.Krian
19.Jambangan 19.Balongbendo
20.Tandes 20.Wonoayu
21.Sukomanunggal 21.Tarik
22.Gresik 22.Prambon
23.Taman 24.Waru
25.Gedangan
26.Sedati
27.Sukodono
28.Driyorejo
29.Menganti
30.Kebomas
TABLE 4.
CHARACTERISTICS OF EACH TYPOLOGY
No Variables Urban Peri Urban Rural
1 Population density per unit of area High Medium Less
2 Number of housing units per hectare
High Medium Less
3 Proportion of agricultural area Less Medium High
4 Proportion of non-agricultural area
High Medium Less
5 Distance to the city center Less Medium High
6 Road density High Medium Less
7 Number of high schools per 10.000 people
High Medium Less
8 Proportion of non-agricultural labor
High Medium Less
9 Proportion of primary sector in GDP
Less Medium High
10 Proportion of secondary and tertiary sector in GDP
High Medium Less
11 Percentage of households covered under water distribution network
High Medium Less
12 Percentage of households have electricity
High Medium Less
TABLE 3.
FACTOR CAUSE THE CHANGES OF TYPOLOGY
No Sub-District
Period Typology Change
Cause
1 Porong
2009-2010
Rural Peri urban
Decreasing percentage of primary production
2 Manyar 2008-
2009
Rural Peri urban
Increasing of population density
Increasing of housing density 2009
-2010
Peri urban Rural
Decreasing percentage of secondary and tertiary production
TABLE 4.
VARIABLES CAUSED ECONOMY DISPARITY
Urban Peri Urban Rural
Variables Value of
Relationship Variables
Value of
Relationship Variables
Value of Relationship
Financial 1.448E-6 Trade 6.46E-07 Industrial 1.58E-06
Industrial 3.506E-7 Construction 1.42E-06 Agriculture 4.85E-06
Electricity 1.139E-6 Transportation 5.34E-07 Mining 4.85E-06