THE IMPACT OF ECONOMIC GROWTH, EXPORT PERFORMANCE AND FDI TOWARDS THE NUMBER OF LABOR OF MANUFACTURING SECTOR IN
INDONESIA
THESIS
Thesis is submitted in partial fulfillment of the requirements for the Bachelor Degree from Andalas University
By :
DIANA SAFITRI 0810514019
BACHELOR DEGREE OF ECONOMICS DEPARTMENT FACULTY OF ECONOMY
ANDALAS UNIVERSITY PADANG
FACULTY OF ECONOMICS ANDALAS UNIVERSITY
LETTER OF THESIS APPROVAL
Herewith, thesis advisor of Economic Department, Faculty of Economics, Andalas University, states that :
Name : Diana Safitri Student Number : 0810514019
Degree : Bachelor of Economics
Department : Economics / International Program
Thesis Title : The Impact Of Economic Growth, Export Performance and FDI towards The Number of Labor of Manufacturing Sector in Indonesia Has already passed seminar on August, 6th 2012 based on procedures and regulations which prevail in the Faculty of Economics.
Padang, August 2012 Thesis Advisor,
Prof.Dr.H.FirwanTan,S.E.M.Ec.DEA.Ing NIP. 130 812 952
Approved by :
Head of Economics Department Head of International Program Andalas University Economics Department
Andalas University
Prof.Dr.H.Firwan Tan, S.E.M.Ec.DEA.Ing Edi Ariyanto, SE, Msi NIP. 130 812 952 NIP. 197402241999031001
I would like to state that my thesis with the title: The Impact of Economic Growth, Export Performance and FDI Towards The Number of Labor of Manufacturing Sector in Indonesia is worked by myself and there is no part of all of the posts that contain phrase, idea, or opinion from another source without giving quotation to the original author. The parts are sourced from other people’s work have included the source in accordance with the norms, ethics and rules of scientific writing. If they find a plagiarism in this thesis, I am willing to accept the sanction of revocation of academic degrees that I have got
Padang, August 2012 giver of statement
Allah is real. Whoever you are, Allah always there for you
When you are good person, Allah loves you,
Even when you are bad person, Allah still loves you because Allah knows your soul is Him and Allah has perfect eyes to look at you.
“This thesis is dedicated to my beloved Mama”
It’s really hard to put into word what I feel, since I’ve been through a very long road to graduate…
My biggest thank for My God, Allah SWT,
for Your amazing bless, Your curing love, and
for Your answer to all of my prayer and my complain.
Praise be to Allah, the God of the worlds.
And I thank to my self and her,
It’s a process and I can’t arrive to finish line without pass each of step on it… Life is surprise and I thankful for everything I did and Allah given to me…
Keep power of mind, keep power of belief then touch the sky of dream world of yours…Dream comes true… (Diana die alma)
University Alumnus Registration No:
a) Date of Birth: Pekanbaru/May,11th 1990 b) Parent’s Name: Sofyan Chaniago (Alm) and Nelly Warti c) Faculty : Economics
d) Department : Economics International e) Student No: 0810514019 f) Date of Examination : August, 6th 2012 g) Graduate Standard : Very Satisfaction h) GPA: 3.50 i) Length of Study Period: 4 years j) Parent’s Address : Perum Peputra Raya Blok N No.78 Simp.Marpoyan, pekanbaru
The Impact Of Economic Growth, Export Performance and FDI towards The Number of Labor of Manufacturing Sector in Indonesia
Thesis by : Diana Safitri
Thesis Advisor : Prof.Dr.H.Firwan Tan, S.E. M.Ec.DEA.Ing
ABSTRACT
This research is aimed to study about the impact of economic growth, export performance and FDI towards the number of labor of manufacturing sector in Indonesia after and before implementation of AFTA. The thesis analyzes the impact by using OLS (ordinary least square) of time series data from 1992-2010. In this thesis the writer uses some variables; they are the number of labor in manufacturing sector (L) as dependent variable and economic growth (GDP), export performance (EX), foreign direct investment (FDI) as independent variables. Based on the empirical results the writer found that economic growth and export performance are positive and significant to influence the number of labor in manufacturing sector. Nevertheless, foreign direct investment show negative and insignificant in order to influence the number of labor in manufacturing sector. It means that economic growth and export performance play important role towards enhance the number of labor in manufacturing sector after AFTA.
Keyword : Economic Growth, Export Performance, FDI, Labor, Trade Liberalization This thesis has been presented before the examiners in the thesis examination and succesfully passed the thesis examination on August, 6th 2012. The abstract has been approved by the advisor and the examiners :
The alumnus has registered to the Faculty of Economic of Andalas University and has obtained the Alumnus Registration Number :
CONTENTS
CHAPTER II : LITERATURE REVIEW AND PREVIOUS RESEARCH RESULTS 2.1. Literature Review...11
2.1.5. Export Performance and The Labor ...23
2.1.6. Trade Liberalization Theory ...24
CHAPTER III : RESEARCH METHODOLOGY
3.1. The Definition of Operational Variables...33
3.2. Data Source...36
3.3. Model of Analysis...36
3.4. The Understanding of Statistical Method...38
3.4.1. Goodness of Fit...38
3.4.2. Classical Assumption Test...40
CHAPTER IV: MACRO-OVERVIEW OF MANUFACTURING LABOR IN INDONESIA (1992-2010) 4.1. The Labor of Manufacturing in relation with Economic Growth...45
4.2. The Labor of Manufacturing in relation with Export Performance...52
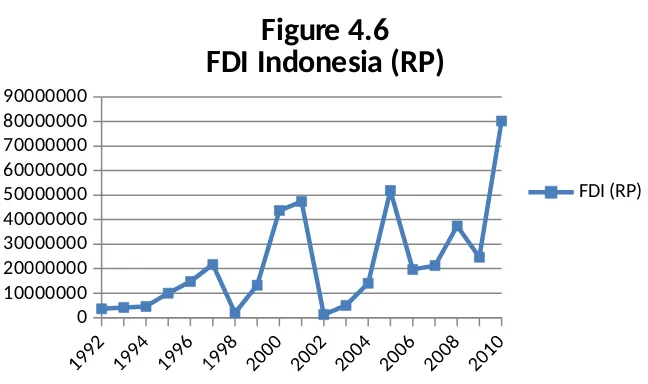
4.3. The Labor of Manufacturing in relation with FDI...56
CHAPTER V : EMPIRICAL FINDINGS AND ITS ANALYSIS 5.1. General Statistical Results…...60
5.2. The Relation between the Labor of Manufacturing with Economic Growth…...65
5.3. The Relation between the Labor of Manufacturing with Export Performance…...67
5.5. Economic Growth, Export Performance, FDI and Its Influences
Simultaneously to the Labor of Manufacturing…...70
CHAPTER VI: CONCLUSION AND RECOMMENDATION 6.1. Conclusion...72
6.2. Recommendation...73
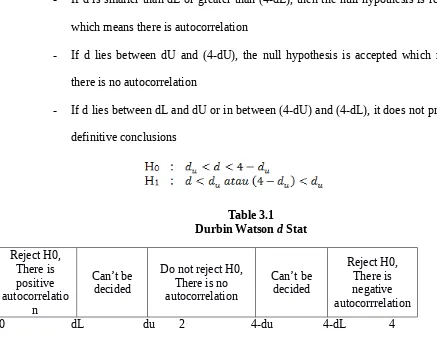
References Appendix LIST OF TABLES Table 3.1 : Durbin-Watson d Stat...43
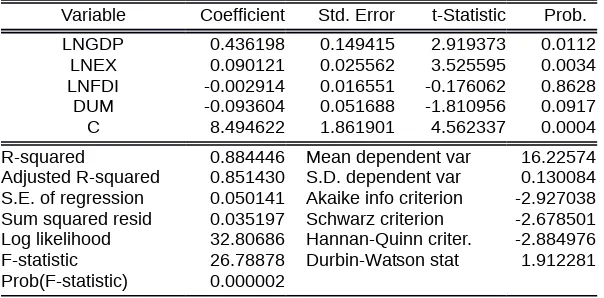
Table 5.1 : Regression of factors influencing the manufacturing labor in Indonesia...60
Table 5.2 : Correlation Matrix of Multicollinearity Result...62
Table 5.3 : Heteroscedasticity Test………...63
LIST OF FIGURES
Figure 2.1 : Solow Model...17
Figure 2.2 : Investment Curve...20
Figure 4.1 : Labor Progress...48
Figure 4.2 : Gross Domestic Product (GDP Indonesia)...50
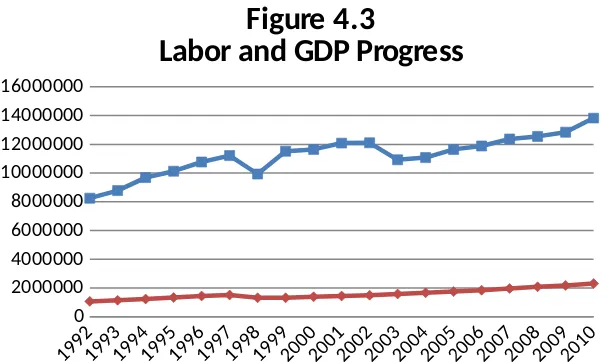
Figure 4.3 : Labor and GDP Progress...51
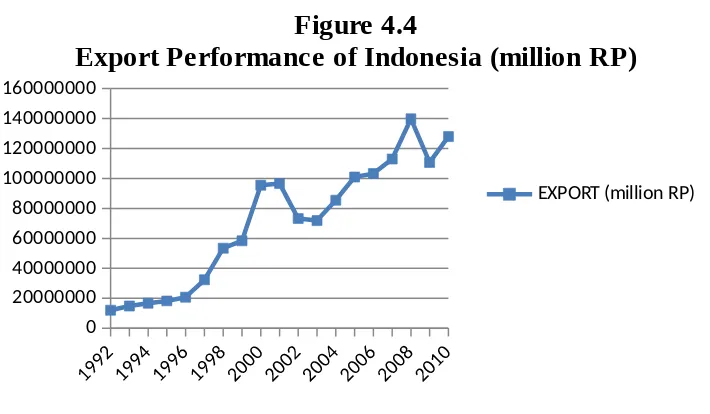
Figure 4.4 : Export Performance of Indonesia...54
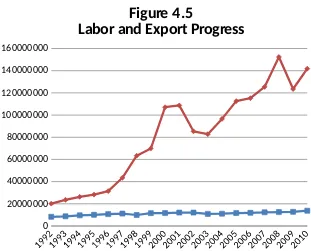
Figure 4.5 : Labor and Export Progress...55
Figure 4.6 : FDI Indonesia...57
Figure 4.7 : Labor and FDI Progress...59
Figure 5.1 : Durbin-Watson Test...64
LIST OF APPENDIX
Table 1 : Variables on Nominal Value...81
Table 2 : Data on ln Form………...82
Table 3 : Ordinary Least Square Result……….……...83
Table 4: Classical Assumption Test (Heteroscedasticity Test)…...84
Table 5: Autocorrelation Test………..…...85
Table 6 : Multicollinearity Test...85
PREFACE
All praisesdue to Allah SWT, the Most Gracious and Merciful, Lord of the world. The writer would like thank to Allah for His guidance and mercy therefore my thesis entitled “The Impact of Economic Growth, Export Performance and FDI Towards The Number of labor of Manufacturing Sector in Indonesia” has finally been accomplished on time without matter problem.This thesis is submitted as a patial requirement to acquire Bachelor Degree at Economic Department of Economic Faculty of Andalas University.
The writer realize that this thesis still far from perfection. It needs to be improved. For that reason, the writer would gladly receiveany constructive critics and suggestions from the readers in order to make the thesis better . Hopefully this thesis is able give benefit to anyone who read it, especially to academicians and students.In the process of completion, there are many people who have involved either directly or indirectly. I would like to express my gratitude to those people who made it possible for me to complete this thesis.Wit all of the humility, my infinitely gratitude I express to :
1. Allah SWT. Thank you for answering my prayers. You has given me everything so I can finish this thesis well. Praise to be Allah, the Lord of the world. Hopefully I stay in your way and keep getting better.
2. Prof.Dr.Tafdil Husni,SE.MBA. as Dean of Faculty of Economics, Andalas University 3. Prof.Dr.H.Firwan Tan, S.E. M.Ec.DEA.Ing.as Head of Economics Department and
Dra.LeliSumarni, MS.M.Si as Secretary of Economics Department who have been facilitated me from the beginning of my thesis until my final examination.
busy activities as head of economics department, seminars, answer my call and reply my text for guiding and advising my thesis. Telling me about his life experience to motivate me and stimulate my willingness to catch the top point of better life as a woman. May you always be blessed by God, healthy and a lot of luck.
5. Prof.Dr.H.Sjafrizal,SE,MAandDrs.H Masrizal,M.Soc.Scwho have been pleased as expert examiners on my thesis. Thank you for your opportunity and give some advices to my thesis.
6. Prof.Dr.Fashbir H.M Noor Sidin,MA. as my academic advisor who has been guiding, advising and supporting me even though we are only able to communicate through cell phone or email but he is like my father for me who always listening and teaching me about behave and how to improve myself.
7. Edi Ariyanto, S.E, M.Si, as Head of International Program. Thanks for your guidance during my lecture here and help me starting of my proposal until my last minutes of examination schedule.
fighting, deep in my heart I always love you, Sist and thank you so much for your sacrifice, your study dream because of brother and I are still little kid at that time. And thank you for being someone closed to me to sharing my story even my tears, Broth. You’re the only man I ever have in my life and please don’t leave me when you get married then. You’re our hero. Also thank you for my brother in law, M.Adil, SE. for being nice brother in our messy home and thank you for my little darling, NadiraSalsabilla for being an angel in our home, Bunda loves Nadira forever. Also big thank you for my big family who have been never be true family for me even when I was little girl. That’s ok. We are fine with that and I can face my world only with love from my great mom. I want you all know, little Diana never ask for your money because she was young and the only one she needs is your love but you all never gave her that.
9. Special thanks for die_alma as a great soul I have. Thank you for everything you gave and destroyed in my life. You are always with me then we can face this world together whatever will be happen.
10.My belovedkanda, Hardi Baron Diarmy, SE. Special big thanks for everything you did for me. Best brother, best partner, best friend and sometimes best ‘father’ I ever have and thank you for coming in the last minutes to pulling me up from the hell. Thank you for being someone special with your big support, your patient, your spirit, motivation and understanding especially for my freak. Thanks you for being someone who is never let me down and never let me being alone. Thank you so much for providing everything I need when I can’t handle it by myself. Wish everything will be fine in the future,Amin. 11. To my “BIE” D’Mentriez . Wish we can reach our awesome future as a real ministry. It
Priyanti, SE. “mendik” Mustika Mardhatillah, “menag”FadhillaWahyuni, SE., “menpora” Melki Tiadora. I wait for the next A.G.E.N.D.A, VN, lampu kejujuran, and other freak hobbies. For all member of Economics Int’08. I am proud to have you guys, the lovely ‘komting’ Ranofbebh, Hari-San,Yogi_rina, SUYETI group (olit, mulya, ochin, ucigw and sri), uciramadani, juju, poppy and ratih, Suci Sabily,SE. I’m gonna miss all of moments with you.Have a great luck for all of my best classmates.
12.Thanks to my ONANA GROUP (HeranofAlbasyir,SE. WahyuHidayatYusri,A.md. Erik Vanhouten,A.md.VirzaGavindaNz,S.Si. DaniOtara,A.md.YudhaPrasetya,A.md.Madril, Anton, Rozi) who have always make me laughing and be the only one princess in our community. I’m waiting for our agenda (meeting in taplau, pray together, new year trip, BL and eating together) in Padang.
13.To my senior especially kak Subrini and kakDidi. Thank for your time, support, inputs structuring my thesis. Also for my entire junior in international economic department. And thank you for my entire senior in international economic department from year 2005until 2007 (bang Ikhsan and bang Yoga for the book, bang Puja, bang Alvi, kakVike, kak Sari, kakVanie, kak Dona, kakMayang)
14.To all my friends in Economic reguler class 2008. It could be so nice to meet you guys. I found some unique characters on all of you. Thanks for the happiness that you give it to me. You are so awesome. Special thanks for ‘ntauje’ Jefri Khalid for being real good friend from beginning of ESQ until now.
16.Thank you for my economic family starting from my uda and uni in first year until my last adiak2. Thanks to bang Ade Afratama, SE for being nice brother since our first met and good luck to you. I’m still someone you ever known.
17.Thanks to all of my elementary classmates (Anes, Siti, Melisa, Vebri, Iil, IlhamAbdillah, Adha, Desy, Mimi, Yessy, Zulfikar, I wait for our next trip in Sumbar, okay!) and my senior high classmates (Dian, Helsa, Irdhie, Cici, let’s pay for our missing time!) and special thanks to Sandra Oriza for being best sister and best friend for me in every situation, may Allah bless you. Also thanks for my lovely brother Edo Rivaldo, wish you will be top football player in international.
18.To my dormitory roommate, Yeno Rizka Putri, A.md, thank you so much to understanding me and be best sister for me when I’m alone and also thanks for my roommate in the Kost, Amalia Rahayu Irdham, SE. For everything we share together whether it’s good even bad. You always care of me and pay much attention to my deadline and remind me until I did it. I love you guys!
19.Thanks to the staff of Bureau of Economics Andalas University (BukNini, Ni Nel, Buk Sam) who has helped smooth the process of my study at Economic Faculty during the years.
Final word, the author of the almighty god hope is pleased reply all good all parties whose have helped the settlement thesis. Author of open feedback and suggestions for improvement this thesis. Thesis may provide benefits for the development of this science.
Diana Safitri
CHAPTER I
INTRODUCTION
1.1. Statement of the Problem
Other symptoms developed in the liberalization and integration of world economies is the emergence of a number of regionalism. Some countries which are located in a particular region will be allied. In the context of liberalization in Southeast Asia, AFTA is one of the most popular policies among several other regional economic cooperation schemes. AFTA entered into force since January 1, 2002, especially for the first six member countries: Brunei Darussalam, Philippines, Indonesia, Malaysia, Singapore and Thailand.(Sugeng, 2003)
The word "free" in the AFTA is actually connotes the notion that the trading system "liberate" the exporters and importers from tariff and non tariff barriers on goods exported to or imported from a fellow ASEAN member countries. The purposes are to facilitate trade activities, to attract investors from within and outside the region, increasing the volume of trade across the region and foster the competitiveness of the participating countries for the sake of the world's readiness to face the free market.
Since Indonesia joined in regional trade policy and enhanced export promotion strategy, it will lead abundant factor of production in Indonesia more used to produce more output. Producing more means that the firm will open broad opportunity for labor force to enter the working area as a worker. Implementation of export promotion strategy has been brought Indonesia to attract potential industries within country to drive high growth. In this case Indonesia having manufacturing industry which is beneficial to support trading in terms of export expansion through implementation of international trade policy.
In Indonesia, as in many other developing countries, small medium industry have a crucial role to play because of their potential contributions not only to employment creation, particularly for youth and the less educated, but also to the improvement of income distribution, poverty alleviation, rural social and economic development, and the development of entrepreneurship, especially among women in rural areas. Following the emergence of the Asian financial crisis in the late 1990s, the Indonesian government revitalized the role of small medium industry by positioning these businesses as the engine for export growth of manufactured goods, either directly or indirectly through subcontracting linkages with large-scale exporting companies, including foreign companies in the country.
can only survive if they possess the capacity for internationalization. Indeed, this is a critical factor to determine the competitiveness of small medium industry in the global market (Long, 2003).
There is little doubt that international trade liberalization generates immense competitive challenges for most developing countries, including Indonesia. Since the mid-1990s, many studies have estimated the impacts of trade liberalization on economic growth, employment, poverty, income distribution and the survival of local firms. Nonetheless, the real impact of trade liberalization on the global economy remains a much debated and controversial subject. Theoretically, at an aggregate level, the broad benefits that are generated from international trade reform include the following: improved resource allocation; access to new and better technologies, inputs and intermediate goods; economies of scale and scope; greater domestic competition; and the availability of favorable growth externalities, such as the transfer of know-how (Falvey & Kim, 1992).
International trade policy reform works by inducing substitution effects in the production and consumption of goods and services through changes in price. These factors in turn influence the level and composition of exports and imports. The change of relative price induced by international trade liberalization causes a more efficient reallocation of resources. Moreover, international trade liberalization also enables the expansion of economic opportunities by enlarging markets and enhancing knowledge spillover.
study also argues that Indonesian imports from other ASEAN countries would increase, while ASEAN market diversification of Indonesian exports would decline.
On the other hand, in the common sense we already knew that product of Indonesia still less-compete compared to other product in terms of low quality for international trade because of lack of technology, innovation and most of export product from Indonesia in the form of small manufactured goods such as garment, textile, footwear and plywood. Under that, then we recognized something to bring new era for trading climate of Indonesia. We should observe an opportunity in order to helped domestic manufacturing activity from abroad.
According to United Nation (2003), Investment and trade liberalization have provided greater freedom to transnational corporations to organize their production activities across borders in accordance with their own corporate strategies and the competitive advantages of host-countries. Countries today view inward foreign direct investment as an important means of integrating their economies with international markets and expect it to contribute to their economic development. Nonetheless, openness alone is not always sufficient for the expected benefits to materialize. In order to narrow the gap between the objectives of host countries and transnational corporations, governments use a variety of policy measures.
International trade policy is assumed to give better impact to the domestic market since Indonesia implemented new export expansion policy which gives the advantage on manufacturing sector as well as the number of labor forces in this sector.
has been conducted in order to analyze this functional relationship. These are reasons why do I choose to develop my thesis entitled:
“The Impact of Economic Growth, Export Performance and FDI towards the Number of Labor of Manufacturing Sector in Indonesia”
Based on the statement of the problem has been set above, we can concluded the main problem that should be studied and defined as follow:
a. What is the relationship between economic growth and the number of labor of manufacturing industry in Indonesia?
b. What is the relationship between export performance and the number of labor of manufacturing industry in Indonesia?
c. What is the relationship between foreign direct investment and the number of labor of manufacturing industry in Indonesia?
1.3. Research Objectives
This research will be focused by the following objectives:
a. To examine and analyze the relationship between economic growth and the number of labor of manufacturing in Indonesia.
b. To examine and analyze the relationship between export performance and the number of labor of manufacturing in Indonesia.
c. To examine and analyze the relationship between foreign direct investment and the number of labor of manufacturing in Indonesia.
1.4. Hypothesis
Based on the definition of the problem and research objectives above, it can be hypothesized as follows:
1. The economic growth is considered positively to stimulate the increasing of labor number working in manufacturing industry.
3. The foreign direct investment is considered positively to affects the number of labor working in manufacturing industry.
1.5. The Scope of Research
Data which is used in this research is secondary data. Specifically, writer used time series data and Ordinary Least Square method. Data is taken in Central Bureau Statistic from 1992-2010. The data contains of; labor data by using total of manufacturing labor as measurement. The economic growth data by using real gross domestic product as measurement, since this data is an economic growth indicators. Export performance data is taken from total export of non-oil and gas especially for manufactured goods. Last, for investment data, writer use foreign direct investment.
1.6. Research Advantages
The results of this research are expected to provide advantages for:
a. Academicians and policymaker, it is expected to know the effectiveness of international trade policy in as an effort to increase the number of labor especially in manufacturing sector in Indonesia.
b. Future research to those who are interested in this field.
c. Fulfilling requirements of Sarjana Ekonomi degree of Economics in Economic Faculty, Andalas University.
1.7. Thesis Structure
Writing this thesis is divided into six chapters with each chapter details are the following: Chapter I : Introduction
Chapter IV : Macro-Overview of Manufacturing Labor in Indonesia Chapter V : Empirical Findings and Its Analysis
Chapter VI : Conclusion and Recommendation 1.8. Analysis Framework
CHAPTER II
LITERATURE REVIEW AND PREVIOUS RESEARCH RESULTS 2.1 Literature Review
2.1.1 International Trade Theory
Countries engage in international trade for two basic reasons, they are different from each other in terms of climate, land, capital, labor, technology and they are try to achieve scale economies in production. The first reason can be explained by theory of Comparative Advantage. Comparative Advantage state that trade allows a more efficient use of the economy’s resources by enabling imports of goods and services that could only be produced at home at higher resource costs. It means that a country should produce a good which has lower opportunity cost. The Ricardian Model explains the welfare gains if country specializes in producing goods which has a comparative advantage. The Ricardian model is based on technological differences among countries. These technological differences are reflected in differences in the productivity of labor with assumption labor is the only factor of production.
Heckscher-Ohlin model, how does international trade determine economic growth in the long run and bring effect to the unemployment. (Salvatore, 2004)
2.1.2 The Economic Theory of Employment 2.1.2.1 Okun’s Law
Typically, growth slowdowns coincide with rising unemployment. This negative correlation between GDP growth and unemployment has been named Okun’s law, after the economist Arthur Okun who first documented it in the early 1960s. Part of the enduring appeal of Okun’s law is its simplicity, since it involves two important macroeconomic variables. Additionally, the relationship appears to enjoy empirical support. In reality, though, Okun’s law is a statistical relationship rather than a structural feature of the economy. As with any statistical relationship, it may be subject to revisions in an ever-changing macro economy.
Okun’s two relationships arise from the observation that more labor is typically required to produce more goods and services within an economy. More labor can come through a variety of forms, such as having employees work longer hours or hiring more workers. To simplify the analysis, Okun assumed that the unemployment rate can serve as a useful summary of the amount of labor being used in the economy. (Knotek, 2007)
associated with a falling unemployment rate, and slow or negative output growth is associated with a rising unemployment rate. The ratio of -a/b gives the rate of output growth consistent with a stable unemployment rate, or how quickly the economy would typically need to grow to maintain a given level of unemployment.
The gap version. While Okun’s first relationship relied on readily accessible macroeconomic statistics, his second relationship connected the level of unemployment to the gap between potential output and actual output. In potential output, Okun sought to identify how much the economy would produce under conditions of full employment.
In full employment, Okun considered what he believed to be an unemployment level low enough to produce as much as possible without generating too much inflationary pressure. A high rate of unemployment, Okun reasoned, would typically be associated with idle resources. In such a circumstance, one would expect the actual rate of output to be below its potential. A very low rate of unemployment would be associated with the reverse scenario. Thus Okun’s second relationship, or the gap version of Okun’s law, took the form: Unemployment rate = c + d *(Gap between potential output and actual output). The variable c can be interpreted as the unemployment rate associated with full employment. The coefficient d would be positive to conform to the intuition above.
2.1.2.2 Shapirio-Stiglitz model of Efficiency Wage
efforts. The profit-maximizing firm would set the efficiency wage at the level that makes workers indifferent between exerting efforts and shirking. From the worker’s viewpoint, exerting effort guarantees less probability of being unemployed, but it gives disutility of working. Shirking on the other hand gives the highest current utility, but it involves a larger probability of being unemployed (if caught) in the next periods. Assuming exogenous rate of detection, job end and new hiring, we can find the equilibrium unemployment at the level such that the amount of new hiring equals to newly unemployed. (Amornthum, 2004)
The model set up can be as follow (Wincenciak, 2007):
Assume there are L´ (total labor supply is fixed) identical workers, all of whom dislike putting
forth effort, but enjoy consuming goods. The workers lifetime utility is:
∫
t=0
∞
e−ρtu
(t)dt , ρ=0(1)
where u(t) is instantaneous utility at time t, and ρ is the discount rate. The instantaneous utility is defined as:
u(t)=
{
w(t)−e(t)if employed0if unemployed (2)
Wages are denoted by w and e denotes workers effort. There are only two possible values for e: workers may choose to shirk, then e = 0, or to provide some fixed positive level of effort,
´
e>0 . At any moment in time, a worker may be in one of three states:
◮ employed and exerting effort (E)
◮ employed and shirking (S)
◮ unemployed (U)
Assume that with probability b per unit of time, jobs naturally end, due to reallocation,
P(t)=e−b(t−t0)
, b>0(3)
Equation (3) states that P(t+τ) P(t) =e
−bτ
which is independent of t. It implies that it doesn’t
matter for how long the worker worked on the job.
The only choice workers make is the selection of an effort level, which is discrete by assumption. If a worker chooses to exert some positive level of effort ( e´ ), he receives the wage (w) and retains the job, until exogenous factor cause a separation to occur (with probability b per unit of time). If a worker decides to shirk, there is some probability q per unit of time that he will be caught. The probability that a shirking worker is still employed at time τ later is equal
to e−qτ (prob. that he was not caught shirking) times e−bτ (prob. that the job did not end
naturally).
2.1.3 Economic Growth Theory
2.1.3.1 The Neoclassical Growth Model
The notion of growth as increased stocks of capital goods (means of production) was codified as the Solow-Swan Growth Model, which involved a series of equations which showed the relationship between labor-time, capital goods, output, and investment. According to this view, the role of technological change became crucial, even more important than the accumulation of capital. This model, developed by Robert Solow and Trevor Swan in the 1950s, was the first attempt to model long-run growth analytically. This model assumes that countries use their resources efficiently and that there are diminishing returns to capital and labor increases. From these two premises, the neoclassical model makes three important predictions. First, increasing capital relative to labor creates economic growth, since people can be more productive given more capital. Second, poor countries with less capital per person will grow faster because each investment in capital will produce a higher return than rich countries with ample capital. Third, because of diminishing returns to capital, economies will eventually reach a point at which any increase in capital will no longer create economic growth. This point is called a "steady state".
Solow Model: The "I" on hash mark represents equilibrium income, the "S" represents equilibrium Saving. I-S=C, or consumption. N = growth in labor, G = growth in technology, and δ = depreciation.
Source : Romer, David. Advanced Macroeconomics. p9-17
The model assumes that GDP is produced according to an aggregate production function technology. It is worth flagging that most of the key results for Solow's model can be obtained using any of the standard production functions in microeconomic production theory. However, for concreteness, it will be specific and limit to the case in which the production function takes the Cobb-Douglas form:
Yt=AtKt α
Lt
1−α
0<α<1(1)
Where Kt is capital input and Lt is labor input. Note that an increase in At results in higher output without having to raise inputs. Macroeconomists tend to call increases in
At ”technological progress" and we will loosely refer to this as the “technology" term, but
increases the productiveness of the other factors, it is also sometimes known as Total Factor Productivity (TFP).
In addition to the production function, the model has four other equations. (Whelan, 2005)
Capital accumulates according to
´
Kt=Yt−Ct−δ Kt(2)
In other words, the addition to the capital stock each period depends positively on savings (this is a closed-economy model so savings equals investment) and negatively on depreciation, which is assumed to take place at rate δ.
Labor input grows at rate η:
´
Lt
Lt=η(3)
Technological progress grows at rate g:
´
At
At=g(4)
A fraction s of output is saved each period.
Yt−Ct=sYt(5)
2.1.4 Investment Theory
interest below its natural level, which makes genuine saving fall and forced saving and investment increase, hence causing an unsustainable boom that is invariably followed by a bust. The artificial low rate of interest eventually gives way to a high real rate of interest as overcommitted investors bid for increasingly scarce resources. During the boom period workers are increasingly employed in the earlier stages of production while in the bust phase they are released from failing enterprises and unemployment goes up. It is clear that the theory implies a positive relationship between investment and employment. (Smith and Zoega, 2009)
2.1.4.1 Keynesian Theory of Investment
The Keynesian theory of investment places emphasis on the importance of interest rates in investment decisions. But other factors also enter into the model - not least the expected profitability of an investment project. Changes in interest rates should have an effect on the level of planned investment undertaken by private sector businesses in the economy. A fall in interest rates should decrease the cost of investment relative to the potential yield and as result planned capital investment projects on the margin may become worthwhile. A firm will only invest if the discounted yield exceeds the cost of the project. The inverse relationship between investment and the rate of interest can be shown in a figure 2.2. The relationship between the two variables is represented by the marginal efficiency of capital investment (MEC) curve. A fall in the rate of interest from R1 to R2 causes an expansion of planned investment.
The Simple Keynesian Model, which is also known as the Keynesian Cross, emphasizes one basic point. That point is that a decrease in aggregate demand can lead to a stable equilibrium with substantial unemployment. The Simple Keynesian Model application first explains the roles of consumption and investment and then explains the accounting identity;
Y = C + I + G
Y is the national income, C is consumption spending, G is government spending, I is an overall data gross domestic investment including investment by both private (domestic and foreign investment) and by the government. Together, these elements determine the equilibrium level of output. The policy analysis experiments study the effects of animal spirits and fiscal policy. The numerical results illustrate the calculation of a fiscal policy multiplier. A concluding experiment extends the model to make investment a function of the interest rate. Graphing the shifts in investment caused by changes in interest rates then reveals a simple version of the IS curve found in an IS/LM analysis.
2.1.4.2 Theory of Foreign Direct Investment
world exports. Thus, sales of foreign affiliates are now greater than world total exports of goods, implying that firms use FDI more than they use exports to service foreign markets. Moreover, FDI inward flows represented in 1998 11% of Gross Fixed Capital Formation (UNCTAD (2000)) revealing the importance that these flows can have for economic growth.
The traditional theory of FDI tries to explain why firms produce abroad instead of simply servicing the markets via exports. After all, multinational companies (MNCs) experience additional costs in producing abroad: higher costs in placing personnel abroad, communication costs (international phone calls, travel expenses for executives or even time costs due to mail delays), language and cultural differences, informational costs on local tax laws and regulations, costs of being outside domestic networks; they also incur higher risks, such as the risks of exchange rate changes or even of expropriation by the host country.
The OLI framework, introduced by Dunning (1977, 1981), considers FDI as determined by Ownership, Location and Internalization advantages which the MNC holds over the foreign producer; when these advantages outweigh the above costs, FDI arises. The ownership advantage includes a product or a production process to which other firms do not have access, such as a patent, blueprint or trade secret, to more intangible advantages such as reputation for quality. The location advantage stems directly from the foreign market, such as low factor prices or customer access, together with trade barriers or transport costs that make FDI more profitable than exporting. Finally, the internalization advantage is a more abstract concept to explain why licensing may not be practiced; it derives from the firm’s interest in maintaining its knowledge assets (such as highly skilled workers who know the firm’s technology) internally
Helpman and Krugman (1985) – exponents of the early literature - derive the activity of MNCs when they try to explain intra-firm trade, that is, an additional component of international trade. The models are based on two main assumptions: (1) there is product differentiation and economies of scale, and (2) there are some firm inputs that behave like public goods. Moreover, it is assumed that transport costs are zero and the MNCs will split their production process between a headquarter activity, often skill or capital-intensive, and the plant production abroad
Investment is one of important elements of development economy. The literature analyses positive and negative potential effects of FDI inflows on employment. The form of FDI matters in assessing the employment effect of FDI inflows (Jenkins, 2006). If FDI is in the form of greenfield FDI, then it may have a significant positive impact on employment. On the other hand, brownfield FDI involves mergers and acquisitions (M&As) and is not prone to creating new employment. Inflows of FDI might increase employment among local firms in the host country through establishing backward or forward linkages with domestic industries. However, there may exist few or limited linkages to the domestic economy since transnational corporations (TNCs) generally use their international suppliers rather than the domestic firms for most inputs.
2.1.5 Export Performance and The labor
resources and draw them into economic activity for export production resulting in an awakening of domestic resources through the creation of new wants that make people work harder and produce more products for export (Nurkse, 1961).
International trade overcomes the narrowness of the home market and provides an outlet for the surplus product over and above domestic requirements. Myint (1958) argues that the vent-for-surplus approach is much more plausible in explaining the beginnings of trade, while the comparative advantage theory explains the type of goods traded.
2.1.6 Trade Liberalization Theory
The classical trade theory based on Heckscher-Ohlin theorem argues that trade openness will increase employment in developing countries since they are labor-abundant. Since the classical trade theory rests on the unrealistic assumptions such as perfect competition and full-employment, the new trade theory introduce labor market imperfections into its theoretical models. There exists a growing literature on the theoretical relationship between international trade and employment. Although these new models of international trade emphasize that there exists a significant theoretical relationship between trade openness and unemployment, the sign of the net impact of trade on employment varies in different theoretical frameworks.
and exporting goods production. Instead, each country will import certain goods if the country has a production factor is relatively rare and expensive in its production (Salvatore, 2004)
According to Akcoraoglu and Acigkoz (2011), the relationship between trade liberalization and employment can be shown in this equation below:
EMPt = b0 + b1 RYt + b2 RWt + b3 t + b4 XYt + b4 MYt + b5 FDIYt + ut
Where bi denotes model coefficients with i = 0,1,…,5. EMPt, RYt, RWt, XYt, MYt and FDIYt represent the (natural) logarithms of employment, real GDP, real wages, ratio of exports to GDP, ratio of imports to GDP and ratio of FDI to GDP, respectively. The ut and t represent a random error term and a time trend, respectively. The time trend in the equation represents the technological progress.
2.2 Previous Research Results
Romer (1990) has been shown that growth caused the inter-sector change, a change occurred within the sector structure of the economy. This change brought structural unemployment. Technological innovation changed the modes of production. Laborers are unemployed when new technological innovations are introduced. The structural change destroyed job in one firm and created in another. High job turnover is the consequence of new techniques of production. Faster economic growth will create job destruction through skills obsolescence and new machines. Unemployment becomes consistent and critical matter.
Revenga (1992) concluded that higher import competition led to lower employment over the period from 1977 to 1987 using a panel of U.S. manufacturing firms.
Several authors have estimated employment elasticity (a measure of the relationship between employment and economic growth) for a variety of nations. Boltho and Glyn (1995) found elasticity of employment with respect to output growth in the order of 0.5 to 0.6 for a set of OECD countries. An International Labor Organization Report concluded that the responsiveness of employment growth to GDP growth has not declined in industrialized countries as a whole. However, a country-by-country analysis revealed mixed results with little relationship found in Germany, Italy and the UK in the 1990s, thus implying a jobless recovery.
Caves (1996) considered that the efforts made by various countries in attracting foreign direct investments are due to the potential positive effects that this would have on economy. FDI would increase productivity, technology transfer, managerial skills, knowhow, international production networks, reducing unemployment, and access to external markets.
Among the G7 countries studied (Canada was excluded), a positive and significant relationship between growth in value added and employment was found only in Germany and the US.
Padalino and Vivarelli (1997) found significant differences in employment elasticity between different countries, with an elasticity of approximately 0.5 for the United States and Canada while elasticity for Japan, France, Germany, Italy and the UK were close to zero.
Pini (1997) estimated that the employment elasticity in Germany and Japan rose between the period 1979-1995 compared to 1960-1979 while it declined in France and Sweden and showed little change in Italy, UK and US. He also detected negative employment elasticity in Italy and Sweden for the period 1990-95.
Wood (1997) reviewed the conventional wisdom that export-oriented industrialization in East Asia promoted distributional equity. In this view trade allows the expansion of sectors that use the abundant factor of production intensively. The abundant factor in the 1970s and 1980s in many East Asia countries was low-skilled labor, and hence trade should have raised the demand for low-skilled labor. Wood argued that this has probably happened.
Revenga (1997) provided a comprehensive survey of the effect of trade liberalization on employment and wage for Mexico employing the OLS method and found that trade liberalization shift down industry product and labor demand particularly at firm level employment.
production (and employment) growth basically depends on the sum of export and domestic demand growth.
Greenway, Morgan and Wright (1998) found that between 1979 and 1991, when industry in the United Kingdom of Great Britain and Northern Ireland had been integrated into the international economy through foreign direct investment (FDI) and trade, there were large-scale job losses in the manufacturing sector in the United Kingdom. They found that when United Kingdom trade volume increased, demand for labor decreased in the manufacturing sector because trade liberalization generated competition and a requirement for highly-skilled labor in delivering high output. However, this job loss situation was equalized by an increase in financial services as well as primary and extractive employment.
Some empirical studies concluded that trade openness has a negative impact on employment. Milner and Wright (1998) found that trade liberalization led to significant unemployment in case of import and export industries in Mauritius.
Walterskirchen (1999) found employment elasticity for the EU of 0.65 when employing a cross-country analysis of EU countries from 1988-98. Using data from 1970-98 for 7 countries plus the EU as a whole, employment elasticity ranged from 0.24 for Austria to 0.76 for Spain (the elasticity for the US was 0.53). The result indicated that there is still a strong and positive correlation between GDP growth and the change in employment.
Azhar (2001) has analyzed the impact of trade policy regime on FDI contribution to growth of economy over the period of 1970 to 2001. The study found that the growth impact of FDI tends to be greater under an export promotion trade regime compared to an import-substitution regime. In short, these finding suggest that Pakistan’s capacity to progress on economic development will depend on her performance in attracting FDI.
Lipsey (2002) concluded that there are positive effects, but there is not a consistent relationship between FDI stock and economic growth. The potential positive or negative effects on the economy may also depend on the nature of the sector in which investment takes place.
Orbeta (2002) studied the impact of globalization on employment level and structure in Philippines using OLS method. He concluded that increases in the propensity to export shifts the demand for labor upward. For the employment level, increases in export propensity increase the proportion of low-skilled production workers both at the aggregate and manufacturing sub-industries level. In terms of employment structure, the impact of openness on the proportion of women workers is not significant in the aggregate but at the manufacturing sub-industry level, the increase in the propensity to export is a boon for women workers. The result validates the hypothesis for developing countries that increase in exports expands the demand for workers with basic skills.
Palma (2003) provided detailed empirical assessment of the effects of growth of manufactured trade, induced by trade liberalization, on manufacturing employment and wages in Mexico. It resulted declining in employment and wages for low-skilled labor, weakening of the wage-productivity linkage and growth of wage inequality.
also point out that between 2000 and 2002, employment in foreign firms decreased with the shift of FDI from low-value added sectors to medium-tech sectors.
Fu and Balasubramanyam (2005) found a positive and significant impact of exports on employment in China. By using a panel data set for township and village enterprises (TVEs) in 29 provinces in China over 1987-1998, they suggested that a 1 per cent increase in export volume would raise employment by 0.17 per cent.
Axarloglou and Pournarakis (2007) analyzed the effects of FDI inflows on local employment in manufacturing across a sample of states in the United States for the period of 1974-1994. They found that the effects change from one industry to another. While FDI inflows have positive employment effects for a subgroup of industries such as printing & publishing and transportation equipment & instruments, negative effects have been found for another subgroup of industries such as leather &stone, clay and glass.
In the literature, employment effect of FDI in the investment receiving country has been contentious. The debates signal that those effects can change from one country to another depending on the country-specific features and the form of investment. It has been generally accepted that positive employment effects would be higher if the investment takes the form of greenfield investment. On the other hand, if foreign capital comes via M&As and buys privatized enterprises foreign investment will have a limited, even negative effect on the employment level (Vergil and Ayaş 2009).
Said and Elshennawy (2010) report that employment has increased in the manufacturing industries in the case of Egypt over the period 1993- 2006 despite increasing import penetration.
Hasan, Baharom and Azis (2010), examined the effects of export changes on the output and employment in the manufacturing sector. This study analyzed which country among ASEAN 4, namely Indonesia, Philippines, Thailand and Singapore is the most important destination of Malaysian manufacturing exports. The period of study covers the time period 2000-2004. This study concluded that trade changes do have an impact on output and employment. In this study, an increase in export for five years period to ASEAN 4 countries affect the output and employment generation positively. Output and employment generated have moved in the same direction with increases in export.
CHAPTER III
Definition of The labor
The labor means that people who is employed. In this study, labor is focused on people who are employed in manufacturing industry. In Indonesia, most of labor is employed in manufacturing are low-skilled labor which uses traditional technology to produce manufactured goods.
This study uses data for the labor is total labor of manufacturing industry in Indonesia per year.
Definition of Economic Growth
Economic growth is characterized by an increase in the total output of an economy. It occurs when a society acquires new resources or when society learns to produce more with existing resources. New resources may mean a larger labor forces or an increased capital stock. The production and the use of new machinery and equipment (capital), increases workers’ productivity. Improved productivity also comes from technological change and innovation, the discovery and application of new, efficient production techniques. (Case and Fair, 2003)
This study uses data for the economic growth is total real GDP per year in Indonesia. Definition of Export Performance
Export performance is measured as actual growth in exports relative to the growth of the country’s export market, which represents the potential export growth for a country assuming that its market shares remain unchanged. In this study we focus on total export of manufactured goods.
Definition of Foreign Direct Investment
facilities, access to new technology, products, skills and financing. For a host country or the foreign firm which receives the investment, it can provide a source of new technologies, capital, processes, products, organizational technologies and management skills, and as such can provide a strong impetus to economic development. Foreign direct investment, in its classic definition, is defined as a company from one country making a physical investment into building a factory in another country. The direct investment in buildings, machinery and equipment is in contrast with making a portfolio investment, which is considered an indirect investment. (www.doc.gov-U.S Department of Commerce)
For small and medium sized companies, FDI represents an opportunity to become more actively involved in international business activities. In the past 15 years, the classic definition of FDI as noted above has changed considerably. This notion of a change in the classic definition, however, must be kept in the proper context. Very clearly, over 2/3 of direct foreign investment is still made in the form of fixtures, machinery, equipment and buildings. Moreover, larger multinational corporations and conglomerates still make the overwhelming percentage of FDI. But, with the advent of the Internet, the increasing role of technology, loosening of direct investment restrictions in many markets and decreasing communication costs means that newer, non-traditional forms of investment will play an important role in the future.
This study uses data for foreign direct investment (growth of fixed capital formation in Indonesia)
Definition of Dummy Variables
the response of the regressand to the variation in the qualitative variables in the various subgroups, they will be reflected in the differences in the intercepts or slope coefficients or both of the various subgroup regressions. (Gujarati, 2003)
Since such variables usually indicate the presence or absence of a “quality” or an attribute, such male or female, black or white, democrat or republican, they are essentially nominal scale variables. One way we could “quantify” such attributes is by constructing artificial variables that take on values of 1 or 0, I indicating the presence (or possession) of that attribute and 0 indicating the absence of that attribute. In this study, dummy variables used are dummy variables for Indonesia’s international trade policy, namely DUM which “1” indicates after AFTA implementation for 2002-2010 and “0” before AFTA implementation for 1992-2001.
3.2 Data Sources
This research using secondary data as based on estimation. Secondary data is used because those data is available in several online sources, several books even journals. Source of data is very important while doing research because data can help researcher to find correlation among variables which were researched. The data taken by the author in this research is derived from the Central Bureau of Statistics. Year of data is data for 1992 until 2010.
The data used in this research consists of:
a. Total labor of manufacturing industry in Indonesia per year b. Real GDP in Indonesia per year
d. Foreign direct investment (growth of fixed capital formation in Indonesia) 3.3 Model of Analysis
The main purpose of the study is to assess the linkages of factors are affected by international trade policy within trade liberalization atmosphere such as economic growth, export performance and foreign direct investment towards the labor in Indonesia. The time period for this paper is 1992-2010. The theoretical model that used to investigate the interaction of GDP, export, FDI and the labor is based on the following production function:
Yt=AtKt α1
Lt α2
0<α<1
Where Y is the output, K is capital and L is labor and A is the technology or the efficiency of production.
In this study we have relationship between GDP, export, FDI and the labor are formulated based on production function set above as:
Y=f(X❑1
In empirical test about the relationship between the labor, GDP, export and FDI use multiple linear transformation and the transformation of the double log as based on Akcoraoglu and Acikgoz (2011) in the literature review, the model of this research is:
lnLt=α0+α1lnGDPt+α2lnEXt+α3lnFDIt+α4DUM Where,
GDPt : Real Gross Domestic Product per year
EXt : Export of non oil and gas (manufactured goods) per year
FDIt : Foreign Direct Investment per year
DUM :Dummy variables, equal to “1” means after implementation of AFTA and “0” before implementation of AFTA
α1 , α2 , α3 , α4 : Regression Coefficient
α0 :Constanta
t : years
The study by Akcoraoglu and Acikgoz (2011) found that estimations indicate a positive and significant empirical relationship between exports and employment in the long run. The empirical findings also show that the impact of FDI flows on employment is negative and significant in the long run. One of the main reasons behind this empirical result is that the majority of FDI flows are in the form of foreign acquisitions and mergers rather than greenfield investment.
3.4 The Understanding of Statistical Method
The approach that used to this research is a multiple linear regression analysis using Ordinary Least Square (OLS). In the process of testing model the equation in this research used program E-views 6.
3.4.1 Goodness of Fit
Goodness of fit of the fitted regression line fits the data; that is we shall find out how “well” the sample regression line fits the data (Gujarati, 2003). In determination whether the model used is good or not, there are several criteria for statistical testing of the coefficient of determination or R-Sq, F-test and t-test.
Coefficient of Determination/ R-Square (R2 )
The overall goodness of fit of the regression model is measured by the coefficient of determination, r2. It tells what proportion of the variation in dependent variable, or regressand is explained by the explanatory variable or regressor. This coefficient lies between 0 and 1; the closer it is to 1, the better is the fit. (Gujarati, 2003) Or we can say R-squared is the squared of the correlation coefficient between the dependent variable and the estimate of it produced by the regressors or equivalently defined as the ratio of regression variance of total variance.
F-test
F-test is used to see whether the explanatory variables simultaneously gave a significant effect or no effect on the dependent variable. First step is creates hypothesis:
Ha = independent variable significantly affect to the dependent variable
F−test= R
2
/(k−1) (1−R2
)/(n−k)
R2 = determination coefficient K = independent variable n = total sample
F-table = [α; df1 = (k-1); df2 = (n-k-1)]
If F-test > F-table, H0 is rejected and accept Ha, it means that all of independent variables significantly affect dependent variable.
T-test
T-test is used to see whether the independent variables individually significant or no effect on the dependent variable. The hypothesis are:
H0: β = 0, means that coefficient of dependent does not have significant effect with independent variable
Ha: β ≠ 0, means that coefficient of dependent have significant effect with independent variable.
T−test= ^βj
SE(^βj)
T−table=
{
α ;df=(n−k)}
If T-test > t-table, it means Ho is rejected. It means that each independent variable significantly affect dependent variable.
A multiple regression equation testing the assumption is needed to see whether the regression model was created could be used. Regression model obtained from ordinary least square method is the OLS regression model that produces linear unbiased estimator of the best (best linear unbiased estimator/ BLUE). This condition occurs when filled several assumptions called assumption-free classics including multicollinearity, heterocedasticity and autocorrelation.
Multicollinearity Test
The term multicollinearity is due to Ragnar Frisch (1934). Originally it meant the existence of a ‘perfect’ or exact linear relationship among some or all explanatory variables of a regression model. There are two reason multicollinearity occurs in regression model they are because of error theory in regression function formation and because of total observations that will be analyzing in regression model are too small.
There are several methods to examine the multicollinearity such as (Winarno, 2009): - Using variance inflation factor (VIF), if the value of VIF < 10 so there is no
problem with multicollinearity
- Using correlation coefficient, if value of correlation coefficient among each independent variables are less than 0.89 so the model is free from multicollinearity or no problem with multicollinearity.
- Using coefficient of determination, if value of determination coefficient whether R2 or R-square is greater than 0.60 but there is no independent variable affecting dependent variable, it means that model has multicollinearity problem.
Heterocedasticity means that if the OLS assumption that the variance of the error term is constant for all values of the independent variables does not hold. This leads to biased and inefficient (i.e., larger than minimum variance) estimates of the standard errors (and thus, incorrect statistical tests and confidence intervals). A good regression model is regression model which has the same of residual variance in one analyzing period to another analyzing period or we can say that there is a relationship between value predicted with its studentized delete residual value.
The way to predict the presence or the absence of heterocedasticity can be seen from the White’s test. If the probability value of Chi-Square on White’s test results without cross terms greater α = 5%, it can be said that the model equation is not affected by regression heterocedasticity. (Winarno, 2009). There are several testing methods can be used such as the Park test, Test Glesjer, seeing patterns regression graphics and Spearman Correlation Coefficient test.
Autocorrelation Test
The term autocorrelation may be defined as ‘correlation between members of series of observations ordered in time (as in time series data) or space (as in cross sectional data). (Kendall and Buckland (1971). Autocorrelation test is used to determine whether there is any deviation classical autocorrelation assumption, namely the correlation between residuals in one observation with another observation on the regression model. Prerequisite that should be fulfilled is the absence of autocorrelation in the regression model.
Method to measure the existence of autocorrelation are : 1. Durbin – Watson
Durbin Watson test.
Testing method often used is by Durbin-Watson test (DW test) with the following conditions, (Winarno, 2009):
- If d is smaller than dL or greater than (4-dL), then the null hypothesis is rejected which means there is autocorrelation
- If d lies between dU and (4-dU), the null hypothesis is accepted which means there is no autocorrelation
- If d lies between dL and dU or in between (4-dU) and (4-dL), it does not produce definitive conclusions
e = residual
DW test is relatively easy, but there are some weaknesses that must be known. The disadvantage is:
• Test DW independent valid only when the variables are random (stochastic). • Test DW cannot be used in moving average models (moving average)
To overcome the drawbacks mentioned, can be used Breusch-Godfrey test (BG)
Breusch-Godfrey.
In this way, we only see the value of R2 probability. (Winarno, 2009)
• If the value probability> α = 5%, meaning there is no autocorrelation. • If the value probability ≤ α = 5%, meaning there is autocorrelation.
Normality Test
CHAPTER IV
MACRO-OVERVIEW OF MANUFACTURING LABOR IN INDONESIA (1992-2010)
4.1 The Labor of Manufacturing in relation with Economic Growth
For most Asian economies, small-medium enterprises are considered the engine of economic growth by virtue of their numbers and their significant economic and social contributions. Small-medium enterprises in developing Asia account for about 80 per cent of all non-agricultural enterprises, and generate about the same percentage of total employment. In addition, they contribute between 40 and 70 per cent of total value added (Tambunan 2008a).
In Indonesia, small-medium enterprises have historically been the main players in domestic economic activities, especially as providers of employment opportunities, and hence generators of primary or secondary sources of income for many households. For low-income and poor farm households in rural areas, SMEs, especially small enterprises (including microenterprises), in non-farm activities are a particularly important source of employment.
manufacturing industry. Small-medium enterprises for manufacturing industries are involved mainly in simple traditional products, such as wood products and furniture, textiles and garments, footwear, and food and beverages. Only a small portion of small-medium enterprises produce machinery, production tools or automotive components. The latter is generally carried out through subcontracting arrangements with multinational car companies (Thee 1993 and Tambunan 2008a).
It is predicted in year of 1999 the number of establishments of the small scale industry increased that was 15.93 percent from year 1998. Increasing number of establishments in 1999 parallel with increased of workers and labor cost as well. Meanwhile, the number of workers in 1999 also increased compared with that of 1998 and this occurred in all types of industries. Small scale industries have the biggest increase (18.15 percent) while household increased 14.25 percent. In 2000, the number of workers was estimated increase about 12.70 percent for small scale industries and 3.80 percent for household industries. (Statistik Indonesia, 2000)
The number of establishment of small scale industries in 2003 were decreased by 1.14 percent. While in 2004, the number of establishment of small scale industries were estimated increased by 5.00 percent comparing to 2003. Parallel with the decrease of the number of establishment, the number of workers of small scale industries in 2003 was also decreased compared to that of 2002. The number of worker of small scale industries was decreased by 2.21 percent. But by increase of the number of small scale industries in 2004, the number of worker was also estimated increased by 8.11 percent. (Statistik Indonesia, 2004)
From 89.8 million people who have been working, around 45.28 percent of them worked at agricultural sector. The other sector which have big enough role in employment is covered trade (20.58 percent), manufacturing industry (12.96 percent) and services (10.66 percent). In Java Island the role of agricultural sector is less than other island, however the role of manufacturing industry and trade sector in employment in Java Island is more than its other island.
In August 2007, the total number of workers and employees in Indonesia was 28.06 percent of the total working population. The biggest percentage of those worked in services, manufacturing, trade, agricultural and construction sector.
0 2000000 4000000 6000000 8000000 10000000 12000000 14000000 16000000
Figure 4.1
Labor Progress
Labor Forces (people)
Source : Own processed data