FIRST GLOBAL MONITORING REPORT
FIRST GLOBAL MONITORING REPORT
WHO Library Cataloguing-in-Publication Data
Tracking universal health coverage: first global monitoring report
1.Universal Coverage. 2.Delivery of Health Care. 3.Healthcare Financing. 4.Health Services Accessibility. 5.Cost of Illness. 6.Program Evaluation. I.World Health Organization. II.World Bank.
ISBN 978 92 4 156497 7 (NLM classification: W 84)
© World Health Organization 2015
All rights reserved. Publications of the World Health Organization are available on the WHO website (www.who.int) or can be purchased from WHO Press, World Health Organization, 20 Avenue Appia, 1211 Geneva 27, Switzerland (tel.: +41 22 791 3264; fax: +41 22 791 4857; e-mail: [email protected]).
Requests for permission to reproduce or translate WHO publications –whether for sale or for non-commercial distribution– should be addressed to WHO Press through the WHO website (www.who.int/about/licensing/copyright_form/en/index.html). The designations employed and the presentation of the material in this publication do not imply the expression of any opinion whatsoever on the part of the World Health Organization concerning the legal status of any country, territory, city or area or of its authorities, or concerning the delimitation of its frontiers or boundaries. Dotted and dashed lines on maps represent approximate border lines for which there may not yet be full agreement.
The mention of specific companies or of certain manufacturers’ products does not imply that they are endorsed or recommended by the World Health Organization in preference to others of a similar nature that are not mentioned. Errors and omissions excepted, the names of proprietary products are distinguished by initial capital letters.
All reasonable precautions have been taken by the World Health Organization to verify the information contained in this publication. However, the published material is being distributed without warranty of any kind, either expressed or implied. The responsibility for the interpretation and use of the material lies with the reader. In no event shall the World Health Organization be liable for damages arising from its use.
Contents
Preface iv
Contributors vi
Abbreviations vii
Glossary viii
Executive summary 1
Chapter 1 Bringing UHC into focus 6
Deining UHC 7
Tracking UHC 9
The main UHC monitoring challenges 10
Conclusion 14
References 15
Chapter 2 Coverage of health interventions 18
Global health service coverage indicators 19
Towards a list of comprehensive UHC tracer indicators 25
Conclusion 35
Chapter 3 Monitoring financial protection 40
OOP in the broader funding context 40
National measures of inancial protection 44
Ensuring the poor are not left behind 46
Positive trends in inancial protection 47
Going forward 49
References 51
Chapter 4 Looking back, moving forward 54
Looking back 54
Moving forward 59
References 60
Annex 1 Coverage indicators 62
Preface
ivPreface
Universal health coverage (UHC) means that all people receive the quality, essential health services they need, without being exposed to inancial hardship.
A signiicant number of countries, at all levels of development, are embracing the goal of UHC as the right thing to do for their citizens. It is a powerful social equalizer and contributes to social cohesion and stability. Every country has the potential to improve the performance of its health system in the main dimensions of UHC: coverage of quality services and inancial protection for all. Priorities, strategies and implementation plans for UHC will differ from one country to another.
Moving towards UHC is a dynamic, continuous process that requires changes in response to shifting demographic, epidemiological and technological trends, as well as people’s expectations. But in all cases, countries need to integrate regular monitoring of progress towards targets into their plans.
In May 2014, the World Health Organization and the World Bank jointly launched a monitoring framework for UHC, based on broad consultation of experts from around the world. The framework focuses on indicators and targets for service coverage – including promotion, prevention, treatment, rehabilitation and palliation – and inancial protection for all. This report provides the irst global assessment of the current situation and aims to show how progress towards UHC can be measured.
A majority of countries are already generating credible, comparable data on both health service and inancial protection coverage. Nevertheless, there are data blind spots on key public health concerns such as the effective treatment of noncommunicable diseases, the quality of health services and coverage among the most disadvantaged populations within countries.
UHC is a critical component of the new Sustainable Development Goals (SDGs) which include a speciic health goal: “Ensure healthy lives and promote wellbeing for all at all ages”. Within this health goal, a speciic target for UHC has been proposed: “Achieve UHC, including inancial risk protection, access to quality essential health care services and access to safe, effective, quality
and affordable essential medicines and vaccines for all”. In this context, the opportunity exists to
Preface
v The focus on UHC as part of the SDG agenda has much to offer. First, it provides a platform foran integrated approach within the health sector. The broad set of 13 targets for health, as well as health elements in many other targets, are justiiably broad but should not lead to the fragmented silo approaches that characterized much of the health MDGs.
Second, the SDGs and UHC are intrinsically about improving equity. Policies, programmes and monitoring should focus on progress among the poorest people, women and children, people living in rural areas and from minority groups. Using UHC as a common monitoring platform ensures a continuous focus on health equity.
Third, the health goal is closely linked to many of the other social, economic and environmental SDGs. Intersectoral action, including a major emphasis on promotion and prevention, are urgently needed. To end poverty and boost shared prosperity, countries need robust, inclusive economic growth. To drive growth, they need to build human capital through investments in health, education, and social protection for all their citizens. To free the world from extreme poverty by 2030, countries must ensure that all their citizens have access to quality, affordable health services.
While meeting the monitoring demands of these new objectives may be daunting, it also presents an opportunity to focus on strengthening country health information and research systems, using an integrated, comprehensive approach based on each country’s individual needs. This requires solid, transparent monitoring and review systems, as well as regular implementation and service delivery research that jointly feed an ongoing learning process of UHC implementation. Both health information systems and the science of service delivery require more investment but, if results are translated into targeted action, that investment will yield major resource savings while also advancing the UHC endeavour.
As challenging as the monitoring task may be, we are not starting from zero. There is already a strong foundation of health indicators to build upon, and a wealth of national and international experience. Much of this experience is built on the work done tracking the MDGs, but is increasingly focused on a more comprehensive approach that also includes NCDs and injuries.
Enhanced and expanded monitoring of health under the SDGs should seek to build on that experience, sharpening our focus on the key health service and inancial protection interventions that underpin UHC. Effective UHC tracking is central to achieving the global goals for poverty alleviation and health improvement set by the World Bank Group and WHO. Without it, policy-makers and decision-takers cannot say exactly where they are, or set a course for where they want to go. They cannot know whether they are focussing their efforts in the right areas, or whether their efforts are making a difference.
Monitoring is thus fundamental to the achievement of UHC objectives. It will also be vital to the realization of the SDGs. This report is a critical step to show how monitoring progress can be done, telling us what the state of coverage of interventions and inancial protection is and telling us where to focus most.
Tim Evans, Senior Director,
Health, Nutrition and Population, World Bank Group
Contributors
viContributors
The principal contributors to this report were Ties Boerma, David Evans, Tim Evans, Gabriela Flores, Patrick Hoang-Vu Eozenou, Daniel Hogan, Ahmad Reza Hosseinpoor, Justine Hsu, Gary Humphreys, Joseph Kutzin, Colin Mathers, Gretchen Stevens and Adam Wagstaff.
Speciic sections, analyses and reviews were contributed by staff from WHO, World Bank, non-governmental organizations, academic institutions and other United Nations agencies: Peter Ackland, Leontine Alkema, Agbessi Amouzou, Le Bao, Michel Beusenberg, Caryn Bredenkamp, Doris Chou, Richard Cibulskis, Daniel Cotlear, Alison Commar, Melanie Cowan, Tania Dmytraczenko, Majid Ezzati, Christin Fergus, Rifat Hossain, Christopher Fitzpatrick, Katherine Floyd, Gilles Forte, Marta Gacic-Dobo, Rick Johnston, Ivo Kocur, Van Lansingh, Hans Limburg, Daniel Low-Beer, Michael Lynch, Wahyu Retno Mahanani, Robert Marten, Matthews Mathai , Gayle Martin, Ann-Beth Moller, Maggie Niu, Leanne Riley, Jane Robertson, Lale Say, Owen Smith, Edouard Tursan D’Espaignet, Christel Vermeersch and Bin Zhou.
Abbreviations
viiAbbreviations
ANC antenatal care
ART antiretroviral therapy
BRICS Brazil, the Russian Federation, India, China and South Africa
DHS Demographic and Health Survey
DTP diphtheria, tetanus and pertussis INCB International Narcotics Control Board
IPL international poverty line
ITN insecticide treated bednet
LMIC low and middle-income country
MDD major depressive disorder MDG Millennium Development Goal
MICS Multiple Indicator Cluster Survey
NCD noncommunicable disease
NHIS National Health Insurance Scheme (Ghana) NTD neglected tropical disease
OECD Organisation for Economic Co-operation and Development
OOP out-of-pocket
RAAB rapid assessment of avoidable blindness
RMNCH reproductive, maternal, newborn and child health
SAB skilled attendance at birth
SDG Sustainable Development Goal
SMART speciic, measurable, achievable, relevant and time-bound
STEPS STEPwise approach to surveillance
TB tuberculosis
THE total health expenditure
Glossary
viiiGlossary
The deinitions given below apply to the terms used in this document. They may have different meanings in other contexts.
Catastrophic health expenditure. Out-of-pocket payments for health services that exceed a
given fraction of total household expenditure.
Effective coverage. People who need health services obtain them in a timely manner and at a
level of quality necessary to obtain the desired effect and potential health gains.
Impoverishing health expenditure. Out-of-pocket payments for health services that push
households below, or further below, a poverty line.
Out-of-pocket (OOP) payment. Direct payment made to health-care providers by individuals
at the time of service use, i.e. excluding prepayment for health services – for example in the form of taxes or speciic insurance premiums or contributions – and, where possible, net of any reimbursements to the individual who made the payment.
Universal health coverage. Universal health coverage means all people receiving the health
Executive summary
1Executive summary
Bringing universal health coverage (UHC) into focus: One of the main challenges faced
in supporting UHC-oriented reform is the perception on the part of some decision-makers that UHC is too diffuse a concept, and UHC-related progress unquantiiable. This irst global monitoring report on tracking UHC is produced partly to challenge that notion. Most countries are already generating credible, comparable data on both health service and inancial protection coverage, despite data blind spots on key public health concerns such as noncommunicable diseases (NCDs) and health service quality.
Broadly deined, UHC means all people receiving the quality health services they need, without being exposed to inancial hardship. UHC involves three coverage dimensions – health services, inance, and population – and is a dynamic, continuous process that changes in response to shifting demographic, epidemiological and technological trends, as well as people’s expectations.
The main UHC monitoring challenges: We face three main challenges in tracking UHC:
irst, sourcing reliable data on a broad set of health service coverage and inancial protection indicators; second, disaggregating data to expose coverage inequities; third, measuring effective coverage, which not only includes whether people receive the services they need but also takes into account the quality of services provided and the ultimate impact on health. Household surveys are the main data source because they can provide accurate population statistics on coverage of services and inancial protection, disaggregated by socioeconomic status, place of residence, sex and other relevant variables. Health facility data are another valuable data source for several indicators. Strengthening and harmonizing data collection through surveys and health facility reporting systems are critical for the monitoring of UHC. Because health system strengthening is the main means by which countries can progress towards UHC, UHC monitoring needs to be integrated into broader health systems performance assessment, and because UHC includes health services and inancial protection coverage, it is essential that UHC monitoring of both aspects takes place side by side. Many countries with weak health systems score strongly on inancial protection coverage simply because citizens forgo needed health services. It is only by evaluating the coverage of health services and inancial protection jointly that we can reach appropriate conclusions as to how effectively the health system is providing coverage.
The tracer health service indicators: The report presents the global and regional situation
with regard to eight core tracer health service coverage indicators for: reproductive and newborn health (family planning, antenatal care, skilled birth attendance); child immunization (three doses of diphtheria, tetanus and pertussis (DTP)-containing vaccine); infectious disease (antiretroviral therapy (ART), tuberculosis (TB) treatment); and non-health sector determinants of health (improved water sources and improved sanitary facilities). The indicators have been chosen because they involve health interventions from which every individual in every country should beneit – no matter what the country’s level of socioeconomic development or epidemiological circumstances, and no matter what type of health system it may have – and because recent, comparable data are available for most countries.
Executive summary
2vaccination which, in 2013, reached 84% of one-year-olds. On the reproductive and maternal health front, coverage is approaching 80%, with 73% of live births taking place in the presence of a skilled birth attendant, and roughly the same proportion of women (76%) reporting that their demand for family planning is met by a modern method. Substantial coverage gaps remain, however. For example, in spite of signiicant improvements in the coverage rates for ART, only 37% of people living with HIV receive ART treatment. For TB only 55% of new TB cases reported receive diagnosis and successful treatment. Access to sanitation is also a major concern, with 36% of the world’s population, or nearly 2.5 billion people, lacking access to improved sanitation facilities, putting them at risk of several diseases including dysentery, cholera and typhoid.
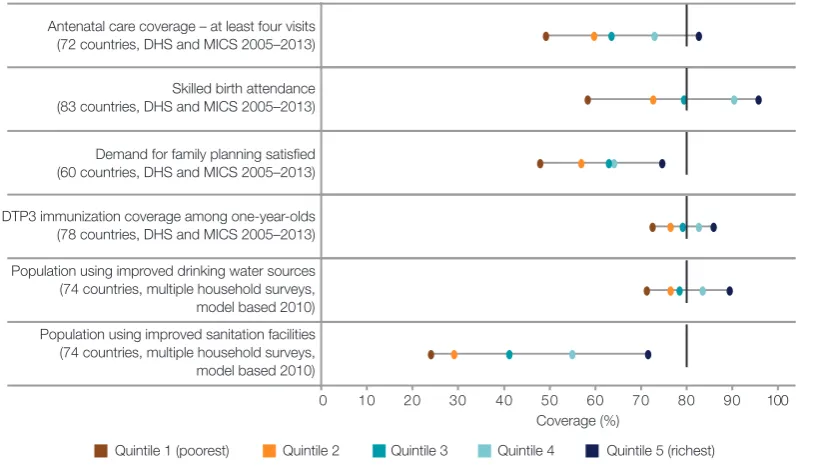
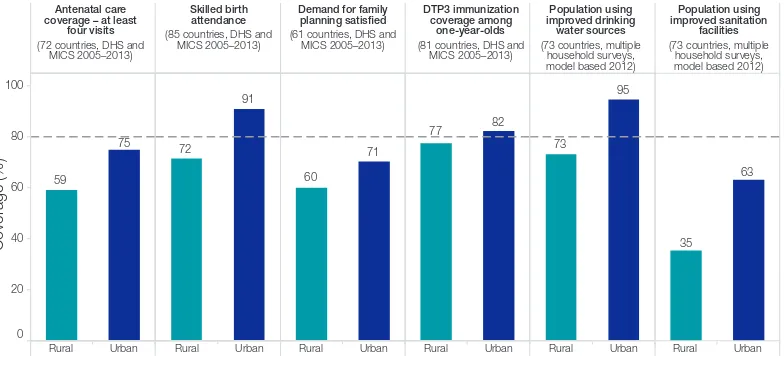
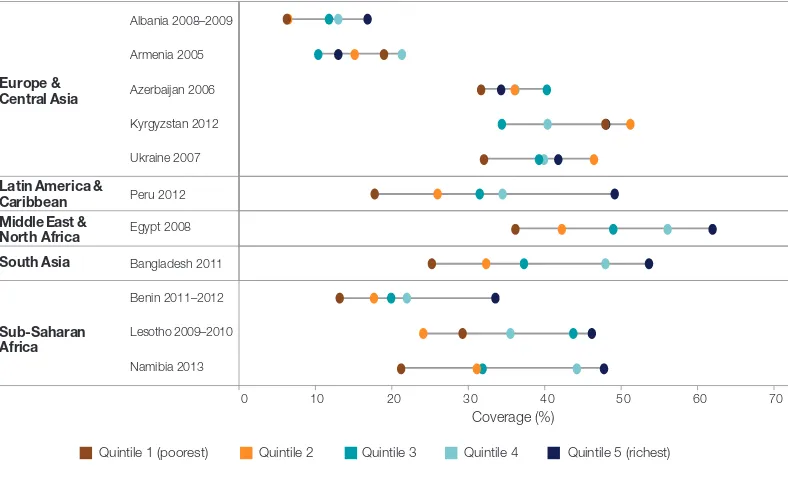
Equity is a matter of concern across nearly all indicators in many parts of the world, with at least 400 million people currently lacking access to one of seven essential services for Millennium Development Goal (MDG) priority areas. Needless to say poverty is a factor here. High-income Organisation for Economic Co-operation and Development (OECD) countries have high coverage rates across almost all essential services, while sub-Saharan Africa lags well behind other regions for several basic health services, with only DTP3-containing immunization coverage approaching 80%. Inequities are also a factor within countries. For example, in selected low- and middle-income countries with recent survey data, the median coverage with four or more antenatal care visits (ANC4) is less than 50% of women in the poorest quintile of households, compared to a median coverage of 83% for women in the richest quintile. While coverage inequities continue to be a major concern, and should be a central focus in developing reform strategies to move towards UHC, it is encouraging to note that, overall, disadvantaged subpopulations, such as rural residents, the poor and the less educated have seen greater increases in key coverage indicators over the past decade or so than their urban, wealthier and better-educated counterparts.
Candidate tracer indicators: As already stated, the current set of core health indicators
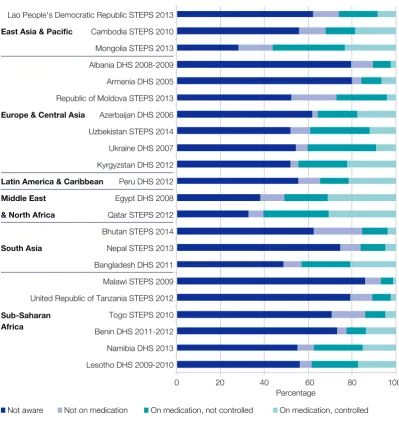
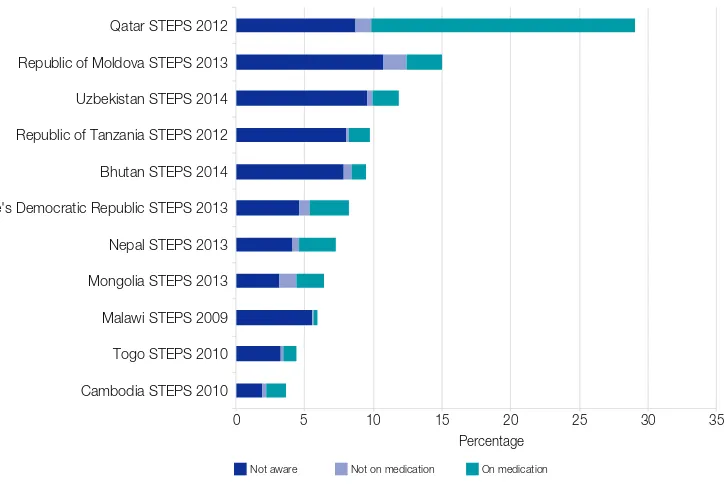
offers no insight into health service coverage for NCDs, which account for around 55% of the global disease burden, and are estimated to kill around 38 million people per year, almost three quarters of those deaths – 28 million – occurring in low- and middle-income countries. For this reason the report presents a small set of potential UHC tracer indicators for diseases and conditions which are close to meeting the criteria for tracer indicator status. For some, the combination of data availability and the scope for monitoring underlying services make them very strong candidates. This is true, for example, of hypertension treatment coverage. Hypertension is the leading risk factor for cardiovascular diseases, it has a clearly deined biomarker (elevated blood pressure), effective treatment options (including lifestyle and pharmacological treatments), and can be measured through household surveys. Blood pressure and hypertension treatment are also the subject of extensive monitoring, including more than 150 national population-based surveys in 97 countries in the past decade. Despite these efforts, to date, no global or regional estimates of hypertension treatment coverage exist. Type 2 diabetes treatment coverage is another promising candidate. Effective treatment coverage is measurable through population-based surveys that include a test for diabetes and questions on whether the respondent is taking medication for diabetes. In the past 10 years, at least 119 national population-based surveys in 75 countries have been conducted.
Other promising indicators include: percentage of adults (aged 15 years and over) who
Executive summary
3Monitoring financial protection. The key to protecting people from inancial hardship is to
ensure that most funds for the health system are prepaid, that there are few if any barriers to the redistribution of these funds (i.e. little if any fragmentation in pooling), and that services are purchased from these pooled funds in a way that limits the need for people to pay for services out-of-pocket (OOP) at the time of use. Using OOP payment to fund health systems has a number of disadvantages, but among the most important is that it discourages people (especially the poor) from seeking care. By focusing on the level of OOP payment it is possible to monitor the degree to which people lack inancial protection. In 2013, globally 32% of total health expenditure came from OOP payments, down from 36% in 2000. While this is the right direction, the 2013 igure is nevertheless considered an indication that in many countries OOP payments are still too high (below 20% of total health expenditure is usually a good indication of reduced risk of catastrophic health spending). The report utilizes the two most commonly used indicators of inancial hardship: catastrophic health expenditure, and impoverishing health expenditure.
Financial protection indicators: Catastrophic health expenditure can be calculated
in different ways, but for the purposes of this report is deined as more than 25% of total household expenditure. It is important to note that catastrophic health expenditure does not necessarily lead to impoverishment in the sense of pushing a household below a poverty line. Rich households, or households with access to credit, for example, might be able to pay large medical bills that, while onerous, do not require them to forgo consumption of essentials or of key family investments such as for children’s schooling. Impoverishing expenditure, on the other hand, is expenditure that pushes households into, or further into, poverty. Here too, different measurement criteria can be applied. In this report impoverishing expenditure is judged to occur where it causes household consumption to slip below the international poverty line of US$ 1.25 or US$ 2.00 per day per capita (at purchasing power parity), a consumption indicator used by the World Bank.
Effective tracking of inancial protection depends on reliable household expenditure surveys which are used to establish the estimated number of people affected as a share of the total population (headcount ratio). While useful, headcount indicators do not capture the magnitude of impoverishment, or make a distinction between spending much more than 25% of total household expenditure or spending just marginally more. Nor do they take account of people lacking inancial protection who are deterred from seeking health care because the cost of doing so is simply unaffordable. For a complete picture regarding whether people obtain the services they need and receive inancial protection, it is imperative to consider the health coverage and inancial coverage indicators together.
Based on our sample of countries, the median percentage of people experiencing catastrophic health spending (deined as more than 25% of total household expenditure) was reported to be 1.8%, ranging from six countries at the low end reporting less than 0.5% of people impacted by catastrophic health spending in the preceding year and, at the higher end, four countries reporting a catastrophic spending incidence in excess of 4%. With regard to impoverishment, health spending pushed 0.6% of people below the US$ 1.25 a day poverty line, and 0.9% below US$ 2 per day (country median). Much larger proportions of those who already live below the poverty lines are pushed further into poverty because of health payments: 4% and 14.5% at the US$ 1.25 and US$ 2.00 per day poverty lines respectively. In addition, nearly one third of people do not spend anything on health services at all. Among 23 countries with two surveys during 2000–2011 the majority succeeded in reducing the incidence of catastrophic and impoverishing health payments, and the country median values went down by 29% and 24% respectively.
Inequities in financial protection: Because the indicators of inancial protection are derived
Executive summary
4expenditure (country median) rises from 1.0% in the lowest spending quintile and gradually increases to 2.7% in the highest spending quintile. However, health spending leading to impoverishment is almost entirely concentrated in the lowest spending quintile in the majority of countries (households in that quintile being closer to the poverty line to begin with). Lack of any expenditure on health whatsoever is also most common among the poorest, with a country median of 41%. This number drops to 22% for the richest quintile. From the data it is impossible to know whether this relects simply lower utilization of needed services by the poor, or the fact that they used services and were fully protected from OOP payments by the country’s health inancing system. Experience suggests that the former explanation is more likely, but the data do not allow for a deinitive conclusion on this.
Moving forward: Notwithstanding the persistence of inequities in access to health services
(400 million people lacking at least one of seven essential health services) and the relatively high level of impoverishment caused by health spending, it is apparent that UHC progress is a reality, and that key aspects of that reality are measurable. This irst global monitoring report on tracking UHC shows that using a core set of tracer indicators of the kind recommended by the WHO/World Bank Group UHC monitoring framework, it is possible to track progress in key areas of inancial protection and health services coverage not just for populations as a whole, but for critical subpopulations such as people living in rural areas and the poor.
The Sustainable Development Goals (SDGs) that are to carry us into the future are likely to include a number of speciic health goals as indicated by the UN General Assembly’s endorsement of the Open Working Group report in which “Ensure healthy lives and promote wellbeing for all at all ages” is one of 17 SDGs. There are 169 targets for all goals combined, and the health goal (Goal 3) comprises 13 targets, including one (target 3.8) for UHC: “Achieve UHC, including inancial risk protection, access to quality essential health care services and
access to safe, effective, quality and affordable essential medicines and vaccines for all”. While
meeting the monitoring demands of these new objectives may be daunting, it also presents an opportunity to focus on strengthening country health information systems, using an integrated, comprehensive approach and based on each country’s individual needs. Where appropriate these efforts should be supported by well-aligned investments by international partners.
1
Bringing UHC into focus
6Bringing UHC into focus
Interest in universal health coverage (UHC) has never been greater. Starting with the 58th World Health Assembly resolution in 2005,1 which called for countries to plan for the transition to UHC, a broad consensus regarding the importance of UHC has been steadily building. Today the list of major international institutions actively working on UHC concept-framing, capacity-building and inancial support includes United Nations agencies, development banks, bilateral donors and foundations. At the same time, a series of high-level consultations and conferences have advanced our understanding of the challenges faced and crystallized opinion around a number of calls for action.2, 3, 4 The passage in 2012 of a United Nations General Assembly resolution calling for governments “to accelerate the transition towards universal access to affordable and quality health care services”,5 conirmed not only the breadth of consensus regarding the urgency of action on UHC, but also the level of concern about the state of the world’s health systems.
And there are many reasons for concern, from the lack of quality health services and inadequate inancial protection coverage for signiicant portions of the population in low- and middle-income countries, to the challenges of sustaining and expanding the gains already achieved in high-income countries. Generally speaking, these problems are perceived as a steady rumble of dysfunction and discontent, but from time to time there is a spike in awareness regarding health system inadequacy. The recent Ebola outbreak in West Africa is a case in point, the severity of the outbreak being in large part due to weak health systems, including a lack of capacity in surveillance and response. As a result of that outbreak, basic health services such as vaccinations, maternal and child health services, and treatment for common conditions suffered, and need to be restored, but longer term, key health reforms must be implemented, including strengthening community systems and their linkages to district health services, aiming to provide promotion, prevention, treatment, rehabilitation and palliation without causing inancial hardship. In other words what is needed is UHC, which not only implies quality health service and inancial protection for all, but provides a foundation for resilient health systems that can quickly identify, respond to and recover from outbreaks and disasters.
That many countries have embraced the UHC concept is undeniable; the World Health Organization (WHO) and the World Bank have provided technical assistance on UHC to more than 100 countries since 2010. While UHC is a matter of concern for countries of all sizes, down to the smallest island states, it is worth noting that the BRICS countries (Brazil, the Russian Federation, India, China and South Africa), representing around half of the global population, are all engaged in health system reforms designed to extend, deepen, or otherwise improve health service coverage for their populations while simultaneously working on ways to increase inancial protection for those availing themselves of health services (1).
For many high-income countries, commitment to the core UHC idea – that everyone can obtain the quality, essential health services they need without suffering inancial hardship when paying for them – has underpinned health-system design and development for decades; for others the UHC journey began more recently, driven by a complex combination of factors, including
1 World Health Assembly Resolution 58.33 2005.
2 Bangkok Statement on Universal Health Coverage, January 2012 3 Mexico City Political Declaration on Universal Health Coverage 2012.
4 Tunis Declaration on Value for Money, Sustainability and Accountability in the Health Sector, July 2012.
Bringing UHC into focus
7 greater prosperity and iscal expansion (2), as well as increased popular demand and the politicalawareness and commitment that comes with it. Now that UHC has been proposed as one of the targets of the Sustainable Development Goals (SDGs) (Goal 3.8: “Achieve UHC, including inancial risk protection, access to quality essential health care services and access to safe, effective, quality and affordable essential medicines and vaccines for all”), it is likely that the mobilization of resources committed to UHC-oriented, health system strengthening will increase (3, 4).
But the road to UHC is by no means smooth, and in most of the countries newly embracing a UHC agenda, commitment to the general idea is balanced by at least as much concern regarding how exactly to move forward. The challenges are many, ranging from the political to the technical, but among the most important is how to track UHC progress. At one level, the importance of UHC monitoring hardly needs stating. Without it, policy-makers and decision-takers cannot say exactly where they are, or set a course for where they want to go. They cannot know whether they are focusing their efforts in the right areas, or whether their efforts are making a difference. Less obviously perhaps, effective monitoring – and the solid grasp of quantiiable detail it permits – is crucial for the progress of national UHC agendas. One of the challenges faced in supporting UHC-oriented reform is the perception on the part of some ministers that UHC is too diffuse a concept. That this is more than just an academic issue is borne out by reports that the lack of progress towards UHC observed in some countries relects a tendency to focus resources on discrete, vertical health programmes because the results are easier to quantify (5).
This report – the irst global monitoring report on tracking UHC – is produced partly to challenge that notion, to show that UHC is quantiiable, and that progress towards its key goals, both in terms of health service and inancial protection coverage can be tracked. Intended for a broad audience, from policy-makers to researchers and students interested in UHC-related issues, the report will show that the majority of countries are already generating credible, comparable data in both these dimensions, including data for a set of Millennium Development Goal (MDG)-related indicators that provide useful insights into UHC-related progress. For example, we can already afirm with some conidence that more people have access to essential health services today than at any other time in history, and that in some cases – child vaccination, for example – global population coverage already surpasses the 80% minimum proposed by the global monitoring framework. On the inancial protection front, the data show that the share of out-of-pocket (OOP) payment in total health expenditure has continued to decline, albeit slowly, standing at 32.1% in 2013, a fall of 3.5% from 2002. Notwithstanding these areas of illumination, data blind spots persist – in particular with regard to noncommunicable disease (NCD) and injury-related indicators, but also, more broadly, with regard to the quality of health services delivered – and more work is needed to bring the UHC picture into focus. If momentum for UHC is to be maintained, the image will need to get sharper quickly.
Defining UHC
Broadly deined, UHC means all people receiving the health services they need, including health initiatives designed to promote better health (such as anti-tobacco policies), prevent illness (such as vaccinations), and to provide treatment, rehabilitation, and palliative care (such as end-of-life care) of suficient quality to be effective while at the same time ensuring that the use of these services does not expose the user to inancial hardship (6). Thus UHC comprises two main components:
Bringing UHC into focus
8Figure 1.1. The three dimensions of UHC
Health systems not only evolve or are reformed over time, but vary signiicantly from country to country. For example, although predominant reliance on compulsory revenue sources (7),1 reduced fragmentation in risk pooling arrangements, and increasing the extent to which services are purchased based on information regarding population health service needs and the performance of providers, are attributes of systems that have made good progress towards UHC (8), the way
these mechanisms are implemented varies considerably from country to country.
Some countries, such as Costa Rica or Brazil have moved towards uniied systems, striving to offer the same services to all from public funding (9, 10). In Costa Rica, this funding is derived
from a mixture of payroll taxes (mandatory contributions for health insurance coverage levied on employers and employees) and general government budget revenues that are pooled together in a national health insurance fund. Brazil relies overwhelmingly on general tax revenues of central and local governments with pooling organized at state, municipal and national levels. Others organize their funds in different pools (schemes) for different population groups. Such arrangements often exacerbate underlying social inequalities, with contributory-based schemes serving populations from which it is relatively easy to collect mandatory contributions (often formal sector workers including civil servants) and typically offering a relatively generous beneit package, while general budget revenues are used to fund services for the rest at a relatively low expenditure level per capita (11). There are exceptions, such as the Philippines (12), that provide more comprehensive
plans to the most vulnerable, but this is within their single payer framework and not organized as a separate scheme.
Finally, inancial coverage provided by different schemes ranges from minimal, as in some versions of China’s New Cooperative Medical Scheme (13), where patients pay as much as 75% of the
cost of service, to the comprehensive, as in Mexico’s Seguro Popular (14), or Chile’s AUGE which offers an integrated care package with explicit standards of care guarantees that has signiicantly
1 In this context, “compulsory” refers to a public source of funds, i.e. some form of taxation, such as taxes on the income of individuals or corporations, consumption (e.g. value added tax (VAT)), mandatory “contributions” for health insurance (often referred to as social health insurance contributions), and other taxes (or in some cases, public revenues derived from natural resources). In some systems there is a real mix of such public sources while in others one tends to predominate. This message on compulsory sources thus applies both to so-called “national health service” and “social health insurance” systems.
Reduce cost sharing and fees
Include other services
Direct costs: proportion of the costs covered
Services: which services are covered?
Population: who is covered?
Current pooled funds
Bringing UHC into focus
9 reduced (but not altogether nulliied) coverage disparities between the government-managedinsurance scheme that is fully subsidized for some of the population, and the private schemes (ISAPREs) that are funded through a combination of mandatory and additional contributions (15).
These differences often relect different departure points. For the most part, countries are trying to progress towards UHC out of the policies and systems they have inherited, rather than starting from scratch. In rare instances, however, countries have indeed “started over”. This is true of Estonia, for example, which completely transformed its system of inancing and delivery after the collapse of the Union of Socialist Soviet Republics (USSR) and independence in 1991, with largely private primary care providers serving nearly the entire population under contract to the publicly funded Estonian Health Insurance Fund (16).
Countries do not just start from different places, they have also made different degrees of progress towards UHC, ranging from those that are still setting their national health reform agendas for UHC to countries with mature health systems based on principles that are consistent with UHC but require constant attention to adjust national policies to meet changing demographic and economic conditions (17). In many cases, differences in progress and approach relect the resources that
have been made available. The reforms initiated in China, for example, are backed by colossal inancial resources, and are widespread, ranging from improving social health insurance schemes in both rural and urban areas, to strengthening the primary health care system and reforming the public hospital sector (18). Other countries are targeting a smaller core set of priorities. Ethiopia,
for example, is focusing on reducing under-ive, infant, and neonatal mortality rates and boosting immunization rates and the delivery of other child health services (19). Because of the diversity of
countries’ circumstances, and the different interventions they are likely to prioritize, the indicators they decide to monitor will also vary.
Tracking UHC
In response to governments’ calls for technical support on UHC monitoring, WHO and the World Bank have come together to produce a UHC monitoring framework, which is based on a series of country case studies and technical reviews as well as consultations and discussions with country representatives, technical experts and global health and development partners (20). The framework
focuses on the two key components of UHC: coverage of the population with quality, essential health services and coverage of the population with inancial protection (21).
With regard to health services, the framework proposes two broad categories: prevention (which here includes services for health promotion and illness prevention) and treatment (which includes treatment per se, but also rehabilitation and palliative care services) (22). With regard to
tracking levels of inancial coverage, the framework is somewhat simpler, proposing the use of two indicators: the incidence of impoverishment resulting from OOP health payments, and the incidence of inancial catastrophe from the same cause. The former captures the degree to which health spending causes extreme hardship by pushing families below the poverty line, while the latter indicates the number of households of all income levels that incur health payments that are higher than a certain proportion of their resources (21). Other indicators exist that allow for a more
nuanced view, such as the extent to which people are pushed further into poverty, and the severity of inancial catastrophe. These indicators can be calculated from household expenditure surveys using readily available statistical programs.1 The global framework recommends that countries, at a minimum, track the proportion of the population pushed into poverty, and/or pushed further into poverty, by OOP health payments.
The framework also proposes that countries include a set of core, tracer indicators suitable for the purposes of regional global UHC monitoring. A global measure of progress can only be synthesized from country data if there is a common and comparable set of tracer indicators that
Bringing UHC into focus
10meet international measurement standards. Similarly, it is only with comparable indicators that countries can derive the maximum beneit from each other’s experiences and lessons learnt (23). These common tracer indicators also allow countries to compare their progress against that of other, similar countries. In the following chapter we will look at two sets of indicators that might serve to fulil these different requirements.
Before moving on to look at the main UHC-tracking challenges, it is worth noting that, while it is clear that the choice of indicators should, as far as possible, be based on objective considerations such as relevance and quality, there will also be trade-offs between keeping the number of indicators small, manageable (and understandable) and employing enough to capture the full breadth of health services within a UHC programme. A key consideration here is simplicity, since understandable “tracer” indicators to monitor progress can be a powerful way of galvanizing efforts to move towards UHC.
Finally, with regard to coverage levels, although the ultimate goal of UHC with regard to service coverage is 100% coverage, it is practical to set targets based on empirical baseline data and past trends in the whole population and among the poorest, taking into account uncertainties related to measuring need and the importance of effective coverage (21). For this reason the WHO/World
Bank framework speciies a target of a minimum 80% coverage of quality, essential health services, regardless of economic status, place of residence or sex. For inancial protection, the available evidence suggests that a target of 100% protection from both catastrophic and impoverishing health payments is achievable for the population.
The main UHC monitoring challenges
Challenge no. 1: sourcing reliable data. Tracking UHC presents a number of challenges.
As noted above one of the most important is the relative scarcity of reliable data on a broad set of health service coverage and inancial protection indicators, disaggregated by key stratiiers to ascertain progress in all population groups. The process of identiication of good tracer indicators for UHC tracking undertaken in preparation for the WHO/World Bank framework, and for this report, has revealed major data blind spots, including, for example, a lack of measurable coverage indicators for several health priorities such as mental health, injuries and disability, while indicators for many major NCDs are at best only partially quantiiable. At the same time, few treatment indicators have reliable denominators, as population need is dificult to measure, especially for treatment interventions for which potentially high OOP expenses are a likely barrier to service use. It is worth noting here that aggregate measures of utilization levels, such as per capita inpatient/ outpatient visits offer little insight into underlying need or levels of access, and are for that reason not included as UHC indicators. Determining population need for speciic interventions is a key challenge, especially in settings where a large proportion of the population may not seek health services at all, considering them unaffordable, and problems therefore remain undiagnosed. This challenge applies to both acute and chronic conditions and similarly to conditions that require ambulatory or inpatient care. In addition, measures of health system capacity, such as levels of health spending or doctors per 1000 population, are not considered UHC indicators because these are determinants of health coverage rather than attributes or measures of coverage.
Bringing UHC into focus
11Challenge no. 2: measuring effective coverage.Where coverage data are available, there is
rarely suficient information to monitor levels of effective coverage. Effectiveness is a measure of the degree to which evidence-based health services achieve desirable outcomes (24), and effective
coverage is coverage with services that achieve those outcomes (25). Measuring coverage with
quality of care is clearly at the heart of the UHC endeavour, and there is thus considerable interest in measuring it (26). However, measuring quality of care often requires the use of methods and
measures in addition to basic coverage indicators (Box 1).
Box 1.
Measuring quality
To understand the problem we have in measuring health-care quality it is irst important to understand what is meant by the term. Health service quality has been deined in a number of ways and comprises at least half a dozen dimensions (27), including patient safety (avoiding injuries to people for whom the care is intended), effectiveness (the degree to which evidence-based health services achieve desirable outcomes), people-centredness (providing care that responds to individual preferences, needs, and values) and integratedness (care that makes available the full range of health services from health promotion, disease prevention, diagnosis, treatment, disease management, rehabilitation and palliative care services, throughout the health system, and according to people’s needs throughout the life-course).
While each of these dimensions can readily be described, they are dificult to measure. Thus, for example, with regard to safety, health systems around the world have for a number of years tried to institute patient safety reporting and learning systems to help track and assess trends in adverse events, but are only beginning to achieve a common understanding of what terminology to use.1 There are examples of national data collection systems that work reasonably well, but not many, and without exception they are found in developed countries. Sources of frustration include low-quality coding practices, and, in the speciic area of patient experience, the lack of nationally standardized measurement systems. In 2002, WHO was tasked by the 55th World Health Assembly to develop norms and standards that might help with this problem, and their efforts led to the development of a conceptual framework for a system of classiication, but progress has been limited and hard won (28).
Because of the general lack of internationally comparable data on health service quality, comparative health system research at the international level has been limited to comparisons of cost and utilization of care, supplemented by appraisals of health status based on broad indicators such as mortality rates and life expectancy (29). Apart from being far too broad to offer much insight into health service quality,
these indicators also depend on factors outside the health system, such as environmental and economic inluences. It is to address this problem that the OECD has for a number of years been working on the Health Care Quality Indicators (HCQI) project, a project designed to provide comparable cross-national data on the quality of care, focusing on effectiveness, patient experience and safety (29). The long-term
objective of the HCQI project is to develop a set of indicators that can be used to raise questions for further investigation concerning quality of health services across countries.
Measuring effective coverage in fact requires multiple components, including estimates of need, use, quality and outcome of interventions. As mentioned above, deining and measuring treatment need is often challenging. An example of an indicator that is close to reaching the standard required for international comparison is hypertension treatment coverage which allows for a fairly robust estimate of effective coverage because population need and effectiveness of treatment can be measured through household surveys.
There have been several efforts to measure effective coverage. One example is a series of studies undertaken in Latin America and the Caribbean which encountered signiicant data gaps and were
Bringing UHC into focus
12for the most part unable to estimate effective coverage for most services (30). However, while
inding ways to monitor effective coverage is challenging, it can be done, as shown by a recent national survey undertaken in Kenya which measured the fraction of the HIV-infected population who had seen their viral loads shrink to an undetectable level as a result of treatment (Box 2). To achieve viral suppression the patients had to pass through an effective coverage cascade that involves testing the respondents for HIV, asking about their awareness of their HIV status and their treatment status and measuring the viral load in the blood. The largest loss was due to lack of awareness, with 48% of people living with HIV being unaware of their HIV-positive status. Effective coverage, meaning being aware, on treatment and displaying viral load suppression, was only 27%. For many indicators, the end-point of the effective coverage cascade cannot be measured and additional indicators have to provide information on the quality of care and the likelihood of achieving the desired outcomes. Earlier steps along the way have to serve as proxies. This report has taken this approach for several indicators, for example when estimating coverage of antenatal care (ANC) and skilled attendance at birth (SAB), where ANC and SAB are proxy measures of effectiveness. For other cases, such as family planning, effective coverage is easier to measure through self-report.
Box 2.
Measuring effective coverage
A recent survey undertaken in Kenya measured the fraction of the HIV-infected population that achieved viral suppression (reduction to an undetectable level) as a result of treatment. To achieve viral suppression they had to pass through an effective coverage cascade, starting with becoming aware of their HIV infection, then accessing the health system, being given antiretrovirals, and inally, having those antiretrovirals work. Clearly, monitoring the fraction of people living with HIV who have suppressed viral loads is more informative than the cruder measure of the fraction of people living with HIV receiving antiretroviral therapy (ART), as it more accurately relects expected beneits in terms of patient survival and reduced transmission. In cases where the end-point of the effective coverage cascade cannot be measured, earlier steps along the cascade must serve as proxies.
Figure 1.2. Effective ART coverage cascade: percentage of people living with HIV on ART with viral load suppression (less than 1000 copies/ml), Kenya, 2012
100 52 47 36 27
0 10 20 30 40 50 60 70 80 90 100
People living with HIV
Aware of HIV+ status
In care On ART Not aware
Percentage
In care, no ART Aware but not
in care
On ART, no suppression
Virally suppressed
Challenge no. 3: monitoring equity. A commitment to equity is at the heart of the UHC
Bringing UHC into focus
13 a country may show the average level of attainment of population coverage, it only tells part ofthe story. To be meaningful, UHC tracking also needs to capture inequalities in coverage. The WHO/World Bank monitoring framework proposes three primary elements for disaggregation that should be measured comparably in all settings: economic status (measured by household income, expenditure or wealth), place of residence (rural or urban), and sex.
Household surveys are often the prime instrument to collect data on equity, but health facility data also contribute, particularly continuous data on subnational differences (22, 31). Regular household
surveys are a rich source of disaggregated data on coverage of health services and inancial protection. However, as noted above, household surveys do present some challenges. In the irst instance, data needed to measure service coverage and data used to measure inancial protection are usually found in different surveys (e.g. Demographic and Health Surveys (DHS)/Multiple Indicator Cluster Surveys (MICS) versus household budget surveys). Second, comparability of results may be affected by differences in survey questions or by differences in design and implementation, as borne out by several studies pointing to results that may vary according to the way surveys are conducted (32, 33). For example, the health expenditures reported in surveys (or parts of
surveys) focusing on health tend to be higher than those reported in surveys (or sections) where health is only one item under consideration (34, 35). Ongoing efforts to develop global standards
for survey modules for core indicators of service coverage, inancial protection and other areas of health should help resolve this issue (36). With regard to health facility data, concerns include the
fact that facility records rarely have a measure of the living standards of the patient’s household, precluding straightforward disaggregation by economic variables. Data gathered in the course of service provision are also limited to individuals who avail themselves of health care, excluding those who do not. This means that estimates of the denominator – all people who need the service – have to be derived from other data. Sourcing reliable data for health inequality monitoring poses a particular challenge in many countries.
Finally, country UHC monitoring needs to be integrated into broader health systems performance assessment if it is to realize its full potential as actionable intelligence. Monitoring UHC coverage in its different dimensions by itself does not reveal why or what policy levers can be used to get better results: it is the most direct result of the implementation of those policies. For this reason the monitoring of UHC indicators needs to be embedded within health systems performance assessment frameworks that link changes in coverage to potential drivers of progress caused by changes in inputs, structures and processes. These will include structural elements such as the availability and quality of infrastructure, health professionals, medicines, blood and medical devices, and process elements such as health system reforms (e.g. changes in provider payment mechanisms) that seek to improve service quality or health service utilization. Assessing the distribution of health needs and services is critical. And while understanding a country’s health system reforms is important to determine the causes of change in health coverage measures, it is also essential to assess changes in non-health system social determinants of health such as educational attainment and poverty rates, as such changes also greatly inluence coverage and outcomes (22).
Bringing UHC into focus
14Conclusion
Bringing UHC into focus
15References
1. Marten R, McIntyre D, Travassos C, Shishkin S, Longde W, Reddy S. An assessment of progress towards universal health coverage in Brazil, Russia, India, China, and South Africa (BRICS). Lancet. 2014;384(9960):2164–71. doi: 10.1016/S0140-6736(14)60075-1.
2. Panel Discussion on Universal Health Coverage at the Center of Sustainable Development: Contributions of Sciences, Technology and Innovations to Health Systems Strengthening Geneva, 3 July 2013 (http://www.un.org/en/ecosoc/julyhls/pdf13/13_hls_thematic_summary_ on_uhc_panel.pdf, accessed 15 April 2015).
3. A new global partnership: eradicate poverty and transform economies through sustainable development. Report of the High-level Panel of Eminent Persons on the Post-2015 Development Agenda. New York: United Nations; 2013.
4. Touraine M. et al. Universal health coverage and the post-2015 agenda (Comment). Lancet. 2014;384(9949):1161–2.
5. Annual Report. May 2013–April 2014. P4H Social Health Protection Network (http://p4h-network.net/wp-content/uploads/2013/03/P4H_annual_report_2013-2014.pdf, accessed 15 April 2015).
6. The world health report. Health systems inancing: the path to universal coverage. Geneva: World Health Organization; 2010 (http://www.who.int/whr/2010/en/, accessed 20 April 2015). 7. Fuchs VR. What every philosopher should know about health economics. Proc Am Philosoph
Soc. 1996;140:185–94.
8. Kutzin J. Anything goes on the path to universal health coverage? No. Bull World Health Organ. 2012;90(11):867–8.
9. Montenegro Torres, F. Costa Rica case study: Primary health care achievements and challenges within the framework of the social health insurance. Universal Health Coverage (UNICO) studies series no. 14. Washington (DC): World Bank; 2013.
10. Gragnolati M, Lindelow M, Couttolenc B. Twenty years of health system reform in Brazil: An assessment of the Sistema Único de Saúde. Directions in Development. Washington (DC): World Bank; 2013.
11. Giedion U, Alfonso EA, Díaz Y. The impact of universal coverage schemes in the developing world: a review of the existing evidence. Universal Health Coverage (UNICO) studies series no. 25. Washington (DC): World Bank; 2013.
12. Chakraborty S. Philippines government sponsored health coverage program for poor households. Universal Health Coverage (UNICO) studies series no. 22. Washington (DC): World Bank; 2013.
13. Liang L, Langenbrunner JC. The long march to universal coverage: lessons from China. Universal Health Coverage (UNICO) studies series no. 9. Washington (DC): World Bank; 2013. 14. Bonilla-Chacín ME, Aguilera N. The Mexican social protection system in health. Universal
Health Coverage (UNICO) studies series no. 1. Washington (DC): World Bank; 2013.
15. Bitran, R. 2013. Explicit health guarantees for Chileans: The AUGE beneits package. UNICO Studies Series 21. Washington, DC: the World Bank.
16. Lai T, Habicht T, Jesse M. Monitoring and evaluating progress towards universal health coverage in Estonia. PLoS Med. 2014;11(9):e1001677.
17. Maeda A, Araujo E, Cashin C, Harris J, Ikegami N, Reich MR. Universal health coverage for inclusive and sustainable development. A synthesis of 11 country case studies. Washington (DC): World Bank; 2014.
18. Meng Q, Xu L (2014) Monitoring and evaluating progress towards universal health coverage in China. PLoS Med. 2014;11(9):e1001732.
Bringing UHC into focus
1620. Technical meeting on measurement and monitoring of universal health coverage, Singapore, 17–18 September 2013. Geneva: World Health Organization; 2013 (http://www.who.int/ healthinfo/UHC_Meeting_Singapore_Sep2013_Report.pdf?ua=1, accessed 20 April 2015). 21. World Health Organization and World Bank Group. Monitoring progress towards universal
health coverage at country and global levels. Framework measures and targets. Geneva: World Health Organization and International Bank for Reconstruction and Development/ World Bank; 2014 (http://apps.who.int/iris/bitstream/10665/112824/1/WHO_HIS_HIA_14.1_eng. pdf, accessed 15 April 2015).
22. Boerma T, AbouZahr C, Evans D, Evans T. Monitoring intervention coverage in the context of universal health coverage. PLoS Med. 2014;11:e1001728.
23. Dmytraczenko T, Almeida G, editors. Toward universal coverage and equity in Latin America and the Caribbean. Washington (DC): World Bank; 2015.
24. Juran J, Godfrey B. Juran’s quality handbook. New York: McGraw Hill; 2000.
25. Ng M, Fullman N, Dieleman JL, Flaxman AD, Murray CJL, Lim. Effective Coverage: A Metric for Monitoring Universal Health Coverage. PLoS Med. 2014;11(9):e1001730. doi: 10.1371/ journal.pmed.1001730.
26. Shengelia B, Tandon A, Adams OB, Murray CJ. Access, utilization, quality, and effective coverage: an integrated conceptual framework and measurement strategy. Soc Sci Med. 2005;61: 97–109.
27. Kohn LT, Corrigan JM, Kohn LT, Corrigan JM, Donaldson MS, editors. To err is human: Building a safer health system. Washington (DC): Institute of Medicine; 2000.
28. Conceptual framework for the international classiication for patient safety. Geneva: World Health Organization; 2009.
29. Improving value in health care: Measuring quality. Paris: Organisation for Economic Co-operation and Development; 2010.
30. Martínez S, Carrasquilla G, Guerrero R, Gómez-Dantés H, Castro V, Arreola-Ornelas H. [Effective coverage of health interventions in Latin America and the Caribbean: Metrics for the assessment of health systems performance]. Salud Publica Mex. 2011;53(suppl 2):S78–S84. 31. Hosseinpoor AR, Bergen N, Koller T, Prasad A, Schlotheuber A, Valentine N, et al.
Equity-oriented monitoring in the context of universal health coverage. PLoS Med. 2014;11:e1001727. 32. Rouselle F, Brooks BPC, Hanlon M. Estimating health expenditure shares from household
surveys. Bull World Health Organ. 2013;91(7) 519–24C.
33. Lu C, Chin B, Li G, Murray CJL. Limitations of methods for measuring out-of-pocket and catastrophic private health expenditures. Bull World Health Organ. 2009;87:238–44, 244A–244D.
34. Heijink R, Xu K, Saksena P, Evans D. Validity and comparability of out-of-pocket health expenditure from household surveys: a review of the literature and current survey instruments. Geneva: World Health Organization; 2011 (Discussion Paper No. 1-2011) (http://www.who.int/ health_inancing/documents/dp_e_11_01-oop_errors.pdf, accessed 20 April 2015).
35. Xu K, Ravndal F, Evans DB, Carrin G. Assessing the reliability of household expenditure data: results of the World Health Survey. Health Policy. 2009;91(3):297–305.
36. International Household Survey Network. Standardized health survey modules. Washington (DC): World Bank. (http://www.ihsn.org/home/health-modules).
37. Tangcharoensathien V, Limwattananon S, Patcharanarumol W, Thammatacharee J. Monitoring and evaluating progress towards universal health coverage in Thailand. PLoS Med. 2014;11:e1001726.
Bringing UHC into focus
172
Coverage of health interventions
18Coverage of health
interventions
There are many widely accepted indicators of intervention coverage and risk factor prevalence. The 2015 Global Reference List of 100 Core Health Indicators, recommended by global health agency leaders, includes 60 such indicators (1). As noted in Chapter 1, in order to facilitate global
UHC tracking, it is recommended that countries focus on a common and comparable set of tracer indicators, covering health promotion, illness prevention, treatment, rehabilitation and palliative care. The Global Reference List includes an indicator if it has a proven track record, is prominent in the monitoring of major international declarations, or has been identiied through international mechanisms such as reference or interagency groups as a priority indicator in speciic programme areas. Related to this idea is the notion that these tracer indicators should be supported by extensive measurement experience and possibly by an international database. Such indicators also need to be relevant and reliable (a concept that includes reproducibility), valid (in terms of criterion, construct and content validity), responsive, precise, acceptable and feasible. From an advocacy perspective, it may also be helpful to identify indicators that are easily understood and help focus political and social commitment, such as the child and maternal mortality rate indicators.
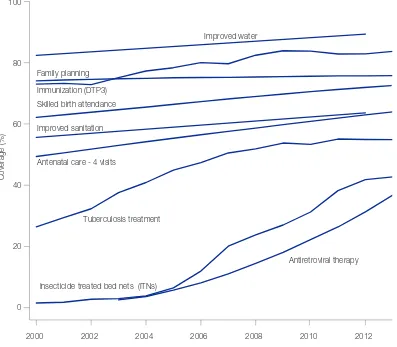
This chapter begins by presenting the global and regional situation with regard to eight core tracer coverage indicators on reproductive and newborn health, infectious disease and non-health sector determinants of health: family planning, four or more visits for antenatal care (ANC4), skilled attendance at birth (SAB), child immunization (three doses of DTP-containing vaccine), HIV ART, TB treatment, improved water sources and improved sanitary facilities. The indicators have been chosen because they involve health interventions from which every individual in every country should beneit – no matter what the country’s level of socioeconomic development or epidemiological circumstances, and no matter what type of health system it may have – and because there are recent, comparable data for the majority of countries that allow for an assessment of the current situation and trends, globally, by region and by country. A description of the core tracer indicators for monitoring UHC is provided in Table A1.1 in Annex 1, which also describes measurement issues and offers more detail on the results for these indicators.
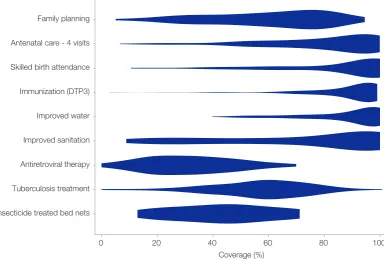
As noted in the previous chapter, equity is a central UHC concern, and tracking it – using disaggregated data that allow for the capture of demographic, socioeconomic and geographical dimensions – a UHC tracking priority. Unfortunately, disaggregated data are not readily accessible for many indicators because of gaps in data collection, and the analysis and measurement challenges they pose. Here, we present data on coverage disparities within countries for six of the eight indicators for which extensive data are available, with a focus on differences related to household wealth and place of residence (i.e. urban or rural). With regard to population coverage levels, special attention has been given to whether the global monitoring framework’s target of a minimum of 80% coverage in all population groups is being achieved.
Coverage of health interventions
19 and standardized measurement instruments that permit the tracking of interventions focused onNCDs, which account for 55% of the global burden of disease, as well as other signiicant drivers of morbidity and mortality such as injuries. It is with a view to supporting that endeavour that in the last part of the chapter we present several indicators for which high levels of comparable data are not yet available, either because not enough has been invested in data collection or because there are important measurement obstacles, but which nevertheless come close to satisfying the requirements of the core tracer indicator set. These candidate indicators are also presented in Table A1.1. Both the core set and candidate core set of indicators also deserve consideration for in-country monitoring. This section also includes the current situation in respect of service coverage for neglected tropical diseases (NTDs), a group of 17 diseases that affect the poorest people of the world, and for which estimates of preventive chemotherapy coverage are available from many affected countries.
Global health service coverage indicators
The global picture: progress and gaps
More people have access to essential health services today than at any other time in history. In some cases, global population coverage already surpasses the 80% minimum proposed by the global monitoring framework (Figure 2.1). This is true, for example, of DTP3 vaccination which, in 2013, reached 84% of one-year-olds. It is also true of access to improved water sources – a non-health sector variable which nevertheless has profound implications for population health. According to the most recent data, nearly 90% of the global population now has access to water that is either piped into a dwelling, plot or yard, obtained from a public tap or well, or collected from a protected spring or rainwater. On the reproductive and maternal health front, 73% of live births take place in the presence of a skilled birth attendant, with roughly the same proportion of women (76%) reporting that their demand for family planning is met by a modern method.
Despite this progress substantial coverage gaps remain. For example, in spite of signiicant improvements in the coverage rates for ART, access to care remains low, with only 37% of people living with HIV receiving ART. It is important to note, however, that this is partly a function of changes in WHO guidelines for ART. The original threshold for treatment initiation was below 200 CD4 cells/mm3, and is now set at 500 CD4 cells/mm3 or less with earlier initiation for some special populations. This change expands the population deemed eligible for treatment, and therefore shrinks the coverage achieved. For TB an estimated 64% of cases are detected and reported to national authorities and, of those, 84% are reported as having been successfully treated. This corresponds to only 55% of new TB cases reported to have received diagnosis and successful treatment.1 Finally, access to sanitation remains a major concern, with 36% of the world’s population, or nearly 2.5 billion people, lacking access to improved sanitation facilities, putting them at risk of several diseases including dysentery, cholera and typhoid (2).
Moreover, a closer look at all these indicators reveals nuance that gives cause for disquiet. For example, with regard to water, access to an improved source does not mean that the water being collected is necessarily clean, making this a prime example of coverage not being the same as effective coverage (see Box 2 in Chapter 1). A recent literature review reported that in 38% of 191 studies, over a quarter of samples from improved sources contained faecal contamination
(3). Maternal health indicators also reveal reasons for concern, given the massive mobilization of resources as part of the MDG effort. For example, the proportion of women delivering in health facilities has gradually increased, but not enough, and there are valid concerns about the quality of obstetric care in health facilities (4). Meanwhile, family planning coverage, while relatively high, has
seen virtually no improvement since 2000.
Coverage of health interventions
20Figure 2.1. Global levels and trends of health MDG-related UHC tracer indicators, 2000–2013
How many people sufer from lack of access to health services?
Ensuring access to quality health services is a central tenet of UHC, and, in many parts of the world, lack of access continues to be a major concern. Barriers to access take a variety of forms, the most obvious being the basic lack of quality health services, but there are also obstacles such as distance to the nearest health facility, restricted opening hours at facilities or overcrowded facilities that impose long waiting times. The cost of the health services may also deter use, especially where direct OOP payment is involved. Other signiicant barriers include: lack of information on available services, lack of conidence in facilities and staff, and sociocultural barriers including constraints related to gender or age, beliefs and cultural preference (5, 6). According to the latest
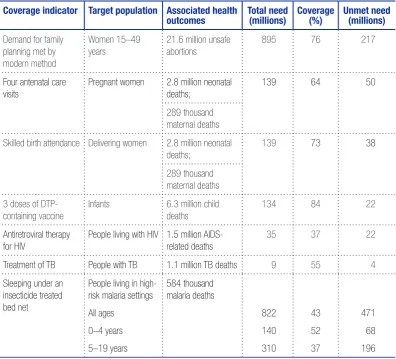
available data, at least 400 million people are currently not receiving at least one of seven essential services for MDG priority areas1 (Table 1).
1 The total estimate of 400 million includes all women whose demand for family planning is not met, pregnant women who did not make at least 4 antenatal visits (minus 38% to account for unintended pregnancies), infants who did not receive 3 doses of DTP-containing vaccine, HIV-positive adults and children not receiving HIV treatment, adults with new cases of TB not receiving TB treatment and children 1–14 years not sleeping under an insecticide-treated bed net (ITN)).
2000 2002 2004 2006 2008 2010 2012
0 20 40 60 80 100
Coverage (%)
Family planning
Antenatal care - 4 visits Skilled birth attendance Immunization (DTP3)
Improved water
Improved sanitation
Antiretroviral therapy Tuberculosis treatment
[image:30.595.116.513.112.459.2]Coverage of health interventions
21 Table 1. Number of people in need and not receiving (unmet need) essential health services inMDG priority areas in 2013
Coverage indicator Target population Associated health outcomes Total need (millions) Coverage (%) Unmet need (millions)
Demand for family planning met by modern method
Women 15–49 years
21.6 million unsafe abortions
895 76 217
Four antenatal care visits
Pregnant women 2.8 million neonatal deaths;
139 64 50
289 thousand maternal deaths
Skilled birth attendance Delivering women 2.8 million neonatal deaths;
139 73 38
289 thousand maternal deaths
3 doses of DTP-containing vaccine
Infants 6.3 million child
deaths
134 84 22
Antiretroviral therapy for HIV
People living with HIV 1.5 million AIDS-related deaths
35 37 22
Treatment of TB People with TB 1.1 million TB deaths 9 55 4
Sleeping under an insecticide treated bed net
People living in high-risk malaria settings
All ag


![The world health report: health systems financing: the path to universal coverage - [BUKU]](data:image/gif;base64,R0lGODlhAQABAIAAAP///wAAACH5BAEAAAAALAAAAAABAAEAAAICRAEAOw==)