ABSTRAK
Toserba X adalah salah satu toserba yang terkemuka di kota Bandung. Pihak
manajemen Toserba X menyatakan bahwa permasalahan yang kini tengah dialami
Toserba X adalah jumlah konsumen yang berbelanja mengalami penurunan
sekitar 20 % dikarenakan adanya persaingan yang ketat dengan
supermarket
dan
hypermarket
sejenis yang berada di sekitar lokasi Toserba X. Menyikapi
permasalahan tersebut, Toserba X berupaya untuk meningkatkan daya saingnya
dengan mempertimbangan persaingan dengan pesaing-pesaing utamanya.
Penelitian ini dilakukan untuk membantu perusahaan dalam meningkatkan daya
saing perusahaan guna menghadapi persaingan yang ketat.
Pengumpulan data-data yang akan dipergunakan dalam penelitian dilakukan
dengan melakukan wawancara terhadap manajemen Toserba X dan sejumlah
konsumen, serta menyebarkan kuesioner kepada konsumen. Kuesioner
pendahuluan digunakan untuk menilai tingkat kepentingan dari faktor-faktor yang
mendorong konsumen untuk berbelanja di suatu toserba /
supermarket
/
hypermarket
. Sedangkan, kuesioner pertama digunakan untuk mengetahui
faktor-faktor yang mendorong konsumen untuk berbelanja di suatu toserba /
supermarket
/
hypermarket
, serta untuk mengetahui pesaing-pesaing dari Toserba X. Kuesioner
kedua digunakan untuk mengetahui persepsi konsumen mengenai Toserba X dan
pesaing-pesaing utamanya.
Pengolahan data dengan Analisis Faktor digunakan untuk mengetahui
faktor-faktor yang mendorong konsumen untuk berbelanja di suatu toserba /
supermarket
/
hypermarket
. Faktor-faktor tersebut adalah penyediaan fasilitas-fasilitas fisik,
produk-produk yang dijual lengkap dan kualitasnya baik, suasana yang aman,
nyaman, tenang untuk berbelanja serta kemudahan pembayaran dengan debet dan
kredit, harga jual produk yang murah dan sudah sesuai dengan kualitas produk
yang dijual, kecepatan pelayanan kasir dan kemudahan bagi konsumen untuk
mengetahui harga produk, keramahan petugas dalam melayani konsumen, adanya
obral atau diskon, kemudahan konsumen untuk bertanya dan mengajukan
komplain, kemudahan akses menuju lokasi supermarket baik dengan kendaraan
umum dan kendaraan pribadi, serta pengadaan undian berhadiah.
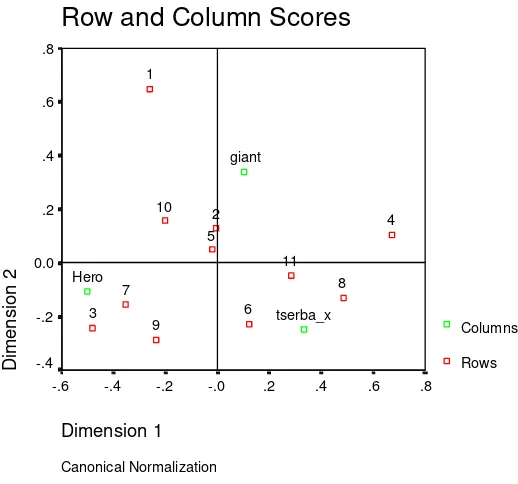
Correspondence Analysis
digunakan untuk mengetahui persepsi
konsumen terhadap Toserba X dengan pesaing utamanya. Toserba X memiliki
keunggulan pada kecepatan pelkasir dan kemudahan bagi konsumen mengetahui
harga produk, adanya obral / diskon, dan adanya undian berhadiah. Namun, Giant
DAFTAR ISI
ABSTRAK………iii
KATA PENGANTAR DAN UCAPAN TERIMA KASIH………..iv
DAFTAR ISI……….vii
DAFTAR TABEL………..xi
DAFTAR GAMBAR………xiii
DAFTAR LAMPIRAN………xiv
BAB 1 PENDAHULUAN
1.1
Latar Belakang Masalah……….1-1
1.2
Identifikasi Masalah………... 1-2
1.3
Pembatasan Masalah………...1-2
1.4
Perumusan Masalah………....1-3
1.5
Tujuan dan Manfaat Penelitian………...1-3
1.6
Sistematika Penulisan……….1-5
BAB 2 TINJAUAN PUSTAKA
2.1
Pemasaran………...2-1
2.1.1
Definisi Pemasaran……….2-1
2.1.2
Bauran Pemasaran………..2-2
2.2
Konsep dan Pengertian Jasa………...2-5
2.2.1
Klasifikasi Jasa………...2-6
2.2.2
Karakteristik Jasa………...2-9
2.3
Penjualan Eceran………..2-11
2.4
Teknik Pengumpulan Data………...2-15
2.5
Populasi dan Sampel……….………2-18
2.5.1
Populasi ……….………..2-18
2.5.2
Sampel……….……….…2-18
2.7
Pengujian Validitas dan Reliabilitas Instrumen………...2-25
2.7.1
Pengujian Validitas Instrumen……….2-25
2.7.2
Pengujian Reliabilitas Instrumen……….2-26
2.8
Teknik Analisis Multivariat……….2-28
2.8.1
Analisis Faktor……….2-29
2.8.2
Model Matematis Analisis Faktor………...2-30
2.8.3
Pengujian Matriks Korelasi :
Bartlett’s Test Of Sphericity
………..2-31
2.8.4
KMO………2-32
2.8.5
Langkah-Langkah Analisis Faktor………...2-32
2.9
Analisis Persaingan………...2-34
2.10 Peta Posisi………...2-35
2.11
Correspondence Analysis
………...2-36
BAB 3 METODOLOGI PENELITIAN
3.2.17
Penentuan Sampel dan Objek Penelitian Kuesioner Kedua..……...3-16
3.2.18
Pengumpulan Data Kuesioner Kedua...………....3-17
3.2.19
Pengolahan Data Kuesioner Kedua dengan
Correspondence
Analysis
……….3-17
3.2.20
Analisis Data……….3-18
3.2.21
Kesimpulan dan Saran………..3-18
BAB 4 PENGUMPULAN DATA
4.1
Data Umum Perusahaan………..4-1
4.1.1
Sejarah Singkat Perusahaan………...4-1
4.1.2
Struktur Organisasi Toserba X………..4-2
4.1.3
Deskripsi Jabatan………..4-3
4.2
Pengumpulan Data………..4-7
4.2.1
Pengumpulan Data Kuesioner Pendahuluan……….4-7
4.2.2
Pengumpulan Data Kuesioner Pertama……….4-7
4.2.3
Pengumpulan Data Kuesioner Kedua………4-9
BAB 5 PENGOLAHAN DATA DAN ANALISIS
5.1
Pengolahan Data Kuesioner Pendahuluan………...5-1
5.1.1
Uji Validitas Kuesioner Pendahuluan………....5-1
5.1.2
Uji Reliabilitas Kuesioner Pendahuluan………5-3
5.2
Pengolahan Data Kuesioner Pertama………...5-4
5.2.1
Uji Validitas Kuesioner Pertama………..……..5-4
5.2.2
Uji Reliabilitas Kuesioner Pertama………5-6
5.3 Analisis Faktor……….………....5-6
5.7.2
Analisis Persepsi Persaingan Toserba X dengan Pesaing Utama….5-51
BAB 6 KESIMPULAN DAN SARAN………6-1
6.1 Kesimpulan………..6-1
6.2 Saran……….6-2
DAFTAR PUSTAKA………...xv
LAMPIRAN
DAFTAR TABEL
Tabel Judul Halaman
5.1 Perhitungan Validitas Kuesioner Pendahuluan 5 – 2
5.2 Perhitungan Reliabilitas Kuesioner Pendahuluan 5 – 3
5.3 Perhitungan Validitas Kuesioner Pertama 5 – 4
5.4 Perhitungan Reliabilitas Kuesioner Pertama 5 – 6
5.5 Perhitungan Nilai KMO dan
Bartlett’s Test
5 – 8
5.6 Perhitungan Nilai
Communalities
5 – 9
5.7 Perhitungan
Total Variance Explained
5 – 10
5.8 Perhitungan
Communalities
Pertama Kriteria 5 – 12
Eigen Value
5.9 Perhitungan
Total Variance Explained
5 – 13
Pertama
Kriteria
Eigen Value
5.10 Perhitungan
Rotated Component Matrix
5 – 14
Pertama Kriteria
Eigen Value
5.11 Perhitungan
Communalities
Kedua Kriteria
5 – 16
Eigen Value
5.12 Perhitungan
Total Variance Explained
5 – 17
Kedua Kriteria
Eigen Value
5.13 Perhitungan
Rotated Component Matrix
5 – 18
Kedua Kriteria
Eigen Value
5.14 Perhitungan
Communalities
Ketiga Kriteria
5 – 19
Eigen Value
Tabel Judul Halaman
5.16 Perhitungan
Total Variance Explained
5 – 22
Keempat Kriteria
Eigen Value
5.17 Perhitungan
Rotated Component Matrix
5 – 23
Keempat Kriteria
Eigen Value
5.18 Perhitungan
Communalities
Kelima Kriteria 5 – 24
Eigen Value
5.19 Perhitungan
Total Variance Explained
5 – 25
Kelima Kriteria
Eigen Value
5.20 Perhitungan
Rotated Component Matrix
5 – 26
Kelima Kriteria
Eigen Value
5.21 Penamaan Faktor
5 – 34
5.22 Jumlah Responden Yang Pernah Berbelanja Di
DAFTAR GAMBAR
Gambar Judul Halaman
DAFTAR LAMPIRAN
Lampiran Judul Halaman
1 Variabel-Variabel Penelitian
L1-1
2 Kuesioner Pendahuluan
L2-1
3
Kuesioner Pertama
L3-1
4
Kuesioner Kedua
L4-1
5
Data Kuesioner Pendahuluan
L5-1
6
Data Kuesioner Pertama
L6-1
7
Data Kuesioner Kedua
L7-1
8
Perhitungan Uji Validitas & Reliabilitas
L8-1
9
Perhitungan Analisis Faktor
L9-1
10
Perhitungan
Correspondence Analysis
L10-1
11
Tabel r
Product Moment
L11-1
Reliability
****** Method 1 (space saver) will be used for this analysis ******
_
R E L I A B I L I T Y A N A L Y S I S - S C A L E (A L P H A)
Mean Std Dev Cases
45. VAR00045 3.2333 .6789 30.0 46. VAR00046 2.4000 .7701 30.0 _
R E L I A B I L I T Y A N A L Y S I S - S C A L E (A L P H A)
N of Statistics for Mean Variance Std Dev Variables
SCALE 127.5333 198.6023 14.0926 46
_ R E L I A B I L I T Y A N A L Y S I S - S C A L E (A L P H A) Item-total Statistics Scale Scale Corrected Mean Variance Item- Alpha if Item if Item Total if Item Deleted Deleted Correlation Deleted VAR00001 124.2000 192.6483 .4301 .9195
VAR00002 124.4667 188.6023 .5459 .9183
VAR00003 124.0000 193.1724 .3667 .9199
VAR00004 124.5333 192.3264 .4119 .9196
VAR00005 124.3667 191.7575 .4466 .9193
VAR00006 124.4667 187.5678 .6064 .9177
VAR00007 124.4333 186.9437 .5728 .9179
VAR00008 124.4000 189.6966 .4497 .9192
VAR00009 124.4000 189.5586 .5541 .9183
VAR00010 125.5333 187.4989 .4859 .9188
VAR00011 124.2667 192.6851 .4577 .9194
VAR00012 124.4333 190.8747 .4384 .9193
VAR00013 124.3667 190.5161 .4288 .9194
VAR00014 125.5667 195.0126 .1870 .9215
VAR00015 124.7333 189.5126 .3808 .9201
VAR00016 125.3333 191.2644 .3455 .9203
VAR00017 125.1333 195.2920 .1684 .9217
VAR00018 125.5000 188.8793 .4663 .9190
VAR00019 125.2000 189.5448 .4737 .9189
VAR00020 124.6000 193.0759 .2879 .9207
VAR00021 124.7667 189.1506 .4159 .9196
VAR00022 124.3333 189.1264 .5424 .9184
VAR00023 124.6000 191.5586 .4152 .9195
VAR00024 125.3000 195.0448 .2038 .9213
VAR00025 124.6000 190.7310 .4223 .9194
VAR00026 124.7000 187.5966 .4787 .9189
VAR00027 124.6667 187.2644 .5830 .9178
VAR00028 124.9667 188.9989 .4898 .9188
VAR00030 124.8000 189.9586 .5164 .9186
VAR00031 124.5333 186.6713 .6030 .9176
VAR00032 124.4333 188.8057 .6309 .9178
VAR00033 124.8000 186.3724 .5109 .9185
VAR00034 125.1667 185.7299 .4980 .9188
VAR00035 124.9667 188.7230 .4365 .9194
VAR00036 125.2333 191.0126 .3980 .9197
VAR00037 125.4000 190.1793 .3917 .9198
VAR00038 125.3667 191.4126 .4705 .9191
VAR00039 125.6333 190.6540 .4110 .9195
VAR00040 125.3000 191.3897 .4381 .9193
VAR00041 124.3667 188.7230 .5316 .9184
_ R E L I A B I L I T Y A N A L Y S I S - S C A L E (A L P H A) Item-total Statistics Scale Scale Corrected Mean Variance Item- Alpha if Item if Item Total if Item Deleted Deleted Correlation Deleted VAR00042 124.1000 192.5759 .4127 .9196
VAR00043 125.2667 194.8230 .1444 .9227
VAR00044 124.2000 192.3034 .4564 .9193
VAR00045 124.3000 191.1138 .3744 .9199
VAR00046 125.1333 190.2575 .3649 .9202
Reliability
****** Method 1 (space saver) will be used for this analysis ******
_
R E L I A B I L I T Y A N A L Y S I S - S C A L E (A L P H A)
Mean Std Dev Cases
1. VAR00001 3.1583 .3666 120.0 2. VAR00002 3.2250 .4577 120.0 3. VAR00003 3.1833 .3886 120.0 4. VAR00004 3.0083 .4936 120.0 5. VAR00005 3.1750 .3816 120.0 6. VAR00006 2.7583 .5650 120.0 7. VAR00007 2.9917 .5103 120.0 8. VAR00008 3.2250 .4930 120.0 9. VAR00009 3.1250 .5433 120.0 10. VAR00010 3.2000 .4415 120.0 11. VAR00011 2.9333 .4626 120.0 12. VAR00012 2.9417 .4727 120.0 13. VAR00013 3.3000 .4602 120.0 14. VAR00014 2.7667 .6576 120.0 15. VAR00015 2.9833 .5795 120.0 16. VAR00016 2.6833 .5795 120.0 17. VAR00017 3.3917 .5070 120.0 18. VAR00018 2.5917 .6798 120.0 19. VAR00019 3.0917 .7218 120.0 20. VAR00020 2.8500 .6437 120.0 21. VAR00021 3.0833 .5279 120.0 22. VAR00022 3.3500 .4790 120.0 23. VAR00023 2.9917 .6011 120.0 24. VAR00024 3.2667 .4441 120.0 25. VAR00025 3.2250 .5719 120.0 26. VAR00026 3.1917 .4357 120.0 27. VAR00027 2.6583 .9658 120.0 28. VAR00028 2.7917 .8391 120.0 29. VAR00029 2.5667 .8274 120.0 30. VAR00030 2.4000 .9294 120.0 31. VAR00031 2.7583 .5185 120.0 32. VAR00032 2.6833 .6734 120.0 33. VAR00033 3.1750 .4613 120.0 34. VAR00034 3.1750 .5893 120.0 35. VAR00035 3.3500 .4790 120.0 36. VAR00036 3.1917 .5695 120.0 37. VAR00037 2.7500 .6251 120.0 38. VAR00038 2.6667 .6262 120.0 39. VAR00039 3.2583 .4583 120.0 40. VAR00040 2.9667 .5788 120.0
_
R E L I A B I L I T Y A N A L Y S I S - S C A L E (A L P H A)
Item-total Statistics
Scale Scale Corrected
Mean Variance Item- Alpha if Item if Item Total if Item Deleted Deleted Correlation Deleted
VAR00001 116.9250 52.9943 .2375 .7667
VAR00002 116.8583 52.2907 .2865 .7647
VAR00003 116.9000 52.0403 .3933 .7623
VAR00004 117.0750 51.9355 .3117 .7636
VAR00005 116.9083 52.8067 .2604 .7660
VAR00006 117.3250 51.5489 .3116 .7631
VAR00007 117.0917 52.3361 .2438 .7659
VAR00008 116.8583 52.7613 .1944 .7677
VAR00009 116.9583 52.3932 .2172 .7669
VAR00010 116.8833 52.1880 .3156 .7639
VAR00011 117.1500 51.8765 .3460 .7627
VAR00012 117.1417 52.9125 .1833 .7681
VAR00013 116.7833 52.8770 .1954 .7677
VAR00014 117.3167 52.1510 .1909 .7684
VAR00015 117.1000 52.4941 .1865 .7682
VAR00016 117.4000 52.2084 .2212 .7668
VAR00017 116.6917 52.6688 .1998 .7675
VAR00018 117.4917 51.6806 .2306 .7667
VAR00019 116.9917 51.3865 .2405 .7663
VAR00020 117.2333 51.5081 .2678 .7648
VAR00021 117.0000 52.5546 .2042 .7674
VAR00022 116.7333 52.9031 .1814 .7681
VAR00023 117.0917 52.2184 .2091 .7673
VAR00024 116.8167 51.5459 .4161 .7607
VAR00025 116.8583 52.2571 .2192 .7669
VAR00026 116.8917 52.5680 .2593 .7657
VAR00027 117.4250 48.9187 .3364 .7619
VAR00028 117.2917 50.5949 .2595 .7660
VAR00029 117.5167 50.8905 .2390 .7671
VAR00030 117.6833 50.4535 .2332 .7685
VAR00031 117.3250 52.7422 .1839 .7681
VAR00032 117.4000 52.0908 .1905 .7685
VAR00033 116.9083 52.4033 .2665 .7653
VAR00034 116.9083 52.3865 .1949 .7679
VAR00035 116.7333 52.7854 .1985 .7676
VAR00036 116.8917 51.8957 .2653 .7650
VAR00037 117.3333 51.1317 .3215 .7624
VAR00038 117.4167 50.8838 .3493 .7612
VAR00039 116.8250 52.2632 .2902 .7646
R E L I A B I L I T Y A N A L Y S I S - S C A L E (A L P H A)
Reliability Coefficients
N of Cases = 120.0 N of Items = 40
Factor Analysis
Correlation Matrixa Determinant = 1.642E-05 a.
KMO and Bartlett's Test
.549
1154.975 780 .000 Kaiser-Meyer-Olkin Measure of Sampling
Adequacy.
Approx. Chi-Square df
Sig. Bartlett's Test of
Sphericity Communalities 1.000 .469 1.000 .536 1.000 .587 1.000 .435 1.000 .442 1.000 .457 1.000 .399 1.000 .460 1.000 .523 1.000 .481 1.000 .512 1.000 .428 1.000 .266 1.000 .448 1.000 .478 1.000 .400 1.000 .446 1.000 .481 1.000 .482 1.000 .223 1.000 .310 1.000 .301 1.000 .406 1.000 .440 1.000 .366 1.000 .384 1.000 .557 1.000 .402 1.000 .592 1.000 .560 1.000 .308 1.000 .256 1.000 .250 1.000 .340 1.000 .338 1.000 .214 1.000 .374 1.000 .427 1.000 .433 1.000 .423 VAR00001 VAR00002 VAR00003 VAR00004 VAR00005 VAR00006 VAR00007 VAR00008 VAR00009 VAR00010 VAR00011 VAR00012 VAR00013 VAR00014 VAR00015 VAR00016 VAR00017 VAR00018 VAR00019 VAR00020 VAR00021 VAR00022 VAR00023 VAR00024 VAR00025 VAR00026 VAR00027 VAR00028 VAR00029 VAR00030 VAR00031 VAR00032 VAR00033 VAR00034 VAR00035 VAR00036 VAR00037 VAR00038 VAR00039 VAR00040 Initial Extraction
Total Variance Explained
Extraction Method: Principal Component Analysis. Com
pone
nt Initial Eigenvalues
Extraction Sums of Squared Loadings
Rotation Sums of Squared Loadings
Total
% of Variance
Cumulative
% Total
% of Varianc
e
Cumulative
% Total
% of Variance
Cumulative %
1 4.479 11.196 11.196 5.479 11.196 11.196 2.768 6.919 6.919
2 2.814 7.034 18.231 2.814 7.034 18.231 2.716 6.791 13.710
3 2.423 6.056 24.287 2.423 6.056 24.287 2.614 6.534 20.244
4 1.868 4.671 28.958 1.868 4.671 28.958 2.234 5.585 25.829
5 1.804 4.510 33.468 1.804 4.510 33.468 2.193 5.483 31.313
6 1.692 4.231 37.699 1.692 4.231 37.699 2.147 5.368 36.680
7 1.557 3.892 41.591 1.557 3.892 41.591 1.964 4.910 41.591
8 1.456 3.640 45.231
9 1.352 3.381 48.612
10 1.292 3.230 51.842
11 1.218 3.046 54.888
12 1.186 2.966 57.854
13 1.128 2.819 60.673
14 1.064 2.660 63.333
15 1.039 2.597 65.930
16 1.006 2.516 68.446
17 .932 2.329 70.775
18 .909 2.272 73.047
19 .873 2.183 75.229
20 .845 2.113 77.342
21 .761 1.902 79.244
22 .747 1.867 81.111
23 .681 1.703 82.813
24 .658 1.645 84.458
25 .635 1.588 86.046
26 .588 1.470 87.516
27 .567 1.417 88.934
28 .525 1.312 90.246
29 .485 1.212 91.458
30 .461 1.153 92.612
31 .441 1.101 93.713
32 .397 .992 94.705
33 .370 .924 95.629
34 .361 .903 96.533
35 .283 .708 97.241
36 .255 .636 97.877
37 .242 .605 98.482
38 .219 .548 99.031
39 .215 .537 99.568
Component Matrixa
.552 .537
-.531
.601
.594 VAR00003
VAR00024 VAR00004 VAR00010 VAR00006 VAR00002 VAR00038 VAR00001 VAR00005 VAR00007 VAR00020 VAR00036 VAR00033 VAR00029 VAR00027 VAR00017 VAR00028 VAR00026 VAR00021 VAR00019 VAR00022 VAR00039 VAR00030 VAR00015 VAR00037 VAR00018 VAR00014 VAR00012 VAR00011 VAR00016 VAR00031 VAR00009 VAR00034 VAR00025 VAR00035 VAR00008 VAR00023 VAR00032 VAR00013 VAR00040
1 2 3 4 5 6 7
Component
Extraction Method: Principal Component Analysis. 7 components extracted.
Rotated Component Matrixa .750 .724 .719 .605 .733 .680 .637 .623 .569 .529 .521 .518 .658 .649 .667 .648 .581 .656 .563 .526 .516 .521 .518 .515 VAR00029 VAR00030 VAR00027 VAR00028 VAR00037 VAR00026 VAR00003 VAR00002 VAR00001 VAR00004 VAR00020 VAR00039 VAR00038 VAR00021 VAR00025 VAR00023 VAR00022 VAR00013 VAR00033 VAR00032 VAR00014 VAR00015 VAR00005 VAR00006 VAR00016 VAR00007 VAR00008 VAR00010 VAR00009 VAR00024 VAR00018 VAR00035 VAR00011 VAR00012 VAR00019 VAR00031 VAR00036 VAR00017 VAR00034 VAR00040
1 2 3 4 5 6 7
Component
Extraction Method: Principal Component Analysis. Rotation Method: Varimax with Kaiser Normalization.
Component Transformation Matrix
.326 .531 .461 .302 .386 .340 .209
-.642 -.310 .549 -.224 .159 .213 .263
.664 -.424 .152 -.517 -.020 .141 .263
.042 -.357 -.063 .551 -.464 .583 .090
-.022 -.127 -.204 -.182 .456 .537 -.642
-.015 -.338 -.434 .305 .617 -.121 .456
.195 -.429 .478 .401 .147 -.421 -.435
Component 1
2 3 4 5 6 7
1 2 3 4 5 6 7
Factor Analysis
Correlation Matrixa Determinant = 1.642E-05 a.
KMO and Bartlett's Test
.549
1154.975 780 .000 Kaiser-Meyer-Olkin Measure of Sampling
Adequacy.
Approx. Chi-Square df
Sig. Bartlett's Test of
Sphericity Communalities 1.000 .699 1.000 .663 1.000 .679 1.000 .660 1.000 .595 1.000 .617 1.000 .699 1.000 .709 1.000 .756 1.000 .720 1.000 .721 1.000 .680 1.000 .668 1.000 .662 1.000 .666 1.000 .663 1.000 .722 1.000 .704 1.000 .744 1.000 .709 1.000 .742 1.000 .674 1.000 .738 1.000 .683 1.000 .801 1.000 .698 1.000 .719 1.000 .676 1.000 .725 1.000 .697 1.000 .687 1.000 .720 1.000 .634 1.000 .582 1.000 .635 1.000 .529 1.000 .668 1.000 .629 1.000 .744 1.000 .662 VAR00001 VAR00002 VAR00003 VAR00004 VAR00005 VAR00006 VAR00007 VAR00008 VAR00009 VAR00010 VAR00011 VAR00012 VAR00013 VAR00014 VAR00015 VAR00016 VAR00017 VAR00018 VAR00019 VAR00020 VAR00021 VAR00022 VAR00023 VAR00024 VAR00025 VAR00026 VAR00027 VAR00028 VAR00029 VAR00030 VAR00031 VAR00032 VAR00033 VAR00034 VAR00035 VAR00036 VAR00037 VAR00038 VAR00039 VAR00040 Initial Extraction
Total Variance Explained
Comp
onent Initial Eigenvalues
Extraction Sums of Squared
Loadings Rotation Sums of Squared Loadings
Total
% of Variance
Cumulative % Total
% of Variance
Cumulative
% Total % of Variance
Cumulative % 1 4.479 11.196 11.196 4.479 11.196 11.196 2.650 6.626 6.626 2 2.814 7.034 18.231 2.814 7.034 18.231 2.476 6.191 12.817 3 2.423 6.056 24.287 2.423 6.056 24.287 1.864 4.659 17.476 4 1.868 4.671 28.958 1.868 4.671 28.958 1.789 4.472 21.947 5 1.804 4.510 33.468 1.804 4.510 33.468 1.741 4.352 26.300 6 1.692 4.231 37.699 1.692 4.231 37.699 1.680 4.200 30.499 7 1.557 3.892 41.591 1.557 3.892 41.591 1.662 4.155 34.654 8 1.456 3.640 45.231 1.456 3.640 45.231 1.651 4.128 38.782 9 1.352 3.381 48.612 1.352 3.381 48.612 1.602 4.005 42.786 10 1.292 3.230 51.842 1.292 3.230 51.842 1.575 3.937 46.723 11 1.218 3.046 54.888 1.218 3.046 54.888 1.558 3.894 50.618 12 1.186 2.966 57.854 1.186 2.966 57.854 1.557 3.891 54.509 13 1.128 2.819 60.673 1.128 2.819 60.673 1.492 3.729 58.238 14 1.064 2.660 63.333 1.064 2.660 63.333 1.435 3.587 61.825 15 1.039 2.597 65.930 1.039 2.597 65.930 1.408 3.519 65.344 16 1.006 2.516 68.446 1.006 2.516 68.446 1.241 3.102 68.446 17 .932 2.329 70.775
18 .909 2.272 73.047 19 .873 2.183 75.229 20 .845 2.113 77.342 21 .761 1.902 79.244 22 .747 1.867 81.111 23 .681 1.703 82.813 24 .658 1.645 84.458 25 .635 1.588 86.046 26 .588 1.470 87.516 27 .567 1.417 88.934 28 .525 1.312 90.246 29 .485 1.212 91.458 30 .461 1.153 92.612 31 .441 1.101 93.713 32 .397 .992 94.705 33 .370 .924 95.629 34 .361 .903 96.533 35 .283 .708 97.241 36 .255 .636 97.877 37 .242 .605 98.482 38 .219 .548 99.031 39 .215 .537 99.568 40 .173 .432 100.000
Component Matrix(a)
Component
1 2 3 4 5 6 7 8 9 10 11 12 13 14 15 16
VAR00003 .552
VAR00024 .537 VAR00004
VAR00010 VAR00006 VAR00002
VAR00038 VAR00001
VAR00005 VAR00007
VAR00036
VAR00029 -.531
VAR00027 VAR00017
VAR00028 VAR00026
VAR00021 VAR00019
VAR00039
VAR00030 .601
VAR00015 VAR00037
VAR00018 VAR00014 VAR00012
VAR00011 VAR00016
VAR00031
VAR00009 .594
VAR00034 VAR00035
VAR00008 VAR00023
VAR00040 VAR00013
VAR00033 VAR00022
VAR00032 VAR00025
VAR00020
Rotated Component Matrix
Extraction Method: Principal Component Analysis. Rotation Method: Varimax with Kaiser Normalization.
a Rotation converged in 42 iterations
Component
1 2 3 4 5 6 7 8 9 10 11 12 13 14 15 16
VAR00003 .770
VAR00001 .672
VAR00002 .642
VAR00004 .610
VAR00006
VAR00027 .767
VAR00030 .746
VAR00028 .715
VAR00029 .667
VAR00015 .740
VAR00014 .730
VAR00005
VAR00037 .739
VAR00038 .631
VAR00018 .780
VAR00019
VAR00022 .713
VAR00017 .532
VAR00035
VAR00034
VAR00010 .736
VAR00024 .625
VAR00021 .790
VAR00023 .681
VAR00013 .763
VAR00007
VAR00036
VAR00016 .733
VAR00012 .525
VAR00040
VAR00011 .694
VAR00025 -.559
VAR00026
VAR00008 .782
VAR00009 .544
VAR00032 .761
VAR00033 .609
VAR00031 .787
VAR00039 .762
Component Transformation Matrix
.516 .280 .268 .319 .173 .243 .332 .206 .195 .161 .191 .171 .145 .178 .187 .153 -.330 -.602 -.148 .071 .336 .288 .091 .352 .083 .160 -.139 .040 .228 .041 .209 .151 -.408 .589 -.411 .381 .343 .026 -.112 -.014 -.158 .047 .031 -.018 .091 .028 .067 -.005 -.341 .060 .420 -.081 -.202 .052 -.259 -.090 .019 .440 .345 -.339 .150 .318 .152 .066 -.216 -.055 -.097 -.186 .149 -.364 .190 -.007 .300 -.150 .431 .397 .121 .401 -.288 -.043 -.266 .012 .309 -.050 .145 .125 .343 -.309 -.277 .368 -.134 .453 -.345 -.100 -.047 -.121 -.409 .116 .290 .279 -.359 -.050 .196 .049 .447 -.330 -.214 .089 .082 -.188 .246 -.143 -.003 .173 -.115 -.469 .314 .333 .068 -.337 .543 .023 .041 -.207 -.038 -.244 .085 -.026 .006 -.046 -.015 -.046 -.185 .438 -.049 -.422 -.287 -.319 .106 .267 .560 .018 .008 .087 .072 -.016 .160 .089 .219 -.467 .114 -.321 .066 .203 -.412 -.152 .481 -.082 -.189 .258 -.080 .333 .169 -.348 -.055 .237 -.201 .468 .041 .065 -.378 .185 .178 .071 -.441 .016 .067 -.030 .396 -.050 .513 -.059 -.282 -.042 -.113 -.379 -.172 -.036 -.011 .288 .238 -.399 .171 -.121 -.276 .255 -.190 .118 -.292 -.266 .341 .327 -.287 .207 -.015 .345 -.043 -.374 .106 .039 -.023 -.180 .013 -.286 -.308 .158 -.005 .268 .189 .393 .279 -.476 .366 -.229 -.021 -.008 .099 .065 .067 -.037 -.472 -.129 .178 -.121 -.059 .334 -.314 .017 .125 .681 .019 .180 -.246 -.414 -.198 -.162 .258 .015 -.136 .019 -.314 .047 .004 .397 .551 .150 Compo
1 2 3 4 5 6 7 8 9 10 11 12 13 14 15 16
1 2 3 4 5 6 7 8 9 10 11 12 13 14 15 16
Factor Analysis
Correlation Matrixa Determinant = 7.873E-04 a.
KMO and Bartlett's Test
.544
770.668 465 .000 Kaiser-Meyer-Olkin Measure of Sampling
Adequacy.
Approx. Chi-Square df
Sig. Bartlett's Test of
Sphericity Communalities 1.000 .652 1.000 .666 1.000 .683 1.000 .533 1.000 .620 1.000 .704 1.000 .676 1.000 .709 1.000 .658 1.000 .759 1.000 .578 1.000 .644 1.000 .561 1.000 .758 1.000 .685 1.000 .507 1.000 .622 1.000 .687 1.000 .702 1.000 .634 1.000 .697 1.000 .708 1.000 .627 1.000 .659 1.000 .631 1.000 .604 1.000 .698 1.000 .621 1.000 .644 1.000 .537 1.000 .661 VAR00001 VAR00002 VAR00003 VAR00004 VAR00008 VAR00009 VAR00010 VAR00011 VAR00012 VAR00013 VAR00014 VAR00015 VAR00016 VAR00017 VAR00018 VAR00020 VAR00021 VAR00022 VAR00023 VAR00024 VAR00025 VAR00027 VAR00028 VAR00029 VAR00030 VAR00031 VAR00032 VAR00033 VAR00037 VAR00038 VAR00039 Initial Extraction
Total Variance Explained
Extraction Method: Principal Component Analysis Comp
onent Initial Eigenvalues
Extraction Sums of Squared Loadings
Rotation Sums of Squared Loadings
Total % of Variance
Cumulative % Total
% of
Variance Cumulative % Total
% of Variance
Cumulative % 1 3.675 11.854 11.854 3.675 11.854 11.854 2.431 7.842 7.842 2 2.497 8.054 19.908 2.497 8.054 19.908 2.232 7.199 15.041 3 2.088 6.737 26.644 2.088 6.737 26.644 1.839 5.933 20.973 4 1.778 5.735 32.379 1.778 5.735 32.379 1.711 5.519 26.492 5 1.640 5.290 37.669 1.640 5.290 37.669 1.705 5.499 31.992 6 1.397 4.507 42.176 1.397 4.507 42.176 1.620 5.226 37.217 7 1.339 4.319 46.495 1.339 4.319 46.495 1.543 4.978 42.195 8 1.259 4.062 50.556 1.259 4.062 50.556 1.528 4.930 47.126 9 1.189 3.834 54.391 1.189 3.834 54.391 1.462 4.716 51.842 10 1.131 3.649 58.040 1.131 3.649 58.040 1.388 4.478 56.321 11 1.095 3.533 61.573 1.095 3.533 61.573 1.339 4.319 60.639 12 1.039 3.350 64.923 1.039 3.350 64.923 1.328 4.284 64.923
13 .979 3.159 68.082
14 .928 2.994 71.075
15 .903 2.913 73.988
16 .851 2.744 76.732
17 .779 2.512 79.244
18 .738 2.381 81.625
19 .676 2.180 83.805
20 .630 2.033 85.838
21 .600 1.934 87.772
22 .589 1.899 89.671
23 .505 1.629 91.300
24 .447 1.441 92.742
25 .429 1.385 94.127
26 .406 1.310 95.436
27 .392 1.263 96.700
28 .289 .931 97.631
29 .258 .833 98.464
30 .252 .813 99.277
Component Matrixa
.552 .524
.690 .674 .664 .587
.552
-.590 -.561
.648 VAR00024
VAR00003 VAR00038 VAR00004 VAR00039 VAR00033 VAR00020 VAR00027 VAR00030 VAR00029 VAR00028 VAR00001 VAR00002 VAR00012 VAR00015 VAR00014 VAR00008 VAR00009 VAR00010 VAR00016 VAR00021 VAR00013 VAR00023 VAR00037 VAR00032 VAR00011 VAR00017 VAR00018 VAR00031 VAR00025 VAR00022
1 2 3 4 5 6 7 8 9 10 11 12
Component
Extraction Method: Principal Component Analysis. 12 components extracted.
Rotated Component Matrix
Extraction Method: Principal Component Analysis. Rotation Method: Varimax with Kaiser Normalization. a Rotation converged in 42 iterations
Component
1 2 3 4 5 6 7 8 9 10 11 12
VAR00027 .770
VAR00028 .726
VAR00030 .719
VAR00029 .683
VAR00003 .764
VAR00001 .696
VAR00002 .690
VAR00004 .600
VAR00025 .667
VAR00037 .649
VAR00039 .634
VAR00038 .549
VAR00015 .765
VAR00014 .700
VAR00031
VAR00009 .789
VAR00008 .685
VAR00011 .747
VAR00012 .659
VAR00016
VAR00023 .738
VAR00021 .720
VAR00024 .696
VAR00010 .563
VAR00032 .733
VAR00033 .582
VAR00020 .555
VAR00017 .743
VAR00018 .655
VAR00013 .842
Component Transformation Matrix
.299 .474 .392 .236 .302 .258 .237 .332 .276 .183 .120 .169 .879 .017 .027 -.142 -.097 -.003 -.255 -.097 -.166 -.107 -.169 -.236 .104 -.650 .447 -.311 -.075 .212 .181 -.114 .161 .331 -.003 .196 .029 -.313 -.164 .642 -.051 .599 -.283 -.064 .061 -.109 .000 .033 .006 .300 .167 .078 -.780 -.073 -.106 -.271 .302 -.013 .173 .237 .052 .210 -.518 -.350 .196 .281 -.045 -.315 .363 .182 -.281 .317 .026 -.014 .148 .248 .077 -.087 .572 -.457 .152 -.402 -.407 -.128 .250 -.128 -.389 -.052 .004 .040 .446 -.093 .019 -.154 .731 -.001 .162 -.232 -.096 .357 .250 -.632 -.219 -.097 .435 .256 .074 .066 .039 .025 -.290 .190 -.336 .027 .361 .144 -.045 .628 -.218 -.411 -.033 .197 .160 .165 .210 .017 -.056 -.621 -.524 .393 .192 .093 -.179 .099 .175 -.180 .137 .190 -.214 -.240 .394 .027 .242 -.722 Component
1 2 3 4 5 6 7 8 9 10 11 12
1 2 3 4 5 6 7 8 9 10 11 12
Factor Analysis
Correlation Matrixa Determinant = 1.388E-03 a.
KMO and Bartlett's Test
.553
713.951 406 .000 Kaiser-Meyer-Olkin Measure of Sampling
Adequacy.
Approx. Chi-Square df
Sig. Bartlett's Test of
Sphericity Communalities 1.000 .671 1.000 .662 1.000 .680 1.000 .515 1.000 .666 1.000 .677 1.000 .684 1.000 .691 1.000 .724 1.000 .780 1.000 .621 1.000 .755 1.000 .767 1.000 .688 1.000 .470 1.000 .680 1.000 .817 1.000 .759 1.000 .670 1.000 .673 1.000 .707 1.000 .646 1.000 .671 1.000 .652 1.000 .749 1.000 .639 1.000 .659 1.000 .518 1.000 .674 VAR00001 VAR00002 VAR00003 VAR00004 VAR00008 VAR00009 VAR00010 VAR00011 VAR00012 VAR00013 VAR00014 VAR00015 VAR00017 VAR00018 VAR00020 VAR00021 VAR00022 VAR00023 VAR00024 VAR00025 VAR00027 VAR00028 VAR00029 VAR00030 VAR00032 VAR00033 VAR00037 VAR00038 VAR00039 Initial Extraction
Total Variance Explained
3.587 12.371 12.371 3.587 12.371 12.371 2.422 8.351 8.351 2.497 8.609 20.980 2.497 8.609 20.980 2.231 7.693 16.044 2.087 7.196 28.176 2.087 7.196 28.176 1.825 6.292 22.335 1.640 5.656 33.832 1.640 5.656 33.832 1.582 5.456 27.791 1.560 5.378 39.210 1.560 5.378 39.210 1.547 5.334 33.125 1.379 4.756 43.966 1.379 4.756 43.966 1.537 5.299 38.424 1.258 4.337 48.303 1.258 4.337 48.303 1.477 5.094 43.518 1.212 4.180 52.483 1.212 4.180 52.483 1.462 5.041 48.559 1.168 4.027 56.510 1.168 4.027 56.510 1.459 5.032 53.591 1.120 3.864 60.374 1.120 3.864 60.374 1.372 4.733 58.323 1.041 3.591 63.964 1.041 3.591 63.964 1.331 4.591 62.915 1.017 3.505 67.469 1.017 3.505 67.469 1.321 4.555 67.469
.933 3.216 70.686 .927 3.198 73.884 .830 2.861 76.745 .822 2.833 79.578 .690 2.378 81.956 .661 2.278 84.235 .644 2.220 86.455 .594 2.049 88.504 .516 1.778 90.282 .452 1.558 91.840 .447 1.543 93.383 .414 1.426 94.809 .396 1.367 96.175 .342 1.180 97.355 .277 .955 98.310 .258 .890 99.200 .232 .800 100.000 Component 1 2 3 4 5 6 7 8 9 10 11 12 13 14 15 16 17 18 19 20 21 22 23 24 25 26 27 28 29
Total % of Variance Cumulative % Total % of Variance Cumulative % Total % of Variance Cumulative % Initial Eigenvalues Extraction Sums of Squared Loadings Rotation Sums of Squared Loadings
Component Matrixa
.558 .524
.691 .674 .664 .586
-.601
.553 .525 .517
.757
-.546 VAR00024
VAR00003 VAR00038 VAR00010 VAR00004 VAR00039 VAR00020 VAR00027 VAR00030 VAR00029 VAR00028 VAR00001 VAR00002 VAR00008 VAR00009 VAR00018 VAR00012 VAR00014 VAR00015 VAR00025 VAR00011 VAR00013 VAR00037 VAR00023 VAR00017 VAR00032 VAR00033 VAR00021 VAR00022
1 2 3 4 5 6 7 8 9 10 11 12
Component
Extraction Method: Principal Component Analysis. 12 components extracted.
Rotated Component Matrixa .765 .743 .706 .695 .760 .714 .676 .595 .669 .652 .631 .555 .761 .748 .842 .748 .728 .678 .778 .750 .719 .706 .790 .613 .739 .675 .861 .861 VAR00027 VAR00030 VAR00029 VAR00028 VAR00003 VAR00001 VAR00002 VAR00004 VAR00025 VAR00037 VAR00039 VAR00038 VAR00008 VAR00009 VAR00015 VAR00014 VAR00024 VAR00010 VAR00023 VAR00021 VAR00012 VAR00011 VAR00032 VAR00033 VAR00020 VAR00017 VAR00018 VAR00022 VAR00013
1 2 3 4 5 6 7 8 9 10 11 12
Component
Extraction Method: Principal Component Analysis. Rotation Method: Varimax with Kaiser Normalization.
Rotation converged in 11 iterations. a.
Component Transformation Matrix
.295 .489 .401 .263 .177 .373 .276 .200 .272 .174 .182 .140 .880 .015 .029 -.089 -.150 -.066 -.260 -.011 -.171 -.101 -.241 -.155 .111 -.663 .435 -.070 -.279 -.129 .165 .233 .170 .323 .213 -.008 .043 .195 .112 -.713 .338 -.379 -.101 .117 .320 -.091 .175 .127 .067 -.399 -.145 .171 .628 .158 -.064 .528 -.014 -.233 -.169 .040 .096 .131 -.609 .179 -.278 -.160 -.099 .410 .383 .136 .308 -.175 .204 -.113 -.333 -.027 -.071 -.015 .183 -.104 -.067 .109 .000 .877 -.019 -.091 -.030 .019 .246 .237 -.654 -.254 .154 .596 .021 .050 .156 -.233 -.028 .293 .160 -.124 .095 -.554 .596 -.341 .054 -.055 .080 -.041 -.300 -.294 .156 .132 .539 -.113 .140 .421 -.428 -.300 -.095 .174 .184 .377 .061 -.650 -.046 .126 .085 .243 -.509 .121 .169 -.002 -.093 .182 .403 -.365 .204 -.185 -.458 .233 .514 -.172 Component 1 2 3 4 5 6 7 8 9 10 11 12
1 2 3 4 5 6 7 8 9 10 11 12
Factor Analysis
Correlation Matrixa Determinant = 1.835E-03 a.
KMO and Bartlett's Test
.557
685.740 378 .000 Kaiser-Meyer-Olkin Measure of Sampling
Adequacy.
Approx. Chi-Square df
Sig. Bartlett's Test of
Sphericity Communalities 1.000 .546 1.000 .635 1.000 .696 1.000 .541 1.000 .665 1.000 .656 1.000 .679 1.000 .687 1.000 .682 1.000 .792 1.000 .594 1.000 .670 1.000 .752 1.000 .687 1.000 .615 1.000 .626 1.000 .757 1.000 .654 1.000 .660 1.000 .706 1.000 .645 1.000 .657 1.000 .644 1.000 .710 1.000 .586 1.000 .637 1.000 .506 1.000 .668 VAR00001 VAR00002 VAR00003 VAR00004 VAR00008 VAR00009 VAR00010 VAR00011 VAR00012 VAR00013 VAR00014 VAR00015 VAR00017 VAR00018 VAR00021 VAR00022 VAR00023 VAR00024 VAR00025 VAR00027 VAR00028 VAR00029 VAR00030 VAR00032 VAR00033 VAR00037 VAR00038 VAR00039 Initial Extraction
Total Variance Explained
3.474 12.406 12.406 3.474 12.406 12.406 2.443 8.725 8.725 2.487 8.881 21.286 2.487 8.881 21.286 2.161 7.719 16.444 2.080 7.427 28.713 2.080 7.427 28.713 1.824 6.516 22.960 1.624 5.801 34.515 1.624 5.801 34.515 1.609 5.747 28.707 1.557 5.561 40.076 1.557 5.561 40.076 1.567 5.596 34.303 1.346 4.807 44.883 1.346 4.807 44.883 1.521 5.433 39.737 1.250 4.465 49.348 1.250 4.465 49.348 1.516 5.414 45.151 1.212 4.329 53.677 1.212 4.329 53.677 1.507 5.383 50.534 1.167 4.169 57.846 1.167 4.169 57.846 1.453 5.191 55.725 1.118 3.994 61.840 1.118 3.994 61.840 1.438 5.137 60.862 1.039 3.711 65.551 1.039 3.711 65.551 1.313 4.689 65.551
.998 3.563 69.114 .927 3.312 72.426 .835 2.983 75.409 .825 2.945 78.354 .719 2.566 80.920 .670 2.392 83.312 .644 2.300 85.612 .621 2.219 87.831 .539 1.924 89.755 .461 1.646 91.401 .452 1.613 93.014 .414 1.479 94.493 .399 1.425 95.918 .354 1.264 97.182 .278 .993 98.175 .261 .934 99.109 .250 .891 100.000 Component
1 2 3 4 5 6 7 8 9 10 11 12 13 14 15 16 17 18 19 20 21 22 23 24 25 26 27 28
Total % of Variance Cumulative % Total % of Variance Cumulative % Total % of Variance Cumulative % Initial Eigenvalues Extraction Sums of Squared Loadings Rotation Sums of Squared Loadings
Component Matrixa
.560 .511
.681 .663 .653 .574
-.582
.552
.769 -.549 VAR00024
VAR00003 VAR00038 VAR00010 VAR00037 VAR00039 VAR00027 VAR00030 VAR00029 VAR00028 VAR00022 VAR00001 VAR00004 VAR00002 VAR00008 VAR00009 VAR00018 VAR00012 VAR00014 VAR00015 VAR00025 VAR00011 VAR00013 VAR00023 VAR00017 VAR00032 VAR00033 VAR00021
1 2 3 4 5 6 7 8 9 10 11
Component
Extraction Method: Principal Component Analysis. 11 components extracted.
Rotated Component Matrixa .750 .748 .700 .691 .801 .697 .678 .612 .698 .629 .626 .540 .781 .735 .789 .692 .714 .609 .715 .662 .795 .722 .805 .599 .757 .633 .868 VAR00027 VAR00030 VAR00029 VAR00028 VAR00003 VAR00001 VAR00002 VAR00004 VAR00025 VAR00037 VAR00039 VAR00038 VAR00015 VAR00014 VAR00008 VAR00009 VAR00033 VAR00022 VAR00032 VAR00024 VAR00010 VAR00023 VAR00021 VAR00017 VAR00018 VAR00011 VAR00012 VAR00013
1 2 3 4 5 6 7 8 9 10 11
Component
Extraction Method: Principal Component Analysis. Rotation Method: Varimax with Kaiser Normalization.
Rotation converged in 15 iterations. a.
Component Transformation Matrix
.327 .471 .413 .188 .259 .281 .359 .299 .205 .201 .135 .874 .007 -.008 -.151 -.082 -.264 -.057 -.282 -.167 -.006 -.163 .123 -.651 .430 -.276 -.098 .221 -.171 .146 .365 .242 -.015 .043 .198 .152 .455 -.722 .169 -.377 -.066 -.008 .106 .148 .081 -.433 -.217 .640 .231 -.033 .162 -.061 -.194 .477 .004 .110 .200 -.625 -.241 .062 .464 -.228 -.073 .276 .382 -.020 .188 -.154 -.241 -.045 -.018 -.149 .019 .192 .083 -.177 .885 -.007 -.061 .008 .249 .059 .053 .206 -.639 .616 -.311 .030 .196 -.183 -.044 .215 .233 .584 -.235 .133 -.248 -.584 -.089 .139 -.054 -.317 .224 -.200 -.272 .075 .577 .438 -.209 -.373 -.021 .158 .153 .176 .491 -.343 -.717 .019 .208 .049 .036 Component 1 2 3 4 5 6 7 8 9 10 11
1 2 3 4 5 6 7 8 9 10 11
Factor Analysis
Correlation Matrixa Determinant = 2.777E-03 a.
KMO and Bartlett's Test
.577
642.592 351 .000 Kaiser-Meyer-Olkin Measure of Sampling
Adequacy.
Approx. Chi-Square df
Sig. Bartlett's Test of
Sphericity Communalities 1.000 .611 1.000 .640 1.000 .696 1.000 .531 1.000 .665 1.000 .667 1.000 .677 1.000 .664 1.000 .725 1.000 .790 1.000 .672 1.000 .715 1.000 .762 1.000 .684 1.000 .732 1.000 .746 1.000 .765 1.000 .667 1.000 .661 1.000 .701 1.000 .647 1.000 .661 1.000 .663 1.000 .536 1.000 .672 1.000 .501 1.000 .637 VAR00001 VAR00002 VAR00003 VAR00004 VAR00008 VAR00009 VAR00010 VAR00011 VAR00012 VAR00013 VAR00014 VAR00015 VAR00017 VAR00018 VAR00021 VAR00022 VAR00023 VAR00024 VAR00025 VAR00027 VAR00028 VAR00029 VAR00030 VAR00033 VAR00037 VAR00038 VAR00039 Initial Extraction
Total Variance Explained
3.433 12.713 12.713 3.433 12.713 12.713 2.411 8.928 8.928 2.476 9.172 21.885 2.476 9.172 21.885 2.153 7.973 16.901 2.058 7.623 29.508 2.058 7.623 29.508 1.833 6.789 23.689 1.573 5.828 35.336 1.573 5.828 35.336 1.553 5.751 29.441 1.542 5.711 41.046 1.542 5.711 41.046 1.539 5.699 35.140 1.326 4.910 45.956 1.326 4.910 45.956 1.525 5.648 40.788 1.250 4.630 50.587 1.250 4.630 50.587 1.463 5.420 46.208 1.208 4.474 55.061 1.208 4.474 55.061 1.452 5.376 51.585 1.133 4.198 59.259 1.133 4.198 59.259 1.431 5.301 56.886 1.060 3.925 63.184 1.060 3.925 63.184 1.415 5.239 62.125 1.027 3.804 66.987 1.027 3.804 66.987 1.313 4.862 66.987
.941 3.484 70.472 .855 3.167 73.639 .829 3.070 76.709 .719 2.661 79.370 .717 2.657 82.027 .644 2.386 84.413 .639 2.365 86.778 .568 2.103 88.882 .472 1.748 90.629 .458 1.698 92.327 .428 1.586 93.913 .400 1.482 95.395 .371 1.376 96.770 .342 1.267 98.038 .276 1.023 99.061 .253 .939 100.000 Component
1 2 3 4 5 6 7 8 9 10 11 12 13 14 15 16 17 18 19 20 21 22 23 24 25 26 27
Total % of Variance Cumulative % Total % of Variance Cumulative % Total % of Variance Cumulative % Initial Eigenvalues Extraction Sums of Squared Loadings Rotation Sums of Squared Loadings
Component Matrixa
.569 .511
.673 .667 .660 .566
.589 .529
.524
.503
.767
-.548 VAR00024
VAR00003 VAR00010 VAR00038 VAR00037 VAR00039 VAR00027 VAR00030 VAR00029 VAR00028 VAR00001 VAR00004 VAR00002 VAR00015 VAR00014 VAR00012 VAR00018 VAR00009 VAR00008 VAR00011 VAR00025 VAR00022 VAR00013 VAR00023 VAR00017 VAR00021 VAR00033
1 2 3 4 5 6 7 8 9 10 11
Component
Extraction Method: Principal Component Analysis. 11 components extracted.
Rotated Component Matrixa .770 .761 .697 .696 .792 .712 .668 .619 .694 .636 .605 .576 .785 .709 .811 .799 .736 .671 .772 .766 .763 .695 .736 .645 .821 .597 .866 VAR00027 VAR00030 VAR00028 VAR00029 VAR00003 VAR00001 VAR00002 VAR00004 VAR00025 VAR00037 VAR00039 VAR00038 VAR00008 VAR00009 VAR00015 VAR00014 VAR00024 VAR00010 VAR00023 VAR00021 VAR00012 VAR00011 VAR00022 VAR00033 VAR00017 VAR00018 VAR00013
1 2 3 4 5 6 7 8 9 10 11
Component
Extraction Method: Principal Component Analysis. Rotation Method: Varimax with Kaiser Normalization.
Rotation converged in 12 iterations. a.
Component Transformation Matrix
.339 .480 .418 .276 .170 .391 .268 .203 .246 .177 .130 .864 -.019 .005 -.110 -.170 -.088 -.283 -.005 -.260 -.171 -.166 .090 -.658 .439 -.036 -.305 -.113 .166 .262 .200 .351 -.012 .045 -.128 .085 -.452 .679 -.137 -.075 .467 .054 -.197 .159 .066 -.413 -.377 .624 .207 .326 -.033 .318 -.059 -.161 -.112 .106 .259 -.555 -.060 -.270 -.281 -.010 .450 .446 .236 .031 .184 -.157 -.227 -.011 -.052 .045 .181 -.165 -.168 .073 .890 -.048 -.007 -.013 -.016 .176 .226 -.696 -.059 -.057 .647 .072 .048 -.093 .174 .265 .041 -.204 -.408 -.290 .648 -.359 .215 .239 -.220 -.306 -.304 .268 .283 .301 -.465 .392 .174 -.256 .131 .033 -.001 .388 .406 -.669 .198 -.194 -.145 .336 -.090 Component 1 2 3 4 5 6 7 8 9 10 11
1 2 3 4 5 6 7 8 9 10 11
ANACOR
_
A N A C O R - VERSION 0.4 BY
DEPARTMENT OF DATA THEORY
UNIVERSITY OF LEIDEN, THE NETHERLANDS
The table to be analyzed:
1 2 3
tserba_x giant Hero Margin
1 187 301 232 720 2 240 263 216 719 3 224 219 277 720 4 298 279 143 720 5 244 256 220 720 6 273 236 211 720 7 229 230 261 720 8 297 254 169 720 9 245 220 249 714 10 222 260 237 719 11 275 256 189 720 --- --- --- --- Margin 2734 2774 2404 7912
The Rowprofiles:
1 2 3
tserba_x giant Hero Margin
1 .260 .418 .322 1.000 2 .334 .366 .300 1.000 3 .311 .304 .385 1.000 4 .414 .388 .199 1.000 5 .339 .356 .306 1.000 6 .379 .328 .293 1.000 7 .318 .319 .363 1.000 8 .413 .353 .235 1.000 9 .343 .308 .349 1.000 10 .309 .362 .330 1.000 11 .382 .356 .263 1.000 --- --- ---
The Columnprofiles:
1 2 3
tserba_x giant Hero Margin
1 .068 .109 .097 .091 2 .088 .095 .090 .091 3 .082 .079 .115 .091 4 .109 .101 .059 .091 5 .089 .092 .092 .091 6 .100 .085 .088 .091 7 .084 .083 .109 .091 8 .109 .092 .070 .091 9 .090 .079 .104 .090 10 .081 .094 .099 .091 11 .101 .092 .079 .091 --- --- ---
Margin 1.000 1.000 1.000
Dimension Singular Inertia Proportion Cumulative Value Explained Proportion 1 .11808 .01394 .768 .768 2 .06487 .00421 .232 1.000 --- --- --- Total .01815 1.000 1.000
Row Scores:
Row Marginal Dim
Profile 1 2
Contribution of row points to the inertia of each dimension:
Row Marginal Dim
Profile 1 2
1 .091 .052 .593 2 .091 .000 .024 3 .091 .178 .083 4 .091 .347 .015 5 .091 .000 .003 6 .091 .011 .074 7 .091 .096 .033 8 .091 .180 .024 9 .090 .042 .114 10 .091 .032 .034 11 .091 .061 .003 --- --- 1.000 1.000
Contribution of dimensions to the inertia of each row point:
Row Marginal Dim Total Profile 1 2
1 .091 .225 .775 1.000 2 .091 .003 .997 1.000 3 .091 .877 .123 1.000 4 .091 .987 .013 1.000 5 .091 .266 .734 1.000 6 .091 .332 .668 1.000 7 .091 .906 .094 1.000 8 .091 .961 .039 1.000 9 .090 .551 .449 1.000 10 .091 .755 .245 1.000 11 .091 .986 .014 1.000
Column Scores:
Column Marginal Dim
Profile 1 2
1 tserba_x .346 .333 -.249 2 giant .351 .105 .338 3 Hero .304 -.500 -.107
Contribution of column points to the inertia of each dimension:
Column Marginal Dim
Profile 1 2
Contribution of dimensions to the inertia of each column point:
Column Marginal Dim Total Profile 1 2
1 tserba_x .346 .765 .235 1.000 2 giant .351 .149 .851 1.000 3 Hero .304 .976 .024 1.000
Variances and Correlation Matrix of the singular values:
Dim Variances Correlations between dimensions 1 1.175E-04 1.000
2 1.254E-04 -.014 1.000
Variances and Correlation Matrix of scores of Row 1
Dim Variances Correlations between dimensions 1 .019 1.000
2 .004 .511 1.000
Variances and Correlation Matrix of scores of Row 2
Dim Variances Correlations between dimensions 1 7.483E-04 1.000
2 1.376E-04 .125 1.000
Variances and Correlation Matrix of scores of Row 3
Dim Variances Correlations between dimensions 1 .003 1.000
2 .003 -.854 1.000
Variances and Correlation Matrix of scores of Row 4
Dim Variances Correlations between dimensions 1 .001 1.000
2 .006 -.563 1.000
Variances and Correlation Matrix of scores of Row 5
Dim Variances Correlations between dimensions 1 1.185E-04 1.000
Variances and Correlation Matrix of scores of Row 6
Dim Variances Correlations between dimensions 1 .002 1.000
2 6.192E-04 .592 1.000
Variances and Correlation Matrix of scores of Row 7
Dim Variances Correlations between dimensions 1 .001 1.000
2 .002 -.844 1.000
Variances and Correlation Matrix of scores of Row 8
Dim Variances Correlations between dimensions 1 .001 1.000
2 .003 .755 1.000
_
Variances and Correlation Matrix of scores of Row 9
Dim Variances Correlations between dimensions 1 .004 1.000
2 .001 -.705 1.000
Variances and Correlation Matrix of scores of Row 10
Dim Variances Correlations between dimensions 1 .001 1.000
2 7.727E-04 .833 1.000
Variances and Correlation Matrix of scores of Row 11
Dim Variances Correlations between dimensions 1 2.767E-04 1.000
2 .001 .567 1.000
Variances and Correlation Matrix of scores of Column 1 tserba_x
Dim Variances Correlations between dimensions 1 .003 1.000
Variances and Correlation Matrix of scores of Column 2 giant
Dim Variances Correlations between dimensions 1 .005 1.000
2 9.932E-04 -.366 1.000
Variances and Correlation Matrix of scores of Column 3 Hero
Dim Variances Correlations between dimensions 1 .001 1.000
2 .003 -.673 1.000
_
The data-matrix permuted according to the scores in dimension: 1
3 2 1
Hero giant tserba_x Margin
3 277 219 224 720 7 261 230 229 720 1 232 301 187 720 9 249 220 245 714 10 237 260 222 719 5 220 256 244 720 2 216 263 240 719 6 211 236 273 720 11 189 256 275 720 8 169 254 297 720 4 143 279 298 720 --- --- --- --- Margin 2404 2774 2734 7912
The data-matrix permuted according to the scores in dimension: 2
1 3 2
tserba_x Hero giant Margin
Row Scores
Canonical Normalization Dimension 1
.8 .6 .4 .2 -.0 -.2 -.4 -.6
Dimension 2
.8
.6
.4
.2
0.0
-.2
-.4
11 10
9
8 7
6 5
4
3
2 1
Column Scores
Canonical Normalization Dimension 1
.4 .2
-.0 -.2
-.4 -.6
Dimension 2
.4
.3
.2
.1
-.0
-.1
-.2
-.3 Hero
giant
Row and Column Scores
Canonical Normalization Dimension 1
.8 .6 .4 .2 -.0 -.2 -.4 -.6 .8
.6
.4
.2
0.0
-.2
-.4
Columns
Rows Hero
giant
tserba_x 11 10
9
8 7
6 5
4
3
Data Supermarket-Supermarket Yang Sering Dikunjungi Responden
Nama Supermarket
Jumlah responden
Hero Supermarket
41
Giant Hypermarket
53
711 9
Premier 7
Alfa Supermarket
5
Data Karakteristik Demografi Kuesioner Kedua
Variabel Demografi Keterangan Jumlah responden
Jenis kelamin Pria 39
Wanita 81
Usia 11-25 tahun 47
26-40 tahun 50
41- 55 tahun 21
56-70 tahun 2
Pekerjaan Ibu rumah tangga 41
Pelajar/Mahasiswa 33
Pegawai swasta 29
Pegawai negeri 5
TNI/polri 4
Pensiunan 2
Wiraswasta 6
Pendidikan SMP 5
SMA 51
Diploma 21
Sarjana 39
Pasca Sarjana 4
Penghasilan < Rp1.000.000 37 perbulan Rp 1.000.000 - Rp. 2.500.000 49 Rp 2.500.001 - Rp 4.000.000 19 Rp 4.000.001 - Rp 5.500.000 8 Rp 5.500.001 - Rp 7.000.000 5
> Rp 7.000.000 2
Frekuensi belanja 1 - 4 kali 38
perbulan 5 - 8 kali 44
9 - 12 kali 32
KUESIONER PENDAHULUAN
Dengan hormat,Saya menyadari waktu dari Bapak/Ibu, Saudara/Saudari sekalian sangat terbatas. Namun saya mohon kesediaan Anda untuk dapat membantu dengan mengisi kuesioner ini sebagai bahan masukan dan data untuk tugas penelitian penulis. Penelitian ini ditujukan untuk penyusunan Tugas Akhir dalam memenuhi persyaratan Ujian Sidang Sarjana Penulis pada Fakultas Teknik – Jurusan Teknik Industri Universitas Kristen Maranatha, Bandung. Oleh karena itu, penulis mohon agar Anda bersedia untuk menjawab setiap pertanyaan dalam kuesioner penelitian ini dengan baik dan benar. Atas kesediaan Anda untuk mengisi kuesioner ini, sebelum dan sesudahnya penulis mengucapkan terima kasih.
Penulis,
Mirna Setiawan
Petunjuk pengisian
:
Dibawah ini terdapat faktor-faktor yang mendorong Anda untuk berbelanja di suatu
toserba/supermarket/hypemarket. Anda diminta untuk menilai seberapa penting
faktor-faktor tersebut.
Mohon dijawab dengan cara memberi tanda ( X ) pada kolom jawaban yang
telah tersedia.
Keterangan : STP
= Sangat tidak penting.
TP
= Tidak penting.
P
= Penting.
SP
= Sangat Penting.
No Atribut STP TP P SP
1 Kelengkapan produk-produk yang dijual.
2 Produk yang dijual tersedia dalam berbagai pilihan merk yang terkenal.
3 Produk-produk yang dijual memiliki kualitas baik.
4 Produk-produk ditata dengan rapi,teratur sesuai jenisnya didalam rak pajangan.
5 Produk-produk yang akan dibeli selalu tersedia.
6 Jam buka Toserba/ supermarket/ hypermarket yang relatif panjang. 7 Pemberian pelayananan pembawaan barang belanjaan sampai ke mobil anda 8 Harga jual produk lebih murah dibanding Toserba / supermarket / hypermarket lainnya. 9 Harga jual produk sudah sesuai dengan jenis dan kualitas produk yang dijual 10 Label Harga tertera dengan jelas pada produk& dapat dicheck dengan scanner harga. 11 Adanya obral / diskon untuk produk-produk yang dijual pada saat tertentu. 12 Pemberian member card yang dapat digunakan untuk kartu diskon. 13 Pemberian kupon undian berhadiah,voucher belanja atas pengumpulan poin belanja 14 Toserba/supermarket/hypermarket sering mengadakan perlombaan, demo masak, quiz. 15 Adanya promosi produk-produk melalui surat kabar& majalah.
16 Adanya promosi produk-produk melalui televisi.
17 Adanya promosi produk-produk melalui radio.
No Atribut STP TP P SP
19 Adanya promosi produk-produk melalui spanduk.
20 Adanya Sales Promotion Girl (SPG) yang menawarkan produk-produk baru.
21 Kelancaran arus lalu lintas disekitar lokasi
22 Kemudahan transportasi menuju lokasi (baik dengan angkutan umum & mobil pribadi) 23 Lokasi toserba /supermarket / hypermarket dekat dengan tempat tinggal Anda. Lokasi toserba/ supermarket / hypermarket dekat dengan tempat hiburan (game center, 24
bioskop, dan lain-lain).
25 Lokasi toserba / supermarket / hypermarket dekat dengan pusat perbelanjaan lainnya. Keramahan dan kecekatan petugas toserba/supermarket /hypermarket 26
dalam melayani konsumen
Kesediaan petugas toserba/ supermarket / hypermarket memberikan informasi bila 27
konsumen bertanya
28 Keramahan petugas kasir dalam melayani konsumen
29 Kecepatan pelayanan yang diberikan oleh petugas kasir
30 Tersedia fasilitas parkir yang luas dan aman.
31 Tersedia fasilitas toilet yang bersih.
32 Tersedianya fasilitas ATM.
33 Tersedianya fasilitas AC yang sejuk.
34 Tersedianya fasilitas penerangan yang berfungsi dengan baik.
35 Tersedianya kantin/food court
36 Tersedianya papan informasi yang memuat lokasi produk-produk yang dijual 37 Tersedianya keranjang dan troli yang cukup untuk berbelanja.
38 Tersedianya pelayanan komplain bagi pelanggan.
39 Tersedianya kotak saran untuk menampung kritik, saran dan masukan dari konsumen.
40 Tersedianya tempat penitipan barang luas dan aman.
41 Kebersihan di dalam dan di luar ruangan toserba/ supermarket/ hypermarket.
42 Suasana yang nyaman dan tenang untuk berbelanja.
43 Penataan dekorasi interior yang indah, pemilihan warna & hiasan-hiasan yang menarik) 44 Keleluasaan dalam berbelanja (gang lebar,rak pajangan rapi, penataan ruangan rapi) 45 Pembayaran dapat dilakukan dengan debet dan kartu kredit. 46 Kemudahan penukaran barang apabila barang yang anda beli ternyata rusak.
Menurut Anda, selain faktor-faktor diatas apakah masih terdapat faktor-faktor yang
mendorong Anda untuk berbelanja disuatu Toserba/<