Accounting Information Systems for A Distribution
Email: Alexander [AT] petra.ac.idSilvia Rostianingsih
Abstract— A distribution company with consigned goods needs to record their transactions. They need to view a flexible consignment report, value-added tax (VAT) excluded price, and pricing based on first in first out (FIFO) method. Based on this background, a structural accounting information system is designed to meet the company’s requirements. The system was build using PHP language and MySQL database.
The results obtained from the system are master recording for suppliers, customers, salespersons, and goods data. Transactions include purchases, purchase returns, sales, sales returns, and consignment. All transactions are integrated with inventory stock card and the journal. This software also generates financial statement such as income statement, owner’s equity statement, and balance sheet.
Keywords-accounting information system; financial statement; income statement; balance sheet
I. INTRODUCTION
A distribution company receives their goods from consignment process. The goods are sent in larger units, e.g. boxes. If customers want to buy goods in smaller unit, the company will buy one box from supplier then sell some pieces to customer. The other goods which were not sold will be the company’s inventory. If there is a tender, the company may provide custom goods based on customer’s request.
In doing their business process, all transactions are already recorded, but the consignment process is not flexible. One of the examples is the recording of sold goods can only be seen monthly, e.g. the company sold 3 boxes of goods in the first week of June, then they sold another 2 boxes in the second week, it can only be seen as 5 boxes sold in a month. Because of the weekly payment method, the company needs to view the sales weekly. Other problems are the value-added tax (VAT)
didn’t show on payment and price differences between
transfer-in and transfer-out process.
II. THEORETICAL FOUNDATIONS
A. Accounting
Accounting is an information system, which measures business activities, processes data into reports, and communicates results to decision makers [5].
1) Charts of Accounts
A list of the accounts in the ledger is called a chart of accounts (COA). The accounts are normally listed in the order in which they appear in the financial statements [1]. Organizations use COA to list all of their accounts and account numbers.
2) Financial Statements
Companies prepare four financial statements from the summarized accounting data [3]:
An income statement presents the revenues and expenses and resulting net income or net loss for a specific period of time.
An owner’s equity statement summarizes the changes
in owner’s equity for a specific period of time.
A balance sheet reports the assets, liabilities, and owner’s equity at a specific date.
A statement of cash flows summarizes information about the cash inflows and outflows for a specific period of time.
B. Accounting Information Systems
Accounting information systems (AIS) collects, records, stores, and processes accounting and other data to produce information for decision makers [4]. There are six components of an AIS:
The people who use the system
The procedures and instructions used to collect, process, and store data
The software used to process the data
The information technology infrastructure, including the computers, peripheral devices, and network communications devices used in the AIS
The internal controls and security measures that safeguard AIS data
These six components enable an AIS to fulfill three important business functions:
Collect and store data about organizational activities, resources, and personnel.
Transform data into information so management can plan, execute, control, and evaluate activities, resources, and personnel.
Provide adequate controls to safeguard the organization’s assets and data.
III. SYSTEMS ANALYSIS
A. Business Process Analysis
1) Consignment Process
Supplier will send goods weekly with memo listing each goods sent and the amount. Warehouse staffs will check the items received then store them in the warehouse.
2) Sales Process
Customers will order goods through the salesman who visit them regularly. The salesman will make a sales order which will be given to the sales counter staff. Sales counter staff will check the amount of inventories. If it is not enough, the company will order some goods to the supplier first. If it is enough, the sales counter staff will check the customer’s credit limit. If the credit limit is not maxed, the sales counter staff
After analyzing the old systems and the problems, parts of the systems that need to be improved are:
Customizable consignment report that can be viewed based on specific time period, so the company can view the report either weekly or monthly
Systems which show goods price without VAT and the total amount of VAT, because the existing systems only display VAT inclusive price.
Systems which adjust purchase price, because there might be a difference on transfer-in and transfer-out price if there is a price change mid-period.
IV. SYSTEMS DESIGN
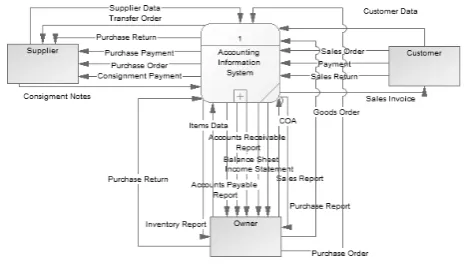
A. Data Flow Diagram (DFD)
A data flow diagram (DFD) graphically describes the flow of data within an organization. The highest-level DFD is referred to as a context diagram because it provides the reader with a summary-level view of a system [4]. In accounting company. Context diagram for this system is shown in Figure 1.
Figure 1. Context diagram
B. Entity Relationship Diagram (ERD)
An entity-relationship diagram (ERD) is a graphical representation of an entity-relationship model (E-R model) which is a detailed, logical representation of the data for an organization or for a business area [2].
V. IMPLEMENTATION
A. Purchase Order
Purchase order process is the process of recording order request for the supplier. In purchase order form, user can input data of goods the company want to purchase.
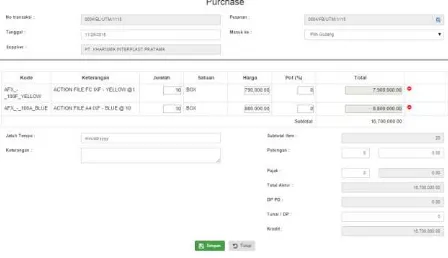
B. Purchase
Figure 2. Purchase form
C. Consignment Goods Received
In consignment goods received form, user can input data of goods received from supplier, which is shown in Figure 3. Data will also be added to inventory stock card and posted to journal.
Figure 3. Consignment goods received form
D. Consignment List
Consignment list shows detail of each consignment transaction, which is shown in Figure 4.
Figure 4. Consignment list
E. Sales Order
Sales order process is the process of recording order request from the customer. In sales order form, user can input data of goods the customer requested.
F. Sales
In sales form, user can choose a sales order which is already made. After choosing the sales order, list of goods from that order will be added to the sales detail, which is shown in Figure 5. After sales data is added, data will be added to inventory stock card and posted to journal as well.
Figure 5. Sales form
G. Account Receivable Payment
Data for account receivable payment can be recorded using account receivable payment form, which is shown in Figure 6.
Figure 6. Account receivable payment form
H. Reporting
1) Sales and Purchase Reports
This software provides sales and purchase reports so the owner can look at the summary of sales or purchase transactions in a specific period.
2) Inventory Report
This software provides inventory report which contains the amount of each item and total amount of all items.
Account payable and account receivable reports contain data of all debts with the due dates.
4) General Ledger
A general ledger contains all accounts with their balances, as shown in Figure 7.
Figure 7. General ledger
5) Trial Balance
A trial balance is a list of accounts and their balances in a specific period, as shown in Figure 8.
Figure 8. Trial balance
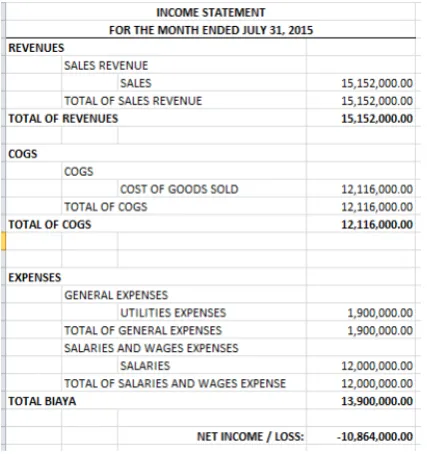
6) Income Statement
The income statement reports the revenues and expenses for a specific period of time, as shown in Figure 9. Segmented income statement based on location is shown in Figure 10.
Figure 9. Income statement
Figure 10. Segmented income statement
7) Owner’s Equity Statement
The owner’s equity statement reports the changes in owner’s equity for a specific period of time, as shown in Figure 11.
Figure 11. Owner’s equity statement
8) Balance Sheet
Balance sheet reports the assets, liabilities, and owner’s equity at specific date, as shown in Figure 12.
Figure 12. Balance Sheet
VI. CONCLUSION
All transactions are already integrated with the inventory stock card and journal.
The software can provide reliable financial statements, including income statement, balance sheet, and owner’s equity statement.
Based on the questionnaire, 87,5% user thought that in general this software is good.
REFERENCES
[1] C. S. Warren, J. M. Reeve, and J. E. Duchac, Financial Accounting, 12th ed. United States: Cengage Learning, p. 52.
[2] J. A. Hoffer, V. Ramesh, and H. Topi, Modern Database Management, 10th ed. United States: Pearson Prentice Hall, p. 59.
[3] J. J. Weygandt, P. D. Kimmel, and D. E. Kieso, Accounting Principles, 12th ed. United States: John Wiley & Sons, Inc. p. 21.
[4] M. B. Romney and P. J. Steinbart, Accounting Information Systems, 12th ed. United States: Pearson Prentice Hall, pp. 30, 70-72.