Organized by
Supported by
In Collaboration with
CONFERENCE INFORMATION
PAPERS BY SESSION
PAPERS BY AUTHOR
SEARCH
GETTING STARTED
TRADEMARKS
2017 International Conference on
Soft Computing, Intelligent System and Information Technology
Proceedings
2017 International Conference
on Soft Computing, Intelligent System
and Information Technology
ICSIIT 2017
Proceedings
2017 International Conference
on Soft Computing, Intelligent System
and Information Technology
ICSIIT 2017
Denpasar, Bali, Indonesia
26-29 September 2017
Edited by
Copyright © 2017 by The Institute of Electrical and Electronics Engineers, Inc.
All rights reserved.
Copyright and Reprint Permissions: Abstracting is permitted with credit to the source. Libraries may photocopy beyond the limits of US copyright law, for private use of patrons, those articles in this volume that carry a code at the bottom of the first page, provided that the per-copy fee indicated in the code is paid through the Copyright Clearance Center, 222 Rosewood Drive, Danvers, MA 01923.
Other copying, reprint, or republication requests should be addressed to: IEEE Copyrights Manager, IEEE Service Center, 445 Hoes Lane, P.O. Box 133, Piscataway, NJ 08855-1331.
The papers in this book comprise the proceedings of the meeting mentioned on the cover and title page. They reflect the authors’ opinions and, in the interests of timely dissemination, are published as presented and without change. Their inclusion in this publication does not necessarily constitute endorsement by the editors, the IEEE Computer Society, or the Institute of Electrical and Electronics Engineers, Inc.
IEEE Computer Society Order Number E6163 ISBN-13: 978-1-4673-9899-2 BMS Part # CFP17M16-ART
Additional copies may be ordered from:
IEEE Computer Society IEEE Service Center IEEE Computer Society Customer Service Center 445 Hoes Lane Asia/Pacific Office 10662 Los Vaqueros Circle P.O. Box 1331 Watanabe Bldg., 1-4-2
P.O. Box 3014 Piscataway, NJ 08855-1331 Minami-Aoyama Los Alamitos, CA 90720-1314 Tel: + 1 732 981 0060 Minato-ku, Tokyo 107-0062
Tel: + 1 800 272 6657 Fax: + 1 732 981 9667 JAPAN Fax: + 1 714 821 4641 http://shop.ieee.org/store/ Tel: + 81 3 3408 3118 http://computer.org/cspress
[email protected] Fax: + 81 3 3408 3553 [email protected]
Individual paper REPRINTS may be ordered at: <[email protected]>
Editorial production by Juan E. Guerrero Cover art production by Annie Jiu
I E E E C o m p u t e r S o c i e t y
Conference Publishing Services
(CPS)
2017 International Conference
on Soft Computing, Intelligent
System and Information
Technology
ICSIIT 2017
Table of Contents
Preface...xi
Conference Organization...xii
Program Committee...xiii
Reviewers...xv
Classification and Correlation Techniques
Gesture Recognition for Indonesian Sign Language Systems (ISLS) Using Multimodal Sensor Leap Motion and Myo Armband Controllers Based on Naïve Bayes Classifier...1Khamid, Adhi Dharma Wibawa, and Surya Sumpeno Waah: Infants Cry Classification of Physiological State Based on Audio Features...7
Ramon L. Rodriguez and Susan S. Caluya Fuzzy Clustering and Bidirectional Long Short-Term Memory for Sleep Stages Classification...11
Intan Nurma Yulita, Mohamad Ivan Fanany, and Aniati Murni Arymurthy MFCC Feature Classification from Culex and Aedes Aegypti Mosquitoes Noise Using Support Vector Machine...17
Achmad Lukman, Agus Harjoko, and Chuan-Kay Yang Automatic Chord Arrangement with Key Detection for Monophonic Music...21
Bor-Shen Lin and Ting-Chun Yeh Credit Scoring Refinement Using Optimized Logistic Regression...26
Hendri Sutrisno and Siana Halim Anomaly Detection System Based on Classifier Fusion in ICS Environment...32
Jan Vávra and Martin Hromada
Efficient Object Recognition with Multi-directional Features in Urban Scenes...39
Ryo Kawanami and Kousuke Matsushima
Feature Extraction and Image Recognition Methods
Timor Leste Tais Motif Recognition Using Wavelet and Backpropagation...45
Vasio Sarmento Soares, Albertus Joko Santoso, and Djoko Budyanto Setyohadi
The Model and Implementation of Javanese Script Image Transliteration...51
Anastasia Rita Widiarti, Agus Harjoko, Marsono, and Sri Hartati
Human Activity Recognition by Using Nearest Neighbor Algorithm from Digital
Image...58
Muhammad Ihsan Zul, Istianah Muslim, and Luqman Hakim
Night to Day Algorithm for Video Camera...62
Stefan Jack Lionardi, Mariëlle Fransen, and Andreas Handojo
Arca Detection and Matching Using Scale Invariant Feature Transform (SIFT)
Method of Stereo Camera ...66
Aviv Yuniar Rahman, Surya Sumpeno, and Mauridhi Hery Purnomo
The Application of Deep Convolutional Denoising Autoencoder for Optical
Character Recognition Preprocessing...72
Christopher Wiraatmaja, Kartika Gunadi, and Iwan Njoto Sandjaja
Acne Segmentation and Classification Using Region Growing
and Self-Organizing Map...78
Gregorius Satia Budhi, Rudy Adipranata, and Ari Gunawan
Algorithms for Intelligent Computation
Extended Concept of Generalized Fuzzy Rough Sets on Asymmetric Fuzzy
Coverings...84
Rolly Intan
The Proposal of the Software for the Soft Targets Assessment...90
Lucia Duricova, Martin Hromada, and Jan Mrazek
Application of Artificial Intelligence (AI) in Search Engine Optimization (SEO)...96
Yodhi Yuniarthe
Spatial Model Design of Landslide Vulnerability Early Detection
with Exponential Smoothing Method Using Google API...102
Kristoko Dwi Hartomo, Sri Yulianto, and Joko Ma’ruf
Measures of Dependency in Metric Decision Systems and Databases...107
Anh Duy Tran, Somjit Arch-int, and Ngamnij Arch-int
Multiple Scattered Local Search for Course Scheduling Problem...114
Ade Jamal
The Software Proposes for Management and Decision Making at Process
Transportation...120
Jan Mrazek, Lucia Duricova, and Martin Hromada
Distributed Systems and Computer Networks
A Self-Adaptive Architecture with Energy Management in Virtualized
Environments...124
I Made Murwantara, Behzad Bordbar, and João Bosco Ferreira Filho
Nanoservices as Generalization Services in Service-Oriented Architecture...131
Sutrisno, Frans Panduwinata, and Pujianto Yugopuspito
Automated Concurrency Testing for Cloud-Based Polling Systems ...138
Hans Dulimarta
Low-Overhead Multihop Device-to-Device Communications in Software
Defined Wireless Networks...144
Riyanto Jayadi and Yuan-Cheng Lai
A Secure Anonymous Authentication Scheme for Roaming Service in Global
Mobility Network ...150
Kuo-Yang Wu, Yo-Hsuan Chuang, Tzong-Chen Wu, and Nai-Wei Lo
Linux PAM to LDAP Authentication Migration ...155
Justinus Andjarwirawan, Henry Novianus Palit, and Julio Christian Salim
Exploratory Research on Developing Hadoop-Based Data Analytics Tools...160
Henry Novianus Palit, Lily Puspa Dewi, Andreas Handojo, Kenny Basuki, and Mikiavonty Endrawati Mirabel
Mobile and Pervasive IoT Applications
Human Heart Rate Detection Application...167
Semuil Tjiharjadi and Aufar Fajar
Near Field Communication Technology in Delivering Information in Museums...173
Djoni Haryadi Setiabudi, Ryan Christian Wiguno, and Henry Novianus Palit
Android Application for Monitoring Soil Moisture Using Raspberry Pi...178
Lily Puspa Dewi, Justinus Andjarwirawan, and Robin Putra Wardojo
Development of Mobile Indoor Positioning System Application Using Android
and Bluetooth Low Energy with Trilateration Method...185
Agustinus Noertjahyana, Ignatius Alex Wijayanto, and Justinus Andjarwirawan
Assessments of Integrated IS/IT
The Proposal of United Crisis Management Information Systems of the Czech
Republic...190
Katerina Vichova, Martin Hromada, and Ludek Lukas
The Analysis of Academic Information System Success: A Case Study
at Instituto Profissional De Canossa (IPDC) Dili Timor-Leste...196
Apolinario Dos Santos, Albertus Joko Santoso, and Djoko Budiyanto Setyohadi
Identification of Factors Influencing the Success of Hospital Information System (SIRS) by Hot-Fit Model 2006: A Case Study of RSUD Dr
Samratulangi Tondano, Minahasa Regency, North Sulawesi ...202
Frendy Rocky Rumambi, Albertus Joko Santoso, and Djoko Budyanto Setyohadi
The Alignment of IT and Business Strategy at ROC Leeuwenborgh ...208
Frederick Wonges, Jack Zijlmans, and Leo Willyanto Santoso
Development of Capability Assessment Model of IT Operation Management
Process with Organizational Behavior...214
Luh Made Wisnu Satyaninggrat and Kridanto Surendro
Exploring Critical Success Factors of Mobile Learning as Perceived
by Students of the College of Computer Studies – National University...220
Bernie S. Fabito
Identifying Characteristics and Configurations in Open Source ERP
in Accounting Using ASAP: A Case Study on SME...227
Agung Terminanto and Achmad Nizar Hidayanto
Simulation and Virtual Reality Applications
The Real Time Training System with Kinect: Trainer Approach...233
Ivana Valentine Masala and Apriandy Angdresey
3D LIDAR City Model Application and Marketing Plan Development...238
Kevin Sanjaya, Frank Henning, and Kristo Radion Purba
Periodic Review Inventory Model Simulations for Imperfect Quality Items
and Stochastic Demand...243
Gede A. Widyadana, Audrey T. Widjaja, and Irena Liong
Simulation on Crowd Mobility of Moving Objects Using Multi-agent
and ClearPath...250
Baihaqi Siregar, Agnes Irene Silitonga, Erna Budhiarti Nababan, Ulfi Andayani, and Fahmi Fahmi
Truck Management Integrated Information System in a Shipping Line
Company ...257
Arnold Samuel Chan and I Nyoman Sutapa
Simulation of Atmosphere in Trowulan during the Golden Era of Majapahit
Using Virtual Reality ...263
Daniel Kusuma, Rudi Adipranata, and Erandaru
Development of Interactive Learning Media for Simulating Human Digestive
System...270
Kristo Radion Purba, Liliana, and Daniel Runtulalu
Development of Interactive Learning Media for Simulating Human Blood
Circulatory System...275
Kristo Radion Purba, Liliana, and Yohanes Nicolas Paulo Kwarrie
Smart Assistive Technologies
Fall Detection Application Using Kinect...279
Kartika Gunadi, Liliana, and Jonathan Tjitrokusmo
Driver Drowsiness Detection Using Visual Information on Android Device...283
Aldila Riztiane, David Habsara Hareva, Dina Stefani, and Samuel Lukas
Epileptic Alert System on Smartphone...288
Aziis Yudha Adwitiya, David Habsara Hareva, and Irene Astuti Lazarusli
Elderly Healthcare Assistance Application Using Mobile Phone...292
Andreas Handojo, Tioe Julio Adrian Sutiono, and Anita Nathania Purbowo
Socially-Enhanced Variants of Mobile Bingo Game: Towards Personalized
Cognitive and Social Engagement among Seniors...297
Chien-Sing Lee, Shanice Wei-Ling Chan, and Sheng-Yee Guy
Smart Mobile Applications
M-Guide: Hybrid Recommender System Tourism in East-Timor ...303
Jaime da Costa Lobo Soares, Suyoto, and Albertus Joko Santoso
M-Guide: Recommending Systems of Food Centre in Buleleng Regency...310
Komang Ananta Wijaya, Suyoto, and Albertus Joko Santoso
Empowering Public Secondary Schools on Disaster Response and Recovery:
A Framework for the Development of Helpline Mobile Application...315
Odette Saavedra, Matthew C. Abrera, Mickaela Carla L. Waniwan, Curly Kale C. Dava, and Bernie S. Fabito
A Framework Mobile Game Application that Teaches Parts of Speech
in Grade 3 in Filipino...321
John Erasmus Correa, Jastine Gamboa, Mark Edison Lavapie, Edzel Uy, and Ramon L. Rodriguez
iSagip: A Crowdsource Disaster Relief and Monitoring Application Framework...327
Auxesis Jacobi M. Schwab, John Eduard C. Omaña, Kent V. Roazol, Ted Anthony Y. Abe, and Bernie S. Fabito
Case Studies of Knowledge Discovery and Management
Executive Dashboard as a Tool for Knowledge Discovery...331
Nyoman Karna
Data Mining Applications for Sales Information System Using Market Basket
Analysis on Stationery Company...337
Alexander Setiawan, Gregorius Satia Budhi, Djoni Haryadi Setiabudi, and Ricky Djunaidy
A Knowledge Management-Extended Gamified Customer Relationship
Management System...341
Chien-Sing Lee, Jun-Jie Foo, Vinudha a/p Jeya Sangar, Pei-Yee Chan, Weng-Keen Hor, and Eng-Keong Chan
Web Based Customer Relationship Management Application for Helping Sales
Analysis on Bike Manufacturer...347
Anita Nathania Purbowo, Yulia, and Agustinus Ivan Suryadi
Replenishment Strategy Based on Historical Data and Forecast of Safety
Stock...353
Allysia Ongkicyntia and Jani Rahardjo
On Estimation and Prediction of Simple Model and Spatial Hierarchical Model
for Temperature Extremes...359
Indriati Njoto Bisono
Author Index...363
Preface
ICSIIT 2017
This proceedings volume contains papers presented at the fifth International Conference on Soft
Computing, Intelligent System and Information Technology (the 5th ICSIIT) held in Bali, Indonesia,
26-29 September 2017. Main theme of this international conference is “Building Intelligence through IoT
and Big Data”, and it was organized and hosted by Informatics Engineering Department, Petra Christian
University, Surabaya, Indonesia.
The Program Committee received 106 submissions for the conference from across Indonesia and
around the world. After peer-review process by at least two reviewers per paper, 64 papers were accepted
and included in the proceedings. The papers were divided into ten groups: Classification and Correlation
Techniques, Feature Extraction and Image Recognition Methods, Algorithms for Intelligent Computation,
Distributed Systems and Computer Networks, Mobile and Pervasive IoT Applications, Assessments of
Integrated IS/IT, Simulation and Virtual Reality Applications, Smart Assistive Technologies, Smart
Mobile Applications, Case Studies of Knowledge Discovery and Management.
We would like to thank all Program Committee members for their effort in providing high-quality
reviews in a timely manner. We thank all the authors of submitted papers and the authors of selected
papers for their collaboration in preparation of the final copy.
Compared to the previous ICSIIT conferences, the number of participants of the 5th ICSIIT 2017 is not
only increasing, but also the research papers presented at the conference are improved both in quantity
and quality. On behalf of the organizing committee, once again, we would like to thank all participants of
this conference, who contributed enormously to the success of the conference.
We hope all of you enjoy reading this volume and that you will find it inspiring and stimulating for
your research and future work.
Leo W. Santoso,
Petra Christian University, Indonesia
ICSIIT 2017 General Chair
Henry N. Palit,
Petra Christian University, Indonesia
ICSIIT 2017 Program Chair
Conference Organization
ICSIIT 2017
General Chairs
Leo W. Santoso, Petra Christian University, Indonesia
Rajkumar Buyya, The University of Melbourne, Australia
Program Chairs
Henry N. Palit, Petra Christian University, Indonesia
Chia-Hui Chang, National Central University, Taiwan
Steering Committee
Rolly Intan, Petra Christian University, Indonesia
Chi-Hung Chi, CSIRO, Australia
Rajkumar Buyya, The University of Melbourne, Australia
Program Committee
ICSIIT 2017
A.V. Senthil Kumar,
Hindusthan College of Arts and Science, India
Achmad Nizar Hidayanto,
University of Indonesia, Indonesia
Alexander Fridman,
Institute for Informatics and Mathematical Modelling, Russia
Ashraf Elnagar,
University of Sharjah, United Arab Emirates
Bernardo Nugroho Yahya,
Hankuk University of Foreign Studies, Korea
Bor-Shen Lin,
National Taiwan University of Science and Technology, Taiwan
Budi Bambang,
Indonesia
Bruce Spencer,
University of New Brunswick, Canada
Can Wang,
CSIRO, Australia
Chen Ding,
Ryerson University, Canada
Cherry G. Ballangan,
Australia
Chuan-Kai Yang,
National Taiwan University of Science and Technology, Taiwan
Edwin Lughofer,
Johannes Kepler University Linz, Austria
Eric Holloway,
Baylor University, USA
Erma Suryani,
Sepuluh Nopember Institute of Technology, Indonesia
Felix Pasila,
Petra Christian University, Indonesia
Han-You Jeong,
Pusan National University, Korea
Hans Dulimarta,
Grand Valley State University, USA
Hong Xie,
Murdoch University, Australia
Ilung Pranata,
SAP, Australia
Jantima Polpinij,
Mahasarakham University, Thailand
Kassim S. Mwitondi,
Sheffield Hallam University, United Kingdom
K.V. Krishna Kishore,
Vignan University, India
Lee Chien Sing,
Sunway University, Malaysia
Mahmoud Farfoura,
Royal Scientific Society, Jordan
Masashi Emoto,
Meiji University, Japan
Moeljono Widjaja,
Agency for the Assessment and Application of Technology, Indonesia
Nai-Wei Lo,
National Taiwan University of Science and Technology, Taiwan
Prantosh Kumar Paul,
Raiganj University, India
Pujianto Yugopuspito,
Pelita Harapan University, Indonesia
Raymond Kosala,
Binus University, Indonesia
Rudy Setiono,
National University of Singapore, Singapore
Sankar Kumar Pal,
Indian Statistical Institute, India
Selpi,
Chalmers University of Technology, Sweden
Sergio Camorlinga,
University of Winnipeg, Canada
Shafiq Alam Burki,
University of Auckland, New Zealand
Shan-Ling Pan,
University of New South Wales, Australia
Simon Fong,
University of Macau, Macau
Smarajit Bose,
Indian Statistical Institute, India
Son Kuswadi,
Electronic Engineering Polytechnic Institute of Surabaya, Indonesia
Suphamit Chittayasothorn,
King Mongkut's Institute of Technology Ladkrabang, Thailand
Todorka Alexandrova,
Waseda University, Japan
Tohari Ahmad,
Sepuluh Nopember Institute of Technology, Indonesia
Vijay Varadharajan,
Macquarie University, Australia
Wei Zhou,
CSIRO, Australia
Wichian Chutimaskul,
King Mongkut's University of Technology Thonburi, Thailand
Xiaojun Ye,
Tsinghua University, China
Xiao Wu,
Southeast University, China
Yanqing Liu,
Jiangxi University of Finance and Economics, China
Yung-Chen Hung,
Soochow University, Taiwan
Yunwei Zhao,
Tsinghua University, China
Reviewers
ICSIIT 2017
A.V. Senthil Kumar,
Hindusthan College of Arts and Science, India
Achmad Nizar Hidayanto,
University of Indonesia, Indonesia
Alexander Fridman,
Institute for Informatics and Mathematical Modelling, Russia
Ashraf Elnagar,
University of Sharjah, United Arab Emirates
Bernardo Nugroho Yahya,
Hankuk University of Foreign Studies, Korea
Bor-Shen Lin,
National Taiwan University of Science and Technology, Taiwan
Budi Bambang,
Indonesia
Bruce Spencer,
University of New Brunswick, Canada
Can Wang,
CSIRO, Australia
Chen Ding,
Ryerson University, Canada
Cherry G. Ballangan,
Australia
Chuan-Kai Yang,
National Taiwan University of Science and Technology, Taiwan
Edwin Lughofer,
Johannes Kepler University Linz, Austria
Eric Holloway,
Baylor University, USA
Erma Suryani,
Sepuluh Nopember Institute of Technology, Indonesia
Felix Pasila,
Petra Christian University, Indonesia
Han-You Jeong,
Pusan National University, Korea
Hans Dulimarta,
Grand Valley State University, USA
Hong Xie,
Murdoch University, Australia
Ilung Pranata,
SAP, Australia
Jantima Polpinij,
Mahasarakham University, Thailand
Kassim S. Mwitondi,
Sheffield Hallam University, United Kingdom
K.V. Krishna Kishore,
Vignan University, India
Lee Chien Sing,
Sunway University, Malaysia
Mahmoud Farfoura,
Royal Scientific Society, Jordan
Masashi Emoto,
Meiji University, Japan
Moeljono Widjaja,
Agency for the Assessment and Application of Technology, Indonesia
Nai-Wei Lo,
National Taiwan University of Science and Technology, Taiwan
Prantosh Kumar Paul,
Raiganj University, India
Pujianto Yugopuspito,
Pelita Harapan University, Indonesia
Raymond Kosala,
Binus University, Indonesia
Rudy Setiono,
National University of Singapore, Singapore
Sankar Kumar Pal,
Indian Statistical Institute, India
Selpi,
Chalmers University of Technology, Sweden
Sergio Camorlinga,
University of Winnipeg, Canada
Shafiq Alam Burki,
University of Auckland, New Zealand
Shan-Ling Pan,
University of New South Wales, Australia
Simon Fong,
University of Macau, Macau
Smarajit Bose,
Indian Statistical Institute, India
Son Kuswadi,
Electronic Engineering Polytechnic Institute of Surabaya, Indonesia
Suphamit Chittayasothorn,
King Mongkut's Institute of Technology Ladkrabang, Thailand
Todorka Alexandrova,
Waseda University, Japan
Tohari Ahmad,
Sepuluh Nopember Institute of Technology, Indonesia
Vijay Varadharajan,
Macquarie University, Australia
Wei Zhou,
CSIRO, Australia
Wichian Chutimaskul,
King Mongkut's University of Technology Thonburi, Thailand
Xiaojun Ye,
Tsinghua University, China
Xiao Wu,
Southeast University, China
Yanqing Liu,
Jiangxi University of Finance and Economics, China
Yung-Chen Hung,
Soochow University, Taiwan
Yunwei Zhao,
Tsinghua University, China
2/21/2018 Credit Scoring Refinement Using Optimized Logistic Regression - IEEE Conference Publication
http://ieeexplore.ieee.org/document/8262538/ 1/3
Institutional Sign In
IEEE.org IEEE | Xplore Digital Library|IEEE-SA|IEEE Spectrum|More Sites Cart (0) Create Account| | Personal Sign In
Advertisement
Browse Conferences > Soft Computing, Intelligent S... < Previous | Back to Results | Next >
Credit Scoring Refinement Using Optimized Logistic
Regression
Sign In or Purchase
to View Full Text 17FullText Views
Related Articles
Inverse kinematics of redundant robots using genetic algorithms
Joint trajectory generation for redundant robots
View All
2
Author(s) Hendri Sutrisno ; Siana Halim View All Authors
Abstract:
A poor credit scoring model will give a poor power for predicting defaulted loan. There are many approaches for modeling the default prediction, such as classical logistic regression and Bayesian logistics regression. In this paper, we applied both classical logistic regression and AUC (Area under Curved) optimized using Nelder-Mead Algorithm for refining a credit scoring model that has already been used for several years by an International bank in Indonesia. Both classical logistics regression and AUC optimized method perform well in improving the model, but logistic regression still better in some aspects. AUC Optimized model has higher AUC than logistic regression model but has lower Kolmogorov-Smirnov Score.
Published in: Soft Computing, Intelligent System and Information Technology (ICSIIT), 2017 International Conference on
Date of Conference: 26-29 Sept. 2017
Date Added to IEEE Xplore: 18 January 2018
ISBN Information:
DOI: 10.1109/ICSIIT.2017.48
Publisher: IEEE
Conference Location: Denpasar, Indonesia
Advertisement Download Citation View References Email Print I. Introduction
In Indonesia, SMEs (Small and Medium Enterprises) constantly contribute more than 57% in Gross Domestic Product since 2006 [1]. Until 2013, there were more than 57 million SMEs in Indonesia [2]. Every year, Bank X receives thousands of SMEs loan applicant and, as a result, it needs a tool that can process the loans faster and provide low risk. Credit scoring helps lenders take faster, cheaper, and more objective decisions in terms of providing loans [3]. Every classification technique for credit scoring data gives different results, where neutral networks and least-squares support vector machines yield good results, but the classical logistic regression is still performing well for credit scoring [4]. Until now, logistic regression remains the main method applied in the banking sector to develop the scoring models. Since the market is changing rapidly, new methods are required for optimizing the scoring problem. In recent years, many quantitative techniques have been used to examine predictive power in credit scoring [5]. Credit scoring models are usually evaluated using power curve such as the Receiver Operating Characteristic (ROC) curves [6] Download PDF
Abstract Authors Figures References Citations Keywords Metrics Media
My Settings Get Help
2/21/2018 Credit Scoring Refinement Using Optimized Logistic Regression - IEEE Conference Publication
http://ieeexplore.ieee.org/document/8262538/ 2/3
Request Permissions
Alerts
evaluated using power curve such as the Receiver Operating Characteristic (ROC) curves [6].
Read document
Keywords
IEEE Keywords
Predictive models, Logistics, Sociology, Statistics, Optimization, Computational modeling, Mathematical model
Author Keywords
Credit scoring; logistics regression; Nelder-Mead algorithm; AUC optimization.
Authors
Hendri Sutrisno Siana Halim
Related Articles
Inverse kinematics of redundant robots using genetic algorithms J.K. Parker; A.R. Khoogar; D.E. Goldberg
Joint trajectory generation for redundant robots T.C. Hsia; Z.Y. Guo
Schedulability in model-based software development for distributed real-time systems S.S. Yau; Xiaoyong Zhou
Performance evaluation of a probabilistic replica selection algorithm S. Krishnamurthy; W.H. Sanders; M. Cukier
Optimized Edgebreaker encoding for large and regular triangle meshes A. Szymczak
Compressor performance, absolutely! M.R. Titchener
Wavelet-based lossy compression of barotropic turbulence simulation data J.P. Wilson
Less redundant codes for variable size dictionaries Zhen Yao; N. Rajpoot
Low-complexity interpolation coding for server-based computing Fei Li; J. Nieh
Implementation of a TMO-based real-time airplane landing simulator on a distributed computing environment
Min-Gu Lee; Sunggu Lee
Export to Collabratec
Full Text Abstract Authors Figures References
2/21/2018 Credit Scoring Refinement Using Optimized Logistic Regression - IEEE Conference Publication
http://ieeexplore.ieee.org/document/8262538/ 3/3
IEEE Account
»Change Username/Password »Update Address
Purchase Details
»Payment Options »Order History
»View Purchased Documents
Profile Information
»Communications Preferences »Profession and Education »Technical Interests
Need Help?
»US & Canada: +1 800 678 4333
»Worldwide: +1 732 981 0060
»Contact & Support
A not-for-profit organization, IEEE is the world's largest technical professional organization dedicated to advancing technology for the benefit of humanity. © Copyright 2018 IEEE - All rights reserved. Use of this web site signifies your agreement to the terms and conditions.
About IEEE Xplore|Contact Us|Help|Accessibility|Terms of Use|Nondiscrimination Policy|Sitemap|Privacy & Opting Out of Cookies
Full Text Abstract Authors Figures References
Credit Scoring Refinement
using Optimized Logistic Regression
Hendri Sutrisno
Industrial Engineering Department Petra Christian University
Surabaya, Indonesia [email protected]
Siana Halim
Industrial Engineering Department Petra Christian University
Surabaya, Indonesia [email protected]
Abstract—A poor credit scoring model will give a poor power for predicting defaulted loan. There are many approaches for modeling the default prediction, such as classical logistic regression and Bayesian logistics regression. In this paper, we applied both classical logistic regression and AUC (Area under Curved) optimized using Nelder-Mead Algorithm for refining a credit scoring model that has already been used for several years by an International bank in Indonesia. Both classical logistics regression and AUC optimized method perform well in improving the model, but logistic regression still better in some aspects. AUC Optimized model has higher AUC than logistic regression model but has lower Kolmogorov-Smirnov Score (KS-Score)
Keywords— Credit scoring, logistics regression, Nelder-Mead Algorithm, AUC optimization
I. INTRODUCTION
In Indonesia, SMEs (Small and Medium Enterprises) constantly contribute more than 57% in Gross Domestic Product since 2006 [1]. Until 2013, there were more than 57 million SMEs in Indonesia [2]. Every year, Bank X receives thousands of SMEs loan applicant and, as a result, it needs a tool that can process the loans faster and provide low risk. Credit scoring helps lenders take faster, cheaper, and more objective decisions in terms of providing loans [3]. Every classification technique for credit scoring data gives different results, where neutral networks and least-squares support vector machines yield good results, but the classical logistic regression is still performing well for credit scoring[4]. Until now, logistic regression remains the main method applied in the banking sector to develop the scoring models. Since the market is changing rapidly, new methods are required for optimizing the scoring problem. In recent years, many quantitative techniques have been used to examine predictive power in credit scoring [5]. Credit scoring models are usually evaluated using power curve such as the Receiver Operating Characteristic (ROC) curves [6].
AUC is an area under the ROC curve and a good ROC should have high AUC value. Higher AUC mean the model better in predict bad debtors. Both the ROC curve and the AUC do not depend on the proportion of defaulters in the credit portfolio, therefore they could be used to monitor the performance of credit models over time [7]. Kraus [8], tried to optimize AUC it
seems to be a reasonable procedure for estimating the parameters for credit scoring case besides logistic regression. This research will focus on how to validate current credit scoring model of an International Bank in Indonesia. When the model has already been validated, another interesting problem is how to develop a better classifier. So this research also focusses on developing the credit scoring model using AUC Optimization.
II. METHODS
A. Logistics Regression
Logistic regression is a statistical method for analyzing dataset in which there are one or more independent variables that determine outcome, which is only have two outcomes [9]. In retail banking, logistic regression is the most widely used method for classifying applicants into risk classes because of its good interpretability and simple explanation [10]. Logistic regression model is built with a modification of linear regression.
Yi= β0+ β1Xi1+ β2Xi2+ ⋯ + βpXip+ ϵi (1)
Equation (1) considers n observation of one dependent variable and p independent variables. Thus, Yi is the ith observation of the dependent variable, variable Xij is ith
observation of the jth independent variable, j start from 1 to p.
The values of βj represent parameters to be estimated. The value of Yi will be between -∞ and +∞ depends on the value of independent variables. In order to make the value of 𝒀𝒊 always positive, the value will only range between 0 and +∞. To transfer the value of Yi into a range between 0 and 1, then the binary logistic regression is used as the transferred function
π(x) = exp Yi
1+exp Yi (2)
Therefore, the formula of logit transformation would become as below.
B. AUC Optimization – Nelder Mead Algorithm
Default customers are customers who fail to pay installments for the loan, and Non-Default customers are customers who pays regular installments for the loan. These classes are used for the description of the ROC graph. If a default is correctly classified and predicted as a default, it is a true positive(𝑡𝑝); while a non-default wrongly predicted as a default is counted as a false positive (𝑓𝑝).
TP rate =default correctly classified (tp)total default (p) (4)
FP rate =non−default incorrectly classified (fp)total non−default (p) (5)
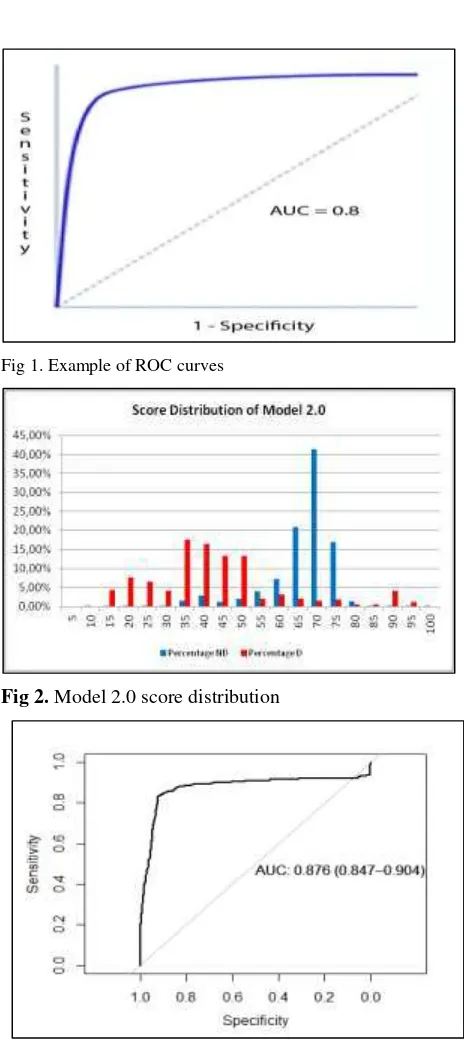
ROC curve is created by plotting TPR (true positive rate) versus FPR (false positive rate). Figure 1 shows an example of ROC Curve. AUC is an area under the ROC curve. A good ROC should have high AUC. Higher AUC mean the model better in predict bad debtors. When the AUC is equal to 1, it becomes the ideal model, which means the model leads to zero FPR or, in other words, there is no non-default debtor that is incorrectly classified.
AUC is computed with the following formula [8] [11]:
AUC = n 1
nd . nd ∑ ∑ S(xnd, xd)
nd
1 nnd
1 (6)
Eguchi and Copas [11] started AUC optimization with linear scores by dealing with a complex calculating method for the AUC.Kraus [8] has proposed a recent method for building credit scoring model, which is called AUC optimization, with Wilcoxon Mann-Whitney procedure as method of calculation and Nelder-Mead method as the optimization algorithm. The outcomes are compared using different performance measures,
and DeLong’s test for analyze the significance of the different
AUC measures. Extending the definition of equation (6); 𝛽𝑡 is introduced as a vector of coefficients, whilennd and nddenote the scores as vectors of explanatory variables:
AUC(β) = n 1
nd . nd ∑ ∑ S (β
t(xnd, xd)) nd
1 nnd
1 (7)
The aim is to optimize the β-coefficients by maximizing
𝐴𝑈𝐶(𝛽):
β̂ AUC=arg maxβ nnd1 . nd ∑1nnd ∑ S (βn1d t(xnd, xd)) (8)
III. RESULTS AND DISCUSSIONS
A. Model 2.0
Model 2.0 consider 31 predictor variables. The dataset has 14,700 responses which consist of 14,290 non-default and 4,410 default. It will be separated randomly into train and test dataset with 70:30 proportions. Training dataset has 248 defaults and 10,042 non-defaults, while testing dataset has 98 defaults and 4,312 non-defaults.
Only good Predictor Variables will be selected for the
model. Pearson’s Chi-Square Test for Independence is used to filter the good predictor variables. The Alpha of the test is 0.1., with the hypothesis test as the follow:
Fig 1. Example of ROC curves
Fig 2. Model 2.0 score distribution
Fig 3. Receiver operating characteristic curve of Model 2.0 H0: Response Variable is dependent with Predictor Variable.
H1: Response Variable is not dependent with Predictor Variable.
Fig 4. Model 2.0 score threshold
Fig 5. Model 2.1 summary
Fig 6. Model 2.1 score distribution
As seen on Fig 2 there is a significant difference scores between default and non-default applicants. Measuring the stability of a population aims to find out whether the population of testing dataset differs from the population of training dataset. Population Stability Index usually used as the indicator that still the development population perform as well as in the validation population. With a very low index of 0.008674917, there is an insignificant change between train and test dataset judged using Model 2.0 from its scores.
The ability of scorecard to separate between default and non-default can be measured by calculating the value of Kolmogorov-Smirnov Score. The KS Score of this model is 0.754. This means that Model 2.0 is good enough to separate the defaults and non-defaults. The model is very good in separation. The good separation of Model 2.0 also can be seen by the AUC (see Fig. 3).
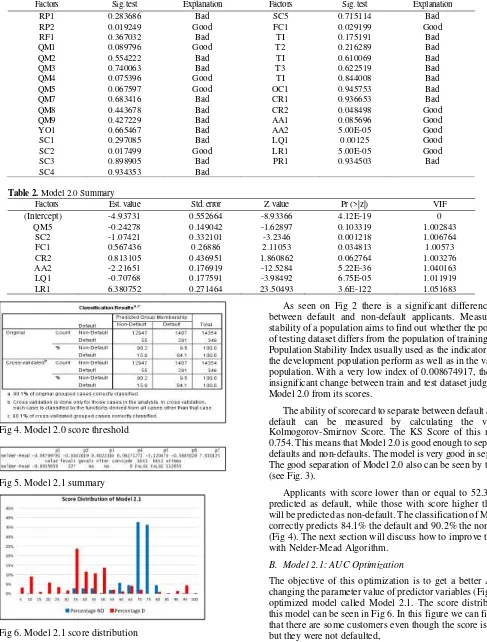
Applicants with score lower than or equal to 52.3 will be predicted as default, while those with score higher than 52.3 will be predicted as non-default. The classification of Model 2.0 correctly predicts 84.1% the default and 90.2% the non-default (Fig 4). The next section will discuss how to improve the AUC with Nelder-Mead Algorithm.
B. Model 2.1: AUC Optimization
The objective of this optimization is to get a better AUC by changing the parameter value of predictor variables (Fig 5). The optimized model called Model 2.1. The score distribution of this model can be seen in Fig 6. In this figure we can figure out that there are some customers even though the score is only 35 but they were not defaulted,
Table 1.Pearson’s Chi-Square Test for Independence in Variables Selection
Factors Sig. test Explanation Factors Sig. test Explanation RP1 0.283686 Bad SC5 0.715114 Bad RP2 0.019249 Good FC1 0.029199 Good RF1 0.367032 Bad TI 0.175191 Bad QM1 0.089796 Good T2 0.216289 Bad QM2 0.554222 Bad TI 0.610069 Bad QM3 0.740063 Bad T3 0.622519 Bad QM4 0.075396 Good TI 0.844008 Bad QM5 0.067597 Good OC1 0.945753 Bad QM7 0.683416 Bad CR1 0.936653 Bad QM8 0.443678 Bad CR2 0.048498 Good QM9 0.427229 Bad AA1 0.085696 Good YO1 0.665467 Bad AA2 5.00E-05 Good SC1 0.297085 Bad LQ1 0.00125 Good SC2 0.017499 Good LR1 5.00E-05 Good SC3 0.898905 Bad PR1 0.934503 Bad SC4 0.934353 Bad
Table 2. Model 2.0 Summary
Factors Est. value Std. error Z value Pr (>|z|) VIF (Intercept) -4.93731 0.552664 -8.93366 4.12E-19 0
Fig 7. Model 2.1 receiver operating characteristic curve
Fig 8. Model 2.0 score threshold
and some of them defaulted even though the score is 95. The simulation value, AUC score is 0.891 after going through 227 times the function is called. Convcode is an integer code, which 0 indicates successful convergence. There is no significant difference in interpret Model 2.1 and Model 2.0 since there are no changes in the parameter value from true real positive to true real negative or otherwise (Fig 7).
As seen on Fig 6 there is a significant difference scores between default and non-default applicants. With a very low index of 0.000456, there is an insignificant change between train and test dataset judged using Model 2.1 from its scores. With KS Score of 0.745, Model 2.1 is good enough to separate the defaults and non-defaults. The model is very good in separation. The defaults and non-defaults score distribution is quite good in separating the defaults and non-defaults. The good separation of Model 2.1 also can be seen by the AUC.
The AUC of Model 2.1 is 0.881. Model AUC is a very good model in separating defaults and non-defaults. There is a small improvement of AUC Score from Model 2.0 by 0.005. The model is very good in separation.
Applicants that have score lower than or equal to 52 will be predicted as default while those with score higher than 52 will be predicted as non-default. From all the 1,611 applicants that
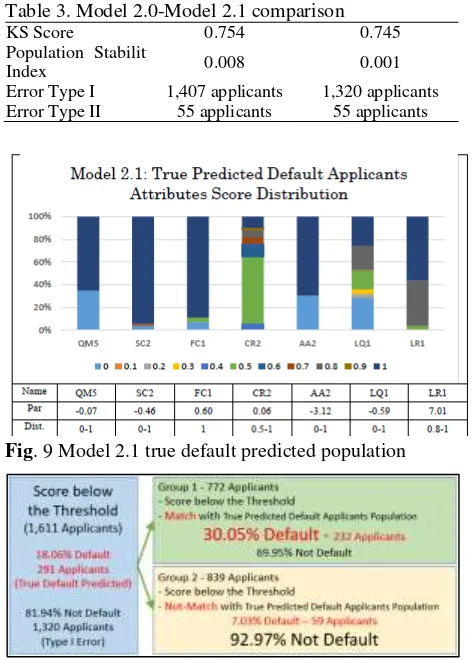
Table 3.Model 2.0-Model 2.1 comparison
KS Score 0.754 0.745 Population Stability
Index 0.008 0.001 Error Type I 1,407 applicants 1,320 applicants Error Type II 55 applicants 55 applicants
Fig. 9 Model 2.1 true default predicted population
Fig. 10. Model 2.1 score below threshold groups
scored lower than or equal to 52, 291 were default while 1,320 are not. From all 13,089 applicants with score higher than 52, 13,034 were not default while only 50 default (see Fig 8).
C. Model 2.0 – Model 2.1 Comparison
There are differences between Model 2.0 and Model 2.1. To select the best one, we can compare those Models by some critical aspects. Table 3 shows the comparison.
The AUC value of Model 2.0 and Model 2.1 are good, which Model 2.1 has a better score. The KS Score of Model 2.0 and Model 2.1 are same good which Model 2.0 has higher value than Model 2.1. The Population Stability Index of Model 2.0 also higher than Model 2.1 where Model 2.1 almost considered that a little potential that the population of training dataset is different with the testing dataset. Model 2.0 give a higher type 1 error but have a same type 2 error with Model 2.1. Model 2.0 is not a bad model, but Model 2.1 perform better with the higher score of AUC, lower index of population stability and also a lower error in type I error.
D. Error Analysis
poor score, but actually the applicant is not default, so Bank X will suffer loss by this error.
The second one is type II error in which the prediction is non-default but actually default. This kind of error can also cause the Bank to suffer, because the Bank had already accepted the applicant loan in prediction the applicant will not become default, but actually the applicant is default. For the banking perspective’s, the type I error has to be as minimized as possible. Since, it is very hard to get a potential customer, once he or she is rejected. However, for the type II error, the bank still has opportunity to force those failed customers to pay their
loan, e.g. by seizing the customer’s collateral, sue the customer
in court and black listed those customers.
The chance of type II error in Model 2.1 only about 0.42% (50 cases of 13,089 applicants but 81.93% for type I error (1,320 cases of 1,611 applicants).
Model 2.1 contains a very high type I error and offers many risk in its application. The risk of type I error is Bank X lose the potential income applicants which not default. Deep analysis is needed to reduce the risk of the implementation of Model 2.1. Some non-default applicants may have a lower attribute score in the selected variables which lead to score that below the threshold. These applicants are a potential applicant that can bring benefit for Bank X. We can know the applicants who truly default by their score attribute population. The population of the true predicted default applicants (applicant who is predicted as default and actually default) as in the Fig 9
The AUC of Model 2.0 is 0.876. Model AUC is a very good model in separating defaults and non-defaults. Using the discriminant analysis, we can know the threshold score for accepting or rejecting applicants (Fig 10).
After knowing the distribution of the true predicted default applicants, we can see the applicants in that population and its score. There are 772 of 1,611 applicants that categorized to this group. 30.05% applicants who match with the first group were default. 232 of 291 (79.7%) of true default predicted applicants were in this group.
The interesting point is only 7.03% from the second group were default. 92.97% applicants of this group were not default. This system make the Bank X easier to take further action for them who have score below the threshold. This system offers lower risk in accepting or rejecting the applicants who have score below the threshold than Model 2.1.
CONCLUSION
Recently there are many techniques in developing a good credit scoring model, such as AUC Optimization. AUC is a value that indicate how good a model in separating two different populations. Higher AUC value mean the model better in separating the populations.
By optimizing the AUC value, there is a possibility that the AUC value get higher. In term of optimizing, there are many techniques in optimizing, such as Nelder-Mead Algorithm.
The first used model in term of building a good model is Model 2.0 based on Logistic Regression Model. Model 2.0 performs well and is able to predict the default and the
non-default applicants accurately with AUC value of 0.876. The second one is Model 2.1 based on AUC Optimization from Model 2.0. Model 2.1 has a 0.881 AUC value which is higher
than Model 2.0’s AUC value, but has a lower KS-Score. Although has a lower score, Model 2.1 still remain in the same class with Model 2.0 of their KS Score. Model 2.1 also has a lower type I error. Model 2.0 predict 1,407 applicants as default applicants but they are actually not going to default, while Model 2.1 only 1,320 applicants.
Even Model 2.1 performs better; the model still has a very large of errors. Model 2.1 can only predict 18.06% default applicants correctly which is mean that Model 2.1 also contain a lot of risk in its implementation. Model 2.1 rejected about 81.94% of all applicants with score below the threshold while they were not default. Bank X could lose many potential incomes. Deep analysis can provide some options to reduce the risks of the implementation of Model 2.1.
By knowing the true default applicants’ population, we can
filter the default predicted applicants into two groups. The first group is the default predicted applicant who have a similar population to the population of the true default applicants. The second one is another group except the first population in default predicted applicants.
With this separation, Model 2.1 has type I error of 69.95% for the first group and 92.97% for the second group. If the applicant has a score below the threshold and included to the second group, then Bank X has a lower risk in accepting the applicants from 18.06% to 7.03%. Bank X also has a lower risk in rejecting the applicants if the applicant matched with the first group. Model 2.1 can only predict the true default applicants with a rate of 18.06 and if we added the first group as additional filtering system, then Model 2.1 can predict the true default applicants with a rate of 30.05%.
REFERENCES
[1] Statistics Indonesia, “Statistics Indonesia”. Jakarta: Statistics Indonesia,
2015.
[2] State Minister for Cooperatives Small and Medium Enterprises of Indonesia. “Data
Usaha Mikro, Kecil, Menengah (UMKM) dan Besar”. Jakarta: State Minister for
Cooperatives Small and Medium Enterprises of Indonesia, 2013.
[3] L, Mester, “What’s the Point of Credit Scoring?”, Philadelphia: Federal Reserve Bank of Philadelphia, 1997.
[4] B. Baesens, T. Gestel, S. Viaene, M. Stepanova, J. Suyken, J., and J. Vanthienen,
“Benchmarking State-of-the-Art Classification Algorithms for Credit Scoring”. The
Journal of the Operational Research Society, 2003, pp. 627-635
[5] Thomas, L., Oliver, R., & Hand, D. (2005). A Survey of the Issues in
Consumer. Journal of the Operational Research Society, 1006-1015.
[6] W. Kraznowski, and D. Hand,” ROC Curves for Continuous Data”. Boca
Raton, Florida, United States of America: Taylor & Francis, Inc., 2009.
[7] J. Sobehart, and S. Keenan, “Measuring Default Accurately”. Credit Risk
Special Report, 2001, pp. 31-33.
[8] A. Kraus, “Recent Methods from Statistics and Machine Learning for
Credit Scoring”. Munich, Germany: Ludwig Maximilian University of
Munich, 2014.
[9] D. Hosmer, D. and S. Lemeshow, Applied Logistic Regression. United
States of America: John Wiley & Sons, Inc., 2000.
[10] D. Hand, and M. Kelly, “Super Scorecards”. IMA Journal of Management
Mathematics 13, 4,2002, pp. 273-281
[11] S. Eguchi, S. and J.. Copas, “A Class of Logistic-Type Discriminant Functions”.