Although textile industry and textile products belong to the strategic sub-sector of manufacturing industry in Indonesia, they are facing pro-blems on the availability of energy, old production machines, and the flooding of imported products into the domestic market. This study is aimed to analyze the efficiency and productivity as performance indicators and how the efficiency and import penetration affect the productivity of textile industry and textile products. The methods of data analysis used in this research are divided in two phases. The first phase, the non-metric approach of Data Envelopment Analysis (DEA) is applied to measure the efficiency and productivity. Secondly, the fixed effect model of econometric regression approach is used to find out the effects of efficiency and import penetration on the productivity of textile industry and textile products. The result shows that the ave-rage level of efficiency of textile industry and textile products during the period of 2004 – 2008 is about 40 percent with a growth rate of average productivity increases 2.4 percent. Whereas, the econometric estimation results indicate that the increase of efficiency will positively and significantly affect the productivity of textile industry and textile products. On the other hand, the increase of import penetration will negatively affect the productivity of this industry.
© 2012 IRJBS, All rights reserved. Keywords:
Efficiency, Productivity, Import Penetration, DEA,
Fixed Effect
Corresponding author: [email protected] [email protected]
A R T I C L E I N F O A B S T R A C T
T
extile Industry and textile products is one of the manufacturing sector which has a strategic role on the economy in Indonesia, in term of employment and the national industrial added value. Due to having an integrated industrialstructure from upstream to downstream and having a very close relationship between industry and other industries, an analysis on textile industry and textile products will touch various segments of the industry either directly or indirectly.
Vol. 5 | No. 3 ISSN: 2089-6271
Efficiency and Import Penetration
on the Productivity of Textile Industry
and Textile Products
Catur Basuki Rakhmawan
*, Djoni Hartono
**, Agni Alam Awirya
**** Agency for Study of Industrial Policy, Climate, and Quality, Ministry of Industry, Republic of Indonesia ** University of Indonesia, Jakarta
Textile industry and textile products in Indonesia are facing several problems, such as (i) expensive energy cost, (ii) unfavourable port infrastructure, and (iii) old textile machines. Moreover, the flooding of illegal textile imports into the domestic market makes the problems even more serious. Miranti (2007) reported that in 2006 more than 50 percent share of the domestic textile market, that reached 1.013 tons, had been occupied by illegal textile products.
Efforts to improve the performance in this sector are required by increasing the efficiencies to raise the productivity and competitiveness of the industry. Indonesian textile industry and textile products are expected to be able to compete with products of other countries. This will encourage the industry to expand the market and increase production that will absorb more labor.
Sumanth (1984) defines productivity as the use of all resources (labor, capital, land, materials, energy and information) efficiently to produce various kinds of goods and services. While efficiency can be called as one of the performance parameter that theoretically underlies the entire performance of an organization where generating the maximum output by the provided input is the expected performance to be measured.
Efficiency can be measured through two approaches: (i) a deterministic approach using a mathematical program technique Data Envelopment Analysis (DEA) and (ii) scholastic approach using econometric method Stochastic Frontier Analysis (SFA). The stochastic approach (parametric) results stochastic cost frontier while DEA results the production frontier. Xiaoying (1999) suggests the use of DEA since this method is believed to: (i) DEA estimators of the best-practice, monotone, increasing and concave production function are also maximum likelihood estimators, (ii) DEA estimators are consistent and converge faster than estimators from other frontier methods, (iii) DEA estimators are also unbiased
when assuming that there is no underlying model or reference technology. Thus, this non-parametric approach (DEA) is applied in this study.
Productivity can be measured in two methods: partial (part) and total (overall). The total factor productivity (TFP) measures the relations between the output and multiple inputs at once (aggregate). Grosskopf (1993) argues that in a production process that has not run efficiently, the productivity growth is the effect of the changes in efficiency and the shift in frontier production function that represents the changes in technology. Since the growth of productivity can be affected by two factors: changes in efficiency and changes in technology, then improving the productivity can be reached through: (i) increase the efficiency by improving the human resources capacity in order to optimize the use of technology efficiently, and (ii) improve the technology owned, such as upgrading the old technologies to the newest ones.
This paper analyzes the condition of the current performance of the Indonesian textile industry, the impact of efficiency and the import penetration on the productivity of the textile industry and textile products. The introduction of the paper and the previous study are described in section 1. Section 2 describes the data and methodology. The result of the study is presented in section 3; while section 4 proposes the conclusion of the study. Hopefully this study can be used in formulating the policy strategies and the programs related to the competitiveness improvement of the industry.
Many researches on this topic have been done previously some of which are as follow. Amato and Christie (2001) did a study on the relations between the growth of TFP and the growth of export and import during 1977 – 1992. Using the methods of pooled and cross section models, the result shows that the growth of import will positively affect to the total of productivity factors.
the textile industry and textile products (TPT) in Indonesia since 1996 to 2001, applying the Structure-Conduct-Performance (SCP) approach. The result shows that during the period the performance of textile industry TPT is relatively higher than the other manufacturing industries. The factors influencing the average value of companies’ productivity are the industry concentration, the firm size, and the use of imported raw materials. Altomonte (2008) studied about the effects of import penetration toward the industry productivity in Italy during 1996 – 2003. The econometric model is applied to measure the effects both horizontally and vertically. The result shows that the import penetration affects positively on the productivity.
Alvares and Sebastian (2008) did a research on the effects of China products on the processing industries in developing countries (case study of Chili) in 1990 – 2000; applying the econometric model approach. The result shows that the China products penetration affects negatively on the growth of people working and increase the probability of discharge (collapse) the processing industry; which is quite different to what happened in US where the processing industry will produce the better quality and export-oriented products.
Besides the above researches, Avenzora (2008) studied about productivity and the efficiency of TPT industry in Indonesia in 2002 – 2004, Jajri and Rahmah (2009) studied about the effects of technical progress on the productivity of small and medium industry workers in Malaysia during 1984 – 2005, Joshi and Singh (2009) researched on the total productivity factors (TFP) of garment industry in India during 2003 – 2007; applying DEA approach with malmquist productivity index, and Kadarsyah (2010) researched on the total productivity factors on the Indonesian footwear industry during 2003-2006. Furthermore, Alviya (2011) studied about the efficiency, productivity and factors influenced the productivity in wood processing industry in Indonesia during 2004-2007. Alviya (2011) applied the DEA and fixed effect regression model to
analyze factors influenced the productivity in wood processing industry. The result shows that the productivity in wood processing industry is influenced by the firm life, firm scale, labor productivity, and the percentage of foreign capital and the level of industry competitiveness.
METHODS
The main data source used in this study is the Survey of Large Medium Industry (IBS) undertaken by the Central Bureau Statistics during 2004-2008. The industries cover the fiber industry, yarns industry (spinning), fabric industry (weaving, knitting, dyeing, printing, finishing and non-woven), garment industry and other textile products.
The data analysis methods used in this study are divided into two main stages. Those are (i) the analysis of efficiency and productivity, and (ii) the analysis of the impacts of efficiency and import penetration on the productivity of the textile industries.
a) The Analysis of efficiency and productivity using DEA approach
Efficiency and productivity in the form of productivity growth is estimated using the Data Envelopment Analysis (DEA) version 2.1., which is used by Coelli (1996) and developed by Coelli’s team from Centre for Efficiency and Productivity Analysis (CEPA) Department of Econometrics University of New England Australia. In the analysis of DEA, the efficiency level has a scale of 0 to 1 where a scale of 1 indicates a point on the frontier where the company has been technically efficient.
The data used in calculating this efficiency and productivity are an output (gross output) and several inputs (net fix asset, raw material, electricity, fosil fuel, and workers’ salary) – as applied by Joshi and Singh (2009).
Logan (1983), Banker, Charnes and Cooper (1984). This approach is considered suitable to be applied as most of the machines in this textile industry are old and cannot be operated at the optimum scale. Besides VRS, output oriented method of DEA is also applied.
The Malmquist Productivity Index (MPI) approach is applied to measure the growth of productivity. This method is believed can decompose the changes of productivity / productivity growth (TFPCH) into the changes of technical efficiency (EFFCH), and the changes of technology (TECH). TFPCH > 1 shows the growth of productivity, TFPCH = 1 shows no changes in productivity, while TFP < 1 indicates the decline of productivity. The same definition goes to measure EFFCH and TECH (Coelli, 2005; Ma et al., 2002; Hseu and Shang, 2005).
This MPI method counts the productivity level between two periods; the distance from a relative data point (of a firm) to the technology in general. Fare (1994) describes it as t (base period) and t + 1 period.
Model 1
By doing the decomposition becomes Model 2
where the notation describes the
output distance function in period t technology with input x and output y in year t. Notation
describes the output distance
function in period t technology with input x and output y in year t+1. Notation
shows output distance function in period t+1 technology with input x and output y in year t.
Notation shows output
distance function in period t+1 technology with input x and output y in year t+1.
If the value of Mo is more than one (1), it indicates the positive growth of productivity, while Mo that is less than one indicates the decline of productivity. From the equation above, it can be seen that there are two indicators on the right side; the index value of efficiency changes (EFFCH) from year t and t+1 and the index value of the technology changes (TECHCH).
The changes of technical efficieny (EFFCH) is represented by:
Model 3
while the changes of technology is presented by:
Model 4
b) The Analysis of the impacts of Efficiency and the Import Penetration on the Productivity Import Penetration
Model 4
where
Impenzit = Import penetration in
industry i sector z during t period
Impzt = Number of import sector z during t period
Prodzit = Number of production in industry i sector z during t period
Ekspzit = Number of export in industry i sector z during t period
Herfindahl–Hirschman Index
Herfindahl-Hirscman Index (HHI) is used to know the structure of the market in textile industry that relates to the level of competition among the firms in this industry.
The measurement of HHI is described through the following equation:
Model 5
Where Si is the market share of company i in the market, and N is the total number of companies. The value of HHI closes to zero (0) indicates the numbers of companies in this industry sector if many which mean the level of competition is high. HHI equals to one (1) indicates the monopoly or concentrated market.
C) Modelling the Impacts of Efficiency and Import Penetration toward the Productivity
This study applied the proxy of worker productivity as the productivity explanatory
variable of companies in analyzing the impacts of efficiency and import penetration on the productivity applying the econometric regression method using the program Stata 11.1 subject to panel data 2005 – 2008. The econometric model used is implicitly described in this equation:
Model 6
Prod = f (Control Variable, Technical Progress, Import Penetration)
where the control variable covers the capital intensity, number of workers, HHI, the dummy of export products, dummy of PMA and dummy of import raw materials. Explicitly, the equation (Model 6) is described as follow:
Model 6
Prodit is the productivity in company i during t period of time. Capinit is the capital intensity; TKit represents the number of workers in company I during t period of time. HHIit is the industry concentration; Ekspit is the export in company I during t period of time. PMAit shows the ownership of foreign capital, BBImpit is the imported raw material, TPit shows the technical growth in the company, Impenit represents the import penetration, while εit is the error term.
RESULTS AND DISCUSSION
effect model to describe the impacts of efficiency and and import penetration on the productivity.
1) Efficiency and Productivity
The data shows that the number of textile industry in 2009 is 2.853 companies concentrated in West Java (43,6 %), DKI Jakarta (16,54 %), Banten (14,72 %) and Central Java (13,49 %). The textile industry and textile products industry are divided in 3 sectors based on the level of technology owned; (i) upstream industry sectors that are capital intensive (high technology), (ii) semi-industry sectors with semi-capital intensive (medium technology), and (iii) downstream industry sectors that are labor intensive (low technology). In addition, to compare the level of efficiency and the changes of productivity in each company, the grouping of industries is done.
1.1 Efficiency
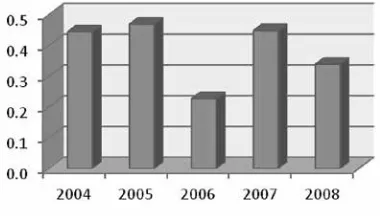
The Figure 1 below shows the average level of technical efficiency of textile companies and textile products is relatively low, which is around 40 percent. This is due to the low skill of the workers in optimizing the technology owned, old machines that cause high cost of maintenance, and the efficiency of the management and the structure of organizations.
Figure 1. The Average Level of Technical Efficiency of Textile Companies Source: Central Bureau Statistics, processed
Efficiency Based on the Area
The efficiency of companies in both main areas (West Java, Jakarta, Banten and Central Java) and other areas is relatively low which is around 25-40 percent. This is influenced by the efficiency of the machines used.
Figure 2. The Technical Efficiency of the Textile Companies Based on Area
Source: Central Bureau Statistics, processed
The figure 2 shows that on average, companies in main areas are having higher efficiency level comparing to companies in other areas; although during 2006 and 2007 companies in other areas are technically more efficient than those in main areas.
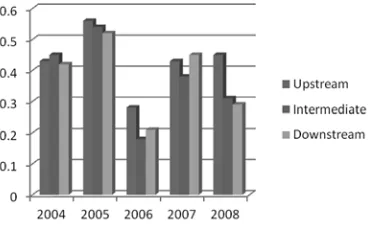
Efficiency Based on Sectors
Figure 3. Technical Efficiency of Textile Companies Based on Sectors Source: Central Bureau Statistics, processed
The upstream industry sector is capital-intensive sector where their productions are very dependant on the availability of energy (electricity, fosil fuel or coal). The changes of energy price and energy availability will highly influence their performance. Besides, the turbulence of exchange rate will also affect them since they use many imported raw materials, mostly in fiber industry.
Efficiency by Industry Groups
The efficiency of industry groups (fibers, yarns, fabrics and garments) is around 20 – 45 percent which is quite low. Comparing to other groups, yarns industry has higher efficiency level that indicates the companies in this industry are more productive. Figure 4 shows the efficiency level for each industry group.
Figure 4. Technical Efficieny of Textile Companies by Industry Group
Source: Central Bureau Statistics, processed
1.2 Productivity
As described above, to measure the growth of productivity, the Malmquist Productivity Index (MPI) approach is applied. The estimation result shows that the changes value of TFP during 2005 – 2008 is 1.024 showing the industry productivity increase 2.4 percent. This result is not quite different from the previous study conducted by Margono (2004) and Avenzore (2008) where the productivity level grows about 2 percent. In addition, the value of efficiency and technology changes are 0.914 and 1.121. The growth of textile industry is more influenced by technology improvements and the workers’ skill in operating the high-technology machines.
Figure 5. The Changes of Productivity, Efficiency and Technology
Source: Central Bureau Statistics, processed
The figure 5 shows trend in productivity growth. In 2006 the highest growth rose about 9 percent, and declined in 2007. Trend in productivity changes is decreasing during period 2005-2007. In 2008 there was a significant growth that was influenced by the technology improvements.
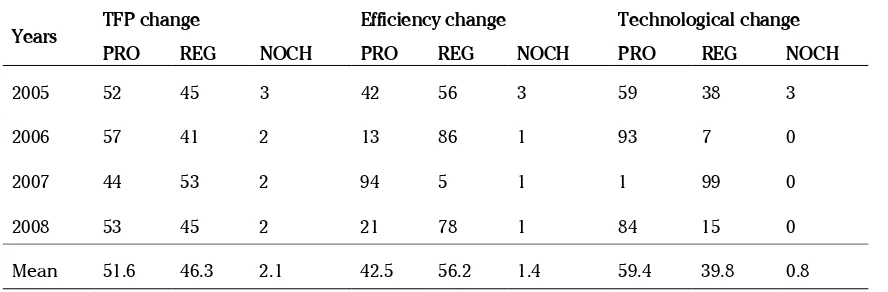
growth in productivity is more influenced by the changes in technology instead of the changes in efficiency where 59.4 percent of companies in this industry had technology development at that time. On the other side, only 42.5 percent of companies increased their efficiency which means more than a half of the companies in this industry had low level of efficiency. This condition will of course affect their level of competitiveness and sustainability in the future.
Based on the estimation calculation done to 902 companies in this industry, 484 companies made development in productivity and 378 companies decreased their productivity level during the period of observation
Companies in yarns industry group made the highest productivity growth which is 2.282, with the efficiency changes 1.434 and the changes of technology 1.591. While companies in fabric industry group made the worst productivity changes which is 0.532 or made productivity decreased by 46.8 percent
Moreover, 718 companies developed their technology while 171 companies
were behind in technology. Besides that, 681 companies showed inefficiency in their production process and only 204 companies increased their efficiency. The inefficiency would influence their productivity in maximizing their production process; in another word, companies would not be able to maximize the technology owned to create maximum output.
Productivity of TPT Industry by Area Figure 6 shows companies in both main area (West Java, Jakarta, Banten and Central Java) and other area, in average, made productivity growth by 2.4 percent and 2.5 percent. The number says that companies out of the main area made a slight higher improvement in productivity. This is in line to the previous research done by Avenzora (2008) who found that productivity in areas out of Jakarta, West Java, and Banten grow faster.
In all areas, the productivity growth is more affected by the technological advances rather than the changes of efficiency. It shows that in most companies, the technological advances are not supported by the the skill developments; so that the efficiency level is low.
Years TFP change Efficiency change Technological change
PRO REG NOCH PRO REG NOCH PRO REG NOCH
2005 52 45 3 42 56 3 59 38 3
2006 57 41 2 13 86 1 93 7 0
2007 44 53 2 94 5 1 1 99 0
2008 53 45 2 21 78 1 84 15 0
Mean 51.6 46.3 2.1 42.5 56.2 1.4 59.4 39.8 0.8
Table 1. Percentage Distribution of TFP, Efficiensy, and Technology in Textile Industry (TPT)
Sourse: Central Bureau Statistics, processed Note:
Figure 6. The Changes of Productivity, Efficiency and Technology by Area
Source: Central Bureau Statistics, processed
The Changes of Productivity in TPT Industry by Sector
In general, companies in textile and product textile (TPT) industry made productivity growth in each sector; upstream secto r 8.4 percent, intermediate sector 0.6 percent, and downstream sector 2 percent. The productivity growth in upstream sector is more caused by the increasing of efficiency, on the other side the technological change decreased. This is quite different to what happened in intermediate and downstream sectors where the productivity growth is caused
by the technological advances while the efficiency level declined by 6-11 percent.
Figure 7. Changes in Productivity, Efficiency and Technology by Sector
Source: Central Bureau Statistics, processed
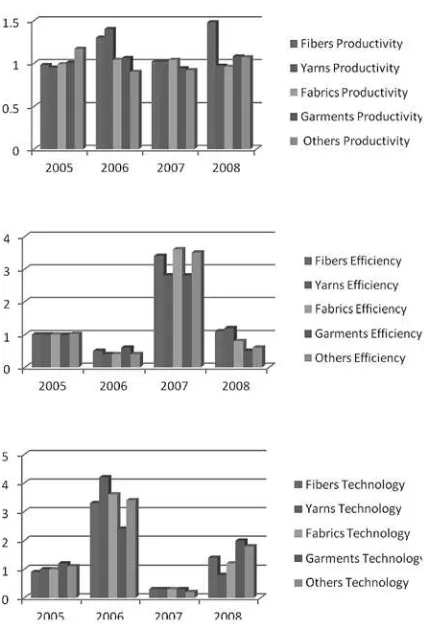
The Changes of Productivity of TPT Industry by Industry Group
Figure 8. Changes in Productivity, Efficiency and Technology By Industry Group
Source: Central Bureau Statistics, processed
The industry group that made the lowest productivity growth, in average, is the fabric industry group and other industry groups which are 0.6 percent and 0.7 percent. This is caused of the low technological improvement that is 5.9 percent and 14.5 percent; and the low efficiency level that is 5 percent and 12.1 percent.
2) The Impact of Efficiency and Import Penetration on the Productivity of TPT Industry The variables used in measuring and
analyzing the impacts of efficiency and import penetration on the productivity of TPT industry are dependent variable (productivity – prod), control variables (capital intensity – CAPIN, worker – TK, Herfindahl-Hirschman Index –
HHI, export dummy – DEKSP, foreign capital ownership dummy – DPMA, and imported raw material dummy – DBBIMP), technical progress variable (TP) which is the changes of technical efficiency (EFFCH), and import penetration variable (IMPEN). As stated before, estimation using econometric regression model is done. The estimation method applied is fixed effect or random effect that is aimed to find out the impacts of technical progress, import penetration and control variable on the productivity of TPT industry in the cross section level of each company.
The homoschedastics test result by using the Breusch-Pagan shows the homoschedastics condition where the probability value probability > chi2 larger than 5 percent of
the Ho: Homoschedastics, whereas from the multicollinearity test is found there is no multicollinearity condition (attachment).
Hausman test is done to choose fixed effect as the best model used, where the probability value is > chi2 less than 5 percent, and Ho:
random coefficient differences. Below is the estimation result by fixed effect model.
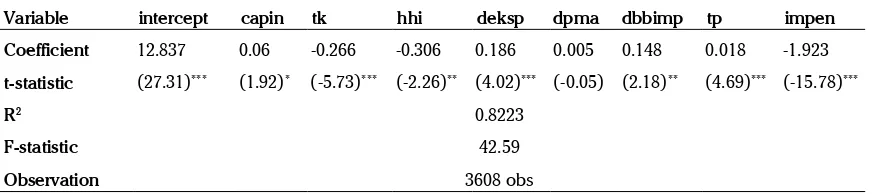
The result shows that the significant variable influencing the productivity (prod) is capital intensity (capin), worker (tk), technical progress (tp), industry consentration (HHI), import penetration (impen), imported raw material dummy (dbbimp), dan export oriented company dummy (deksp). Meanwhile, foreign ownership dummy variable (dpma) affected insignificantly to the productivity.
by increasing the rasio of capital-labor. While Christoffersen and Anusua (2004) said that textile companies in America that grew their capital intensive technology would increase their productivity level.
The worker variable makes negative and significant impact on the productivity. The bigger the number of the worker, the lower the productivity of the companies will be. Christoffersen and Anusua (2004) who conducted a research about productivity of textile industry in America found out that the companies that are downsizing in order to be capital instensive by doing the technological advances will grow their productivity. Moreover, Fernanders (2008) who did a study in Bangladesh found out that companies with big number of employees are facing the inefficiency in management coordination and supervision.
The Industry concentration variable (HHI) gives significant negative impact on the productivity. Industry concentration shows the level of competitiveness in domestic market. If the HHI is close to 0 (zero), the level of competitiveness is high, while if it is close to 1 (one) it can be said that it is a monopoly market. The research done by Nickell (1996) stated that the competitiveness, which is measured by the increase of competitors, has positive relation to the productivity growth. Market competition will increase the efficiency
since there is a force to lower the production cost and higher the innovation.
Export dummy variable gives significant positive impacts to the productivity growth. Companies doing export in order to expand their market will always develop their technology to maintain their products’ competitiveness. Foreign capital ownership dummy variable also gives significant positive impact to the productivity growth. These companies generally are having advanced technology, efficient management structure, and investment in research and development.
Imported raw material dummy variable gives significant positive impacts to the productivity growth. High quality imported materials will encourage companies to produce high quality products and bigger outputs; so that the productivity of the companies grow. On the other side, being dependent of using imported raw materials will give negative impact to the productivity level as what is stated by Kuncoro (2007) and Avenzora (2008).
The technical progress in the form of technical efficiency relates to the efficiency of workers in using the technology owned to produce bigger output. Technical progress (TP) variable gives significant positive impact on the productivity; the efficiency growth supported by workers’ skill improvement will produce bigger output in normal working time.
Variable intercept capin tk hhi deksp dpma dbbimp tp impen
Coefficient 12.837 0.06 -0.266 -0.306 0.186 0.005 0.148 0.018 -1.923
t-statistic (27.31)*** (1.92)* (-5.73)*** (-2.26)** (4.02)*** (-0.05) (2.18)** (4.69)*** (-15.78)***
R2 0.8223
F-statistic 42.59
Observation 3608 obs
Table 2. Estimation Result of the Impacts of Controlled Variable, Technical Progress, and Import Penetration on the Productivity of TPT Industry
Import penetration variable gives significant negative impact on the productivity. Free market will allow the domestic market be floaded by imported textile products (mostly from China) which later on will threaten the national textile products due to the unreadiness of the national textile industry in facing the industry competition. This conditition will force the national companies to decrease the number of their output which shows the decline of the companies’ productivity..
MANAGERIAL IMPLICATIONS
The study results provided insight for decision makers both in business and government to foster efficiency. For the business, it is important to maintain the quality of its production machines. Increasing efficiency can be made by replacing the old machines with new ones with more advanced technology. That will be followed with consequence in the need to improve skill of labor that operates the new machines. For the government, it is needed to provide facilitation and create a conducive business environment. The result also showed that industries in regions around main area were more efficient rather than in other area. Therefore, establishment of industrial centers with complete infrastructure will encourage industrial efficiency.
CONCLUSION
Generally, the technical efficiency of the textile companies and national textile products during 2004 – 2008 is relatively low that is around 40 percent. This is due to the low skill of the workers and the old machines owned by the companies. The productivity level of the TPT industry during 2005 – 2008, in average, increased by 2.4 percent which is more influenced by the technology changes instead of the efficiency changes.
The estimation result towards 902 TPT companies during the observation period shows that 484 companies made productivity growth and 378 companies made productivity decline.
Estimation result using fixed effect regression model shows that the variables of companies’ size, technical progress, import penetration and export dummy affect the productivity in the level of 1 percent. Industry concentration variable and imported raw material dummy affect the productivity in the level significancy of 5 percent, and capital intensity variable affect productivity in the level of significancy of 10 percent.
In conclusion, efficiency positively affects the companies’ productivity, while the import penetration (specifically from China) in domestic market affects negatively on the productivity of TPT sectors.
R E F E R E N C E S
Altomonte, C., Alessandro B. and Armando R. (2007). “Import Penetrasion, Intermediate Inputs and Productivity: Evidence from Italian Firm”. Working Paper: Dynreg 2008.
Alvarez, R. and Sebastian C. (2007). “David Versus Goliath: The Impact of Chinese Competition on Developing Countries”. Working Papers Central Bank of Chile 478, Central Bank of Chile.
Alviya, I. (2011). Efisiensi dan Produktivitas serta Faktor-Faktor yang Mempengaruhi Produktivitas Industri Kayu Olahan Indonesia Periode 2004-2007. Thesis. Program Pascasarjana Ilmu Ekonomi, Universitas Indonesia. DKI Jakarta. Amato, L.H. and Christie H.A. (2001). “The Effect of Global Competition on Total Factor Productivity in U.S. Manufacturing”.
Review of Industrial Organzation 19: 407-423.
Avenzora, A. (2008). Analisis Produktivitas dan Efisiensi Industri Tekstil dan PRoduk Tekstil di Indonesia Tahun 2002-2004. Thesis. Program Pascasarjana Ilmu Ekonomi, Universitas Indonesia. DKI Jakarta.
Badan Pusat Statistik. (2011). Berita Resmi Statistik: Pertumbuhan Ekonomi Indonesia Triwulan I-2011. No. 31/05/Th. XIV, 5 Mei 2011.
Banker, R.D., A. Chames and W.W. Cooper (1984), «Some Models for Estimating Technical and Scale Inefficiencies in Data Envelopment Analysis», Management Science, 30, 1078-1092.
Christoffersen, S. and Anusua D. (2004). “The Changing Structure of U.S. Textiles: Productivity Implications”. The Journal of Business and Economic Studies, Vol. 10, No. 2, 2004. pp. 28.
Coelli, T.J., Rao, D.S.P, andBattese, G.E. (2005). “An introduction to efficiency and productivity analysis (2nd ed.)”. USE: Springer.
Dennison, E. D. (1985). “Trends in American Economic Growth, 1929-1982”. Washington, DC: The Brookings Institution. Direktorat Industri Tekstil dan Produk Tekstil. (2010). “Fact and Figures Indonesia Textile Industry: Large Industry Period
2005-2009”. DKI Jakarta: Kementerian Perindustrian.
Fare R., Grosskopf, S. and Logan, J. (1983), «The Relative Efficiency of Illinois Electric Utilities», Resources and Energy, 5, 349-367.
Fernandes, A.M. (2006). “Firm Productivity in Bangladesh Manufacturing Industries”. World Bank Policy Research Working Paper, 3988.
Grosskopf, S. (1993), “Efficiency and Productivity», in Fried, H.O., C.A.K. Lovell and S.S. Schmidt (Eds.), The Measurement of Productive Efficiency: Techniques and Applications”,Oxford University Press, New York, 160-194.
Hseu, J.S., and Shang, J.K. (2005). “Productivity changes of pulp and paper industry in OECD countries, 1991-2000: A non-parametric Malmquist approach”. For. Pol. Econ., 7: 411-422.
Jajri, I. and Rahmah I. (2009). “Technical Progress and Labour Productivity in Small and Medium Scale Industry in Malaysia”. European Journal of Economics, Finance and Administrative Sciences – Issue 15. Euro Journal, Inc.
Joshi, R.N. and Singh. (2009). “Estimation of Total Factor Productivity in The Indian Garmen Industry”. Journal of Fashion Marketing and Management Vol. 14, No. 1, 2010, pp. 145-160.
Kadarsyah, Y. (2010). Analisis Total Faktor Produktivitas Industri Alas Kaki Indonesia Tahun 2003-2006. Thesis. Program Pascasarjana Ilmu Ekonomi, Universitas Indonesia. DKI Jakarta.
Kementerian Energi dan Sumber Daya Mineral. (2009). “Handbook of Energy & Economics Statistic of Indonesia”. DKI Jakarta: Kementerian Energi dan Sumber Daya Mineral.
Kuncoro, M. (2007). Ekonomika Industri Indonesia . CV. Andi. Yogyakarta.
Ma, J., Evans, D.G., Fuller, R.G., and Stewart, D.F. (2002). «Technical efficiency and productivity change of China’s iron and steel industry». International Journal of Production Economics, Vol. 76 No. 3, pp. 293-312.
Margono, H. (2004).” Technical Efficiency and Productivity Analysis in Indonesian Provincial Economies”. Discussion paper 26. Southern Illinois University Carbondale.
Miranti, E. (2007). Mencermati Kinerja Tekstil Indonesia: Antara Potensi dan Peluang. Economic Review, No. 209, September 2009.
Nickell, S.J. (1996). “Competition and Corporate Performance”. Journal of Political Economy, Vol. 104, No. 4 (Aug., 1996), pp. 724-746.
Sumanth, D. J. (1984). “Implementation Steps for a Productivity Measurement Programs in Companies”. IIE Conf. Proc. Xiaoying. (2004). “Efficiency and Value Creation in Acquisitions and Divestitures: Evidence from the US Property-Liability