Intensive Journal
http://ojs.uniska-bjm.ac.id/index.php/EJB E-ISSN 1513567470
October 2018, Vol 1 No.2
1
THE INFLUENCE OF WATCHING YOUTUBE PRONUNCIATION VIDEOS
TOWARDS STUDENTS’ PRONUNCIATION ABILITY
Danu Herjuantoro
Raden Intan State Islamic University, Lampung Syaifudin Latif Darmawan
Muhammadiyah University of Metro, Lampung [email protected]
Abstract: In language teaching, media is one of the tools that very useful to support its successful teaching. In teaching pronunciation, the students need to give additional information how to pronounce words. One of the ways is by using Youtube pronunciation videos. By using Youtube pronunciation videos, the students will get more input and knowledge how to pronounce words from the native. The objective of this research is to know whether there is a significant influence of watching Youtube pronunciation videos towards students’ pronunciation ability. There were two variables in this research, the independent variable (X) was Youtube Pronunciation videos and dependent variable (Y) was the students’ pronunciation ability. The research method used was experimental design. The researchers dealt with two classes, they were an experimental class and a control class. In the experimental class, the researchers used Youtube pronunciation videos, whereas in control class the researchers did not use any media. Each class received the same pre-test and post-test. The population of this research was the second year students of MAN 1 Model Bandar Lampung. The samples of this research were two classes consisting of 90 students. In collecting the data, the researchers used reading aloud test as the instrument. After doing the data analysis, it was found that there is a significant influence of using videos towards students’ pronunciation ability. It can be seen from the result of the T test that T-observed was 5.34615, and the result of T-critical was 1.67. It means that T-observed was higher than T-critical (T-observed > T-critical). Therefore, the hypothesis is accepted. This result means that there is significant influence of watching Youtube pronunciation videos towards students’ pronunciation ability.
Keywords: Pronounciation Video in Youtube, Student’ Ability in Pronounciation
Introduction
Intensive Journal
http://ojs.uniska-bjm.ac.id/index.php/EJB E-ISSN 1513567470
October 2018, Vol 1 No.2
2
reach in the informational level, because they prepared to continue their study to the university. The communicative competence taught in learning English covers four skills; listening, speaking, reading, and writing. From those skills, speaking is the most important skill that has to be master, Richards (2008: 19) states, “The mastery of speaking skills in English is a priority for many second-language or foreign-language learners”. It means the mastery of speaking skill is important for students, because oral communication requires the ability of speaking.
In speaking class, the students should be taught how to speak. The components of English speaking skill that should be given and studied in English speaking class are pronunciation, vocabulary, grammar, fluency, and comprehension. Speaking is the most important skill, because it is one of the abilities to carry out conversation on the language. It is an interactive process of constructing meaning, receiving, and processing information. But in English class, teaching speaking often ignore by the teacher. Harmer (2007: 248) says that almost all English language teachers get students to study grammar and vocabulary, practice functional dialogues, take part in productive skill activities and try to become competent in listening and reading. From Harmer explanation, we know that teachers make little attempt to teach speaking, thus the students are not active in speaking activities.
According to Nurdin Somantri (2003), most of students in Senior High School cannot speak English well. One of the problems is because of their pronunciation ability. He continued
with Zamroni statement, that “Our education problems are tend to be social stratification and
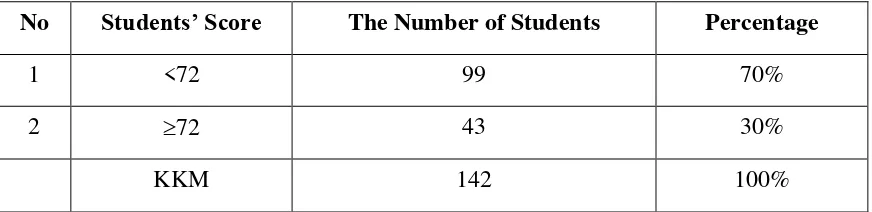
education system school just transfer the dead knowledge. From this statement, it can be concluded that speaking is requires the pronunciation ability. Furthermore, the researchers conducted a preliminary research in MAN 1 Model Bandar Lampung to know the students’ pronunciation ability. Based on the preliminary research, most of the students score in pronunciation is under the standard score.
Table 1
Students’ Pronunciation Ability
No Students’ Score The Number of Students Percentage
1 <72 99 70%
2 72 43 30%
KKM 142 100%
Source: English teacher’s document of MAN 1 Model Bandar Lampung
From the table above the researchers assumes that the student’ pronunciation ability is
still under the KKM standard. There are only 30% student’s got score over 72, and 70% got
Intensive Journal
http://ojs.uniska-bjm.ac.id/index.php/EJB E-ISSN 1513567470
October 2018, Vol 1 No.2
3
In this research, one of the internet media that will be used by the researchers is YouTube videos. By using YouTube pronunciation videos the students can learn how to pronounce English sounds correctly or minimally acceptable by learned from the native.
Formulation of the Problem
Is there any significant influence of watching YouTube pronunciation videos towards students’ ability in pronouncing English pure vowel sounds and diphthongs?”
Method of Research
In order to know whether there is significant influence of students’ pronunciation ability by watching Youtube pronunciation videos, the researchers conducted an experimental research. It is a quantitative study that has two classes; one as the experimental class and the other one is the control class. The experimental class is a class that gave the treatment and the control class is a class that did not give the treatment. For the experimental class, the researchers used Youtube pronunciation videos in teaching pronunciation. Meanwhile, the researchers did not use any media to the control class in teaching pronunciation.
The research design is presented as follows:
Where:
G1= experimental class G2= control class
T1 = Pre- test X= Treatments by watching Youtube pronunciation
O = Treatments by did not using any media T2= Post-test1
There are two variables in this research; dependent and independent variables. Based on the problem, in this research the dependent variable is students’ ability in pronouncing verbs and the independent variable is watching Youtube pronunciation videos.
Subject
Population in a research is subject, it can be people or group of people that investigated by the researchers. Arikunto (2006: 130) states that population is a set or collection of all
G1 (random) T1 X T2
Intensive Journal
http://ojs.uniska-bjm.ac.id/index.php/EJB E-ISSN 1513567470
October 2018, Vol 1 No.2
4
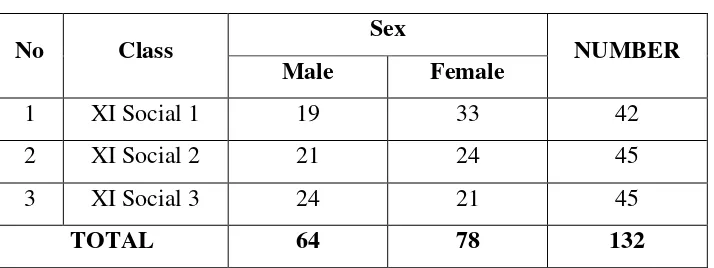
elements consisting one or more attribute of interest. The population of this research is grade eleventh social class students of MAN 1 Model Bandar Lampung at the first semester in academic year 2017/2018. It consists of 132 students. The researchers chose these classes because they are regular classes and homogenous.
Table 2
The number of students grade eleventh social class
No Class Sex NUMBER Male Female
1 XI Social 1 19 33 42
2 XI Social 2 21 24 45
3 XI Social 3 24 21 45
TOTAL 64 78 132
Source: English teacher of MAN 1 Model Bandar Lampung
Sample
The sample of this research has been chosen by using Cluster Random Sampling. The researchers chose this sampling technique because the population are in classes and homogenous. The researchers select two classes as the sample. The name of each class wrote in small piece of paper, then the papers rolled and put in a box. After that, the box shake, then the researchers took one piece of the rolled paper. The first paper chosen opened and the class written was the experimental class. Then the researchers took the second paper and the class written was the control class.
Data Collection Technique
To collect the data, the researchers used three kinds of techniques, as follows:
Pre-test
Pretest is used to know the students’ pronunciation ability before the treatments. The
test is orally with the students should read a text and the researchers record it. The recorded result of each student analyzed and scored to know the students’ pronunciation ability in pronouncing English vowel sounds.
Post-test
Intensive Journal
http://ojs.uniska-bjm.ac.id/index.php/EJB E-ISSN 1513567470
October 2018, Vol 1 No.2
5
as the pretest, because both of them used to measure the students’ pronunciation ability by
watching
Youtube pronunciation videos the development of students’ pronunciation ability after Youtube pronunciation videos applied.
Instrument
Arikunto (2006: 149) states that research instrument is a device used by the writer during the data collection. The instrument in this research was test. The researchers used oral test form and it was read a text. The test is used for pretest and posttest. Pretest has been given
to check the students’ ability in pronouncing vowel sounds before treatment. Posttest is use to
gain the data of the students’ ability in pronouncing vowel sounds after the treatment. The raters were the English teacher and the researchers.
1. Pre-test Instrument
For the pre-test instrument, the students asked to read a text and the researchers recorded
it. The title of the text is The Man and The Serpent.
2. Post-test Instrument
For the post-test instrument, the students asked to read a text and the researchers record
it. The title of the text is Golden Eggs. After giving the test above, the recorded data scored. The scoring was used to measuring the students’ vowel sounds.
Validity
According to Arikunto (2011: 168), “Validity is a measurement which shows the level
of validity or the real of the instrument.” Consequently, a valid instrument has a high validity,
meanwhile the instrument which is lack of lack of goodness has a low validity. An instrument can be called valid if it can show the data of variable are researched correctly. To measure the validity of the instrument, the researchers used content validity and construct validity.
Data Anayisis Technique Content Validity
Content validity is a type of evidence in which the content of test is judged to be representative of a larger domain of content. To get the content validity, the researchers consulted the instrument to the English teacher grade XI of MAN 1 Model Bandar Lampung, Mrs. Heny Astuti, S.Pd to make sure that the instrument is valid. After the researchers consulted to the English teacher, Mrs. Heny Astuti, S.Pd said that the instrument was valid.
Intensive Journal
http://ojs.uniska-bjm.ac.id/index.php/EJB E-ISSN 1513567470
October 2018, Vol 1 No.2
6
Construct validity focuses on the kind of test that is used to measure the ability. According to Setiyadi (2006: 26), construct validity is used to measure perception, language behavior, motivation, even the language ability. In this session the researchers asked the
English teacher to measure the construct validity of the instrument. After the researchers asked to Mrs. Heny Astuti, she said the instrument was valid.
Reliability
Reliability shows the degree of mainstays about something. It means the data can be believed so it can be relied on. According to Arikunto (2011: 178), reliability shows that the instrument can be believed to be used as a tool of data collecting technique when the instrument is good enough. To know the reliability of test, the researchers used the following steps:
1. Giving pre-test and post-test items to 20 students out of sample. 2. Collecting the result and analyzing it.
3. Analyzing the difference between the pre-test and post-test result.
To get the reliability of the test, the researchers used inters rater reliability. It has done by two raters who examined the students’ speaking test with the intention of knowing the reliability of the test. The raters were the researchers and Mrs. Heny Astuti, S.Pd. The statistical formula for counting the reliability was as follows:
Acording to Sudijono (2009: 232) states that
𝑅 = 1 − 𝑛 (𝑛6 (∑𝑑2−1)2)
Notes:
R = reliability
d = the difference of rank correlation
n = number of students.
Data Analysis Normality Test
To measure the normality test, the researchers used Lilliefors test as follows:
Sudjana (2005: 466)
a. Arrange the sample’s data from the lowest until the highest
b. Determine the score Z from each data by using the following formula:
𝑧𝑖 =𝑥𝑖−𝑥̅
Intensive Journal
http://ojs.uniska-bjm.ac.id/index.php/EJB E-ISSN 1513567470
October 2018, Vol 1 No.2
7
c. Count the cumulative frequency of each Z score S(z),
𝑆𝑧 = 𝑧1,𝑧2,……..𝑧𝑛 ≤𝑖𝑛
d. Count the differential of F(Zi) – S(Zi)
e. Determining the L0, score with the Lcritical highest score, compared to the score from the table of Lilliefors.
f. The hypotheses for the normality test are formulated as follows : Ho: the data are normally distributed
Ha: the data are not normally distributed
g. The criteria are as follows :
1. Ho is accepted if L-observed is lower than L-critical, means the distribution of the data is normal.
2. Ha is rejected if L-observed is higher than L-critical, means the distribution of the data is not normal.
homogenity test
This test is intended to test whether the variance of the data in the experimental class
and in the control class is equal or not. The formula is:
𝐹 = 𝑆12
The hypotheses for the homogenity test are formulated as follows:
Ho: data have the homogenous variances Ha: data have not homogenous variances
The criteria are:
1. Ho is accepted if F-observed is lower than or equal to F-critical means the variance of the data is homogenous.
2. Ha is rejected if F-observed is higher than F-critical means the variance of the data is heterogonous.
1) Hypothetical Test
To measure the hypothesis, the researchers used formula as follows :
t-test = 𝑀𝑥−𝑀𝑦
(𝑁𝑥+𝑁𝑦−2∑𝑥2− ∑𝑦2) (𝑁𝑥1+ 𝑁𝑦1)
Intensive Journal
http://ojs.uniska-bjm.ac.id/index.php/EJB E-ISSN 1513567470
October 2018, Vol 1 No.2
8
Mx = mean of control class
My = mean of experimental class ∑x2 = average deviation in control class
∑y2 = average deviation in experimental class N = subject in sample with df = Nx + Ny – 2. Arikunto(2011: 311)
The hypotheses are:
Ho : There is no significant influence of watching Youtube pronunciation
towards students’ pronunciation ability.
Ha : There is significant influence of watching Youtube pronunciation towards
students’ pronunciation ability. The criteria are as follows:
Ho : is received if t observed < t critical
Ha : is received if t observed ˃ t critical
Result
Result of Reliability
Reliability shows that the instrument can be believed to be used as a tool of data collecting technique when the instrument is good enough.
1. Reliability of Pre-test
From the calculation above, the result of pre-test is 0.62. it means that the data is very high reliability.
2. Reliability of Post-test
From the calculation above, the result of pre-test is 0.66. it means that the data is very high reliability.
Result of Normality Test
Intensive Journal
http://ojs.uniska-bjm.ac.id/index.php/EJB E-ISSN 1513567470
October 2018, Vol 1 No.2
9
Table 3
Normality of the Experimental and Control class
Class
Pre test Post test
Conclusion L_Observed L_Critical L_Observed L_Critical
Experimental 0.12536 0.13207 0.10855 0.13207 Normal
Control 0.12716 0.13207 0.11457 0.13207 Normal Source: data formulated
Based on the table above, it can be seen that in experimental and control class shows L_Observed ≤ L_Critical. So, the conclusion is that the population is in the normal distribution.
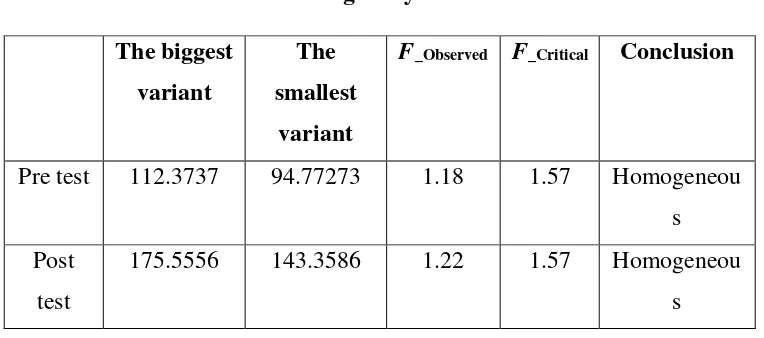
Result of Homogenity Test
Homogenity test is used to know whether the variance of the data is homogenous or not.
Homogeneity Test The biggest
variant
The smallest
variant
F_Observed F_Critical Conclusion
Pre test 112.3737 94.77273 1.18 1.57 Homogeneou
s
Post
test
175.5556 143.3586 1.22 1.57 Homogeneou
s
Based on the table above, it can be seen at result of the test in pre test and post test,
Intensive Journal
http://ojs.uniska-bjm.ac.id/index.php/EJB E-ISSN 1513567470
October 2018, Vol 1 No.2
10
proves that Ho is accepted because F_Observed < F_Critical. It means that the variance of the data is
Homogeneous.
Result of Post-test
In the last activity, the students did the post-test. Post-test was held to know the students
score after got the treatment.
The average of the students’ result = The scores of the student
The number of the students
= 5675
90
= 63.05
From the analysis, the average achievement of the students’ post-test was 63.05.
Hypothetical test is used to know whether there is significant influence of watching Youtube pronunciation videos towards students pronunciation ability towards students’ pronunciation ability or not.
Based on t-test result calculation (see appendix 14) obtained t-test = 5.35. t_Critical at degree of significance 5% and df = NX + NY - 2 = 45+45-2=88 gain t-test = 1.66. Since 5.35 > 1.66, Ho is refused and Ha is accepted. It means that the treatment has influence of the students’ score. It means that there is significant influence of watching Youtube pronunciation videos towards students’ pronunciation ability of MAN 1 Model Bandar Lampung.
Discussion
According to the result of the students’ post-test score, the average of students’ post
-test score in experimental class was 64,333. The average of students’ post-test score in control
class was 61,778. It shows that the students’ post-test score in experimental class was higher
than students’ post-test score in control class.
Moreover, from the calculation of students’ pre-test and post-test score using t-test,
the result of t_observed was 5.35 when the result of t_critical was 1.66. It means that t_observed was higher than t_critical (T-observed > T-critical). Therefore, the Ha hypothesis is accepted.
Intensive Journal
http://ojs.uniska-bjm.ac.id/index.php/EJB E-ISSN 1513567470
October 2018, Vol 1 No.2
11
students’ pronunciation ability at grade eleventh of MAN 1 Model Bandar Lampung at the first
semester in 2017/2018 academic year.
Conclusion
Based on the data analysis, it can be concluded that there is significant influence of watching YouTube pronunciation videos towards students’ pronunciation ability. It can be seen from the result of t test that t_observe is 5.34615, and the t_critical is 1.66. The criteria to know whether the hypothesis is accepted or not, dealt t_observe is higher than t_critical (t_observe t_critical). From this statement, it is clear that 5.34616 is higher than 1.66. Therefore, Ho is rejected and Ha is accepted. This result means that there is significant influence of watching YouTube pronunciation videos towards students’ pronunciation ability.
REFERENCES
Arikunto, Suharsimi. 2006. Prosedur Penelitian Suatu Pendekatan Praktik, Jakarta: Rineka Cipta
AMEP Research Centre. 2002. Fact Sheet-What is Pronunciation?. Journal [Online]. Available at: http://www.nceltr.mq.edu.au/pdamep [November 10, 2012]
Arsyad, Azhar. 2011. Media Pembelajaran. Jakarta: Rajawali Pers
Gilbert, Judy B. 2000. Teaching Pronunciation Using the Prosody Pyramid. USA: Cambridge University Press
Harmer, Jeremy. 2007. The Practice of English Language Teaching. England: Pearson Education Limited
Hornby, As. 2000. Oxford Advanced Learner’s Dictionary of Current English. England: Oxford University Press
Jones, Daniel. 1956. The Pronunciation of English. New York: Cambridge University Press Kelly, Gerald. 2000. How to Teach Pronunciation. England: Pearson Education
Limited
Ogden, Richards. 2009. An Introduction to English Phonetics. Edinburgh: Edinburgh University Press
Richards, Jack C. 2008. Teaching Listening and Speaking from Theory to Practice. USA: Cambridge University Press
Roach, Peter. 1991. English Phonetics and Phonology. New York: Cambridge
University Press
Setiyadi, Ag. Bambang. 2006. Metode Penelitian Untung Pengajaran Bahasa Asing. Jogjakarta: Graha Ilmu
___________________ 2006. Teaching English as a Foreign Language. Yogyakarta: Graha Ilmu
Intensive Journal
http://ojs.uniska-bjm.ac.id/index.php/EJB E-ISSN 1513567470
October 2018, Vol 1 No.2
12
Sudjiono, Anas. 2009. Pengantar Statistik Pendidikan. Jakarta: Rajawali Press Suparno. 2010. Optimizing the use of “Youtube Videos” to improve students’ speaking ability. (a thesis)
Thornbury, Scott. 2005. How to Teach Speaking. New York, Longman Inc
The Rule of The Ministry of Education no. 22, TheCompetency Standard and Basic
Competence of Senior and Islamic Senior High School, 2006
McMillan, James H., Schumacher, Shally. 2001. Research in Education. New York: Wesley Longman Inc
Nurdin Somantri, Penerapan Metode Simulasi Tematis untuk Meningkatkan Kemampuan
Bahasa Inggris Siswa, 2003,in Pendidikan Network [Online], Available at: