THE EFFECTS OF STUDENT’S PERCEPTION ON USING AUDIO VISUAL MEDIA AND INDEPENDENT LEARNING TOWARDS
STUDENT’S READING SKILL
(Survey at State Senior High School in East Jakarta)
Rina Husnaini Febriyanti
English Departement
Language and Art Faculty Indraprasta PGRI University Jl. Nangka 58 Tanjung Barat, Jakarta Selatan, Indonesia
Abstract
The aim of this research is to know the effects of student’s perception on using audio visual media
and independent learning altogether towards student’s reading skill. And, to know the effect of
student’s perception on using audio visual media towards student’s reading skill, next, to know the
effect of independent learning towards reading skill. The research method which is used is survey. The amount of sample is 60 students who are chosen randomly (cluster random sampling) out of 3 schools in East Jakarta (SMA Negeri 88, 99, and 51 Jakarta) grade X in academic year 2012/2013. The data collection is implemented by using the technique of spreading 2 kinds of questionnaires and 1 kind of multiple choice test. The scale which is used for the questionnaires are Likert scale, the validity is calculated by using coefficient correlation of Pearson- Product Moment, and reliability is formulated by using Cronbach Alpha Method the result is 0,813 it is for
student’s perception on using audio visual media and it is 0,555 for independent learning. For the test, the validity of student’s reading skill is calculated by using Point Biserial, and the reliability
is formulated using Kuder Richardson-20 the result is 0, 8721.
Key Word: Student’s Perception On Using Audio Visual Media, Independent Learning, Student’s
Reading Skill
Abstrak
Tujuan dari penelitian ini adalah untuk mengetahui pengaruh persepsi siswa pada penggunaan media audio visual dan kemandirian belajar secara bersama-sama terhadap kemampuan keahlian membaca peserta didik. Dan, untuk mengetahui pengaruh persepsi siswa pada penggunaan media audio visual terhadap kemampuan keahlian membaca peserta didik. Selanjutnya, untuk mengetahui pengaruh kemandirian belajar terhadap kemampuan keahlian membaca peserta didik. Metode penelitian yang digunakan adalah survei. Sample berukuran 60 peserta didik yang dipilih secara random (cluster random sampling) dari 3 sekolah SMA Negeri Jakarta Timur ( SMA Negeri 88, 99, dan 51 Jakarta) kelas X tahun ajaran 2012/2013. Pengumpulan data dilaksanakan dengan tehnik penyebaran 2 jenis angket dan 1 jenis tes pilihan ganda. Skala yang digunakan untuk angket adalah skala Likert, validitas dihitung dengan koefesien korelasi Pearson- Product Moment, dan reliabilitas menggunakan rumus Cronbach Alpha Method di peroleh hasil sebesar 0,813 untuk persepsi siswa pada penggunaan media audio visual dan 0,555 untuk kemandirian belajar. Untuk tes kemampuan keahlian membaca peserta didik validitas di hitung dengan rumus Point Biserial, dan reliabilitas menggunakan rumus Kuder Richardson-20 di peroleh hasil sebesar 0, 8721.
A. INTRODUCTION
Education is a part of crucial thing in human life. As Nelson Mandela states in
the following quotation, “Education is the most powerful weapon which you
can use to change the world.”
(http://www.brainyquote.com/quotes/authors/n/nelson_mandela.html).
It means, on the other words, it can be said that from the poorest of countries to the richest of nations, education is the key to moving forward in any society. It is also stated on The Universal Declaration of Human Rights (1948: Article 26 (1)) as follows:
“Everyone has the right to education. Education shall be free, at least in the
elementary and fundamental stages. Elementary education shall be compulsory. Technical and professional education shall be made generally available and higher education shall be equally accessible to all on the basis of
merit.” (http://www.un.org/en/documents/udhr/index.shtml)
That statement refers to all human life in this world. Hence, it is not only for man but also for woman. It is obvious that every human has a right to get an education by studying whether from in formal or informal environment. Formally, an education can be received from school institutions. On the other hand, informal education is from non school institutions. By having an education human can survive in this world to get a qualified life. It means in human life does not only thinking about bread or feeding stomach but also how to nurture life becomes in well quality.
Nowadays, education system in almost the whole world is getting better and better. It is followed by the development of information, communication, and technology. Those aspects are used to get an easier way for the teachers and learners who are involved in education. Those matters also occur in a part of English language teaching and learning process. As a matter of fact, English subject is a very important to be learnt for following the progressing of education in this world. It can not be denied that by mastering English people can open the window of the world. It is because almost the resources of knowledge are commonly preceded in English language whether in oral or in written.
by the reader from long- term memory, as background knowledge. It means that reading skill involves an active search for information and interaction with the text. Studying a kind of texts is very important to comprehend its content, structure, social function, language feature and the purpose. There are many kinds of texts (genres of texts) such as recount, report, analytical exposition, news item, anecdote, narrative, procedure, description, hortatory exposition, explanation, discussion, review, and commentary. Each of them has a specific social function, schematic structure, and significant grammatical pattern of text. Here, the writer only focuses on narrative text as one of genres of texts.
Narrative text actually is interested to be analyzed and comprehended, it because the content of the text tells to amuse and entertain to the reader. The story in a narrative text can be a fiction or non fiction but somehow mostly the story is reflected from real life, so that it is very liked by the reader. Through its text can represent a particular culture, social background, language used, imagination and so on.
There many messages that can be learnt and useful from narrative texts such as morality, social life, science knowledge, religious aspect, hope and dream, life point of view, inspiring motivation, linguistic aspect and others. Those messages can be useful if the readers comprehend the content of the text well. But there will be a huge problem if the reader does not understand the major problem of reading a text, it is a language.
Indonesian students are foreign language learners of English but today this is not a weird thing anymore for them, because get the English subject from primary school even though in a very limited meeting a week. But in fact, Indonesian students still have difficulties to comprehend narrative texts in reading skill especially for grade X SMA students in SMA Negeri 88, 99, and 51 Jakarta. Meanwhile, in this level students are supposed to acquire in comprehending narrative texts.
Classic method is commonly used in teaching a narrative text like teacher is in the front of the class and retelling the story while the students are listening with looking at the reading text. This situation makes the students in the classroom get sleepy, bored, whispering each other for discussing other topics. It can be seen that the condition does not support the learning- teaching activities in the classroom. The students are looked like passively rather than actively in learning process. Therefore, reading comprehension in narrative texts by the students can not be maximal.
states that (1999: 25-26) there are many elements that involve in learning process, one of them is teaching tools likely audio visual media.
Audio visual media is chosen as properly media for students in comprehending narrative text to motivate students in learning process. Rather than, the students get only monotone method by listening of retelling story that is done by a teacher. Hope that by using audio visual media as a tool in learning process can reduce feeling of bored, sleepy, uninterested, and other
attitudes that are not supporting but it can raise students’ independent learning
on comprehending narrative texts in reading skill, especially on English subject.
Today, the facilities of using audio visual media is not a luxurious thing anymore especially in East Jakarta for senior high school level. Therefore, this research only studies in East Jakarta related to one of the research aims that is
to know the effects of student’s perception on using audio visual media.
Moreover, the internal aspect to improve the capabilities of learning something is also very important. As in this research, it is only limited on the internal aspect of the study which is an independent learning.
B. DISCUSSION
This discussion precedes the description of data, the requirement test, test of hypothesis, and interpretation of the research. Furthermore, related to the discussion in this research study is presented in the following explanation. 1. The Description of Data
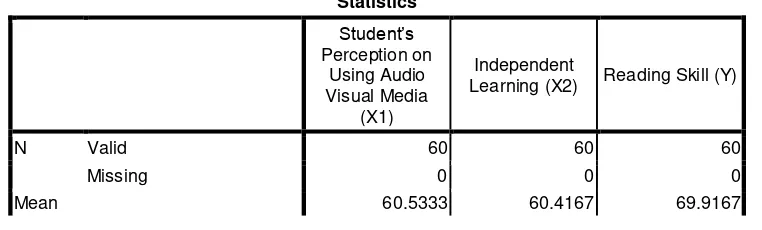
Student’s perception on using audio visual media and independent learning data are taken from the giving of questionnaires. The questionnaires which were given to the students are statements that consist of 20 statements that had been tested their validity and reliability. Meanwhile, student’s reading skill data was taken from a test which consists of 20 numbers of questions. Then, the researcher uses SPSS program version 17.00 to get easier on analyzing the data, and the result as follows:
Table 1
Description of Data Research
Statistics
Student’s Perception on
Using Audio Visual Media
(X1)
Independent
Learning (X2) Reading Skill (Y)
N Valid 60 60 60
Missing 0 0 0
Median 61.0000 60.0000 70.0000
Mode 62.00 61.00 65.00
Std. Deviation 2.72133 3.48990 9.72031
Variance 7.406 12.179 94.484
Source: the Primer data is processed by using SPSS Ver.17
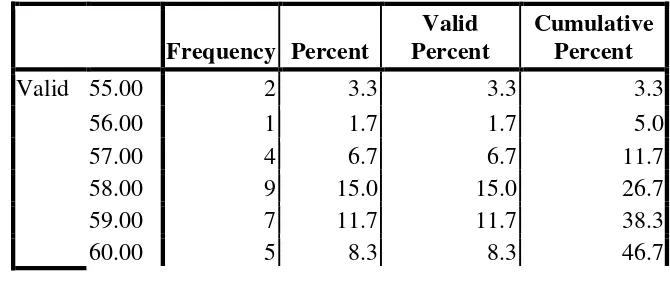
a. The Result of Student’s Perception on Using Audio Visual Media Questionnaires
The data of student’s perception on using audio visual media was got
from the giving of questionnaires to the students. The questionnaires which consist of 20 numbers that are statements of positive and negative sentences, which are tested their validity and reliability, the result is in the following explanation:
Table 1 statistics student’s perception on using audio visual media is
known of 60 respondents is got the lowest score is 55 and the highest
score is 68. Meanwhile, the average score (mean) of student’s
perception on using audio visual media is 60,533, the often appearance score (mode) is 62 and the middle score (median) data is at the position of 61.
Therefore, it can be concluded the tendency of respondents on
answering the student’s perception on using audio visual media
questionnaire at the position of 61, that score is strengthened by the percentile score which is on the middle position (50%) the score is 61. On the other hand, the score that shows the variance level of the data group which is called standard deviation is 2.72133 and if the standard deviation is quadrate the variance score is 7.406.
Table 2
61.00 9 15.0 15.0 61.7
62.00 12 20.0 20.0 81.7
63.00 2 3.3 3.3 85.0
64.00 6 10.0 10.0 95.0
65.00 1 1.7 1.7 96.7
67.00 1 1.7 1.7 98.3
68.00 1 1.7 1.7 100.0
Total 60 100.0 100.0
The frequency distribution table which is preceded on the table 2
above, the result of student’s perception on using audio visual media questionnaire out of 60 respondents with the lowest score is 55 as amount of 2 students or as number of 3, 3% from the available respondents, and the highest score is 68 the amount of student is 1student or in the percent of 1,7% out of the available respondents. The highest number of frequency (modus) on the questionnaire score is 62 the number of students is 12 students or 20% out of the available respondents.
Picture 1
Histogram Data of Student’s Perception on Using Visual Media
The picture 1 or the histogram above, is more clearly describing the
condition of the data result of student’s perception on using audio
curve with the kurtosis score is 0,120. And the skewness score is 0,273 showing a positive distribution or the left and right tail is inclined in equal at the same level.
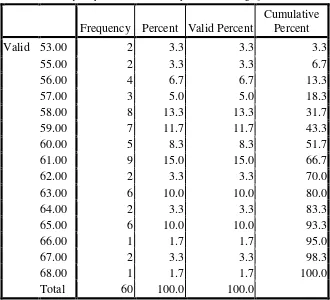
b. The Result of Independent Learning Questionnaire
Table statistics of independent learning questionnaire is known out of 60 respondents is obtained on the lowest level is 53 and the highest score is 68. Meanwhile, the average score (mean) the result of independent learning questionnaire is 60,417, the frequently appearance score (mode) is 61 and the middle score (median) at the position of 60, 00.
Therefore, it can be concluded that the inclined of respondents on answering independent learning questionnaire at the position of 60, that score is strengthened by the percentile score which is in the middle position (50%) is at the score of 60,00. Meanwhile, the score which shows the variance level of data group that is named standard deviation is 3.48990 and if the standard deviation is quadrate the variance score is 12.179.
Table 3
Frequency Distribution of Independent Learning Questionnaire
Frequency Percent Valid Percent
Cumulative Percent
Valid 53.00 2 3.3 3.3 3.3
55.00 2 3.3 3.3 6.7
56.00 4 6.7 6.7 13.3
57.00 3 5.0 5.0 18.3
58.00 8 13.3 13.3 31.7
59.00 7 11.7 11.7 43.3
60.00 5 8.3 8.3 51.7
61.00 9 15.0 15.0 66.7
62.00 2 3.3 3.3 70.0
63.00 6 10.0 10.0 80.0
64.00 2 3.3 3.3 83.3
65.00 6 10.0 10.0 93.3
66.00 1 1.7 1.7 95.0
67.00 2 3.3 3.3 98.3
68.00 1 1.7 1.7 100.0
Total 60 100.0 100.0
Source: Primer Data is processed by using SPSS Ver.17
percent of 3,3% out of 60 respondents, and the highest score is 68 the number of the student is 1 student or 1,7% out of the available respondents. The amount of the highest frequency is (modus) at the position of 61the number of student is 9 students or 15% out of the available respondents.
Picture 2
Histogram Data of Independent Learning
On the picture, the histogram is clearly describing the condition of independent learning out of 60 respondents, with the average score is 60,42 and the standard deviation score is 3,49 which forms a normal curve that quietly sharp which is named leptokurtic curve with the score of kurtosis is -0.465. And at an angle of curve on the negative position or data average (curve tailed) is more at the left side of a normal curve with the score of swekness is 0,096.
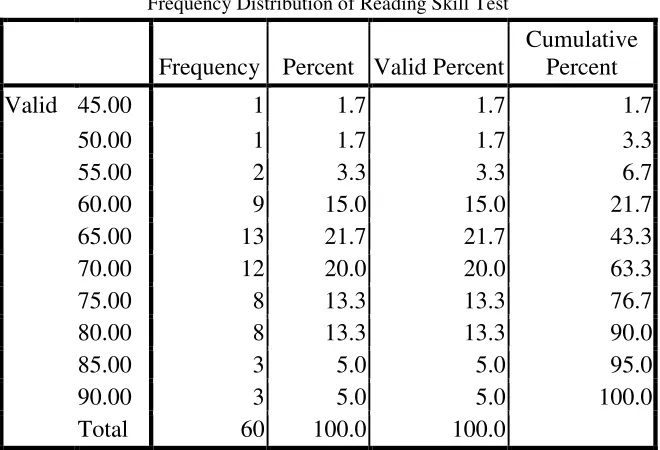
c. The Result of Student’s Reading Skill Test
The data of student’s reading skill is obtained by doing a test to the
student. Reading skill test consists of 20 multiple choice questions, which have been tested the difference quality, difficulty level, the validity, and reliability of the question.
Therefore, it can be concluded that the average ability of the respondents on the reading skill test on the good position. The ability of respondents are strengthened with the percentiles score with the position at middle position (50%) is at the score of 70. Otherwise, the score which shows the variation level of the data group which is namely standard deviation is 9.72031 and the standard deviation is quadrate on the variance score of 94.484.
Table 4
Frequency Distribution of Reading Skill Test
Frequency Percent Valid Percent
Cumulative Percent
Valid 45.00 1 1.7 1.7 1.7
50.00 1 1.7 1.7 3.3
55.00 2 3.3 3.3 6.7
60.00 9 15.0 15.0 21.7
65.00 13 21.7 21.7 43.3
70.00 12 20.0 20.0 63.3
75.00 8 13.3 13.3 76.7
80.00 8 13.3 13.3 90.0
85.00 3 5.0 5.0 95.0
90.00 3 5.0 5.0 100.0
Total 60 100.0 100.0
Source : The Primer Data is processed by using SPSS Ver.17
The frequency distribution table above, it is seemed the result score of
student’s reading skill test out of 60 respondents with the lowest score
Picture 3
HistogramData of Reading Skill
From the picture, the histogram above is clearly more describing the
condition of data result of student’s reading skill test out of 60
respondents, the average score is 69,92 and the standard deviation is 9,72. It forms a normal curve which is inclined neither sharp nor flat that distribution is called mesokurtic with the score of kurtosis is -0,074. And the score of skewness is -0,067 it shows the positive distribution or the left tailed and the right tailed are inclined showing at the equal level or balance.
2. The Requirement of Data a. The Data Normality Test
A Normality test for the data is used to test a continue data which the distribution is normal or not. Therefore, the data analyzed by using tobserved, multiple correlation, or partial correlation, single regression or multiple regression can be implemented.
Based on the analysis of Picture 1, 2, and 3 can be seen that the result
Table 5
The Recapitulation Result of Normality Test
One-Sample Kolmogorov-Smirnov Test
Perception on Using Audio Visual Media
(X1)
Independent Learning (X2)
Reading Skill (Y)
N 60 60 60
Normal Parametersa,,b Mean 60.5333 60.4167 69.9167
Std. Deviation 2.72133 3.48990 9.72031
Most Extreme Differences Absolute .112 .100 .130
Positive .112 .100 .130
Negative -.101 -.072 -.090
Kolmogorov-Smirnov Z .865 .777 1.006
Asymp. Sig. (2-tailed) .443 .582 .263
a. Test distribution is Normal. b. Calculated from data.
Source: primer data is processed by using SPSS version 17
The Normality test of variable student’s perception on using audio
visual media based on Kolmogorov-Smirnov (K-S liliefors) the index is 0,112, df (degree of fredom) 60, and the significance is 0,443. The significance index which is obtained by using Kolmogorov-Smirnov is
P ˃ 0,05, hence, Ho is accepted it means the spreading variable score
is stated normal.
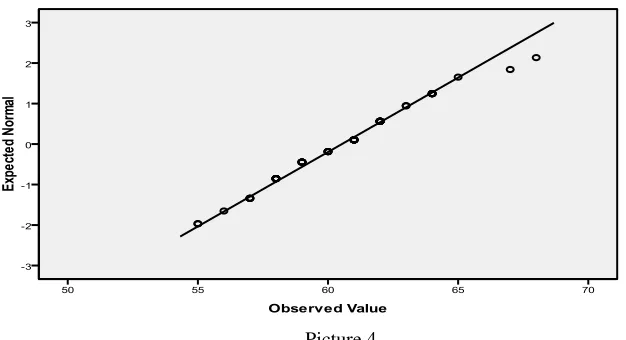
Furthermore, the normality data of student’s perception on using audiovisual media it can be seen on the picture of Q-Q Normal Plot as follows:
Picture 4
On the picture above, there is a straight line from the down left side to the up right and surrounding it there are small square signs which follow it, the scores position are spreading nearly on line, it shows that
the spreading of scores for the variable of student’s perception on
using audio visual media is normal.
Meanwhile, the normality test based on table 4.5, the variable of independent learning based on Kolmogorov-Smirnov (K-S liliefors) its index is 0,100, df (degree of fredom) 60, and the significance is 0,582. Moreover, the significance which is obtained from Kolmogorov-Smirnov is P ˃ 0,05, Ho is accepted and the spreading of variable score is stated normal.
Furthermore, the data normality of independent learning can be seen on the picture of Q-Q Normal Plot in the following:
Picture 5
Normal Q-Q Plot of Independent Learning
According to the picture above, it can be seen that the straight line from the down left line to the up right line and the surrounding it there are small square signs which follow it. The line is from z- score, on the other side, the small square signs show the point of the scores. The positions of the scores are nearly on the line which shows the spreading score for the variable involves is normal.
Meanwhile, the normality test of variable of student’s reading skill
based on the table the calculation of Kolmogorov-Smirnov (K-S liliefors) the index is 0,130, df (degree of freedom) 60, and the significance is 0,263. Because the significance index which is obtained by Kolmogorov-Smirnov P ˃ 0,05, hence, Ho is accepted and it means the score spreading of variable of independent learning is stated normal.
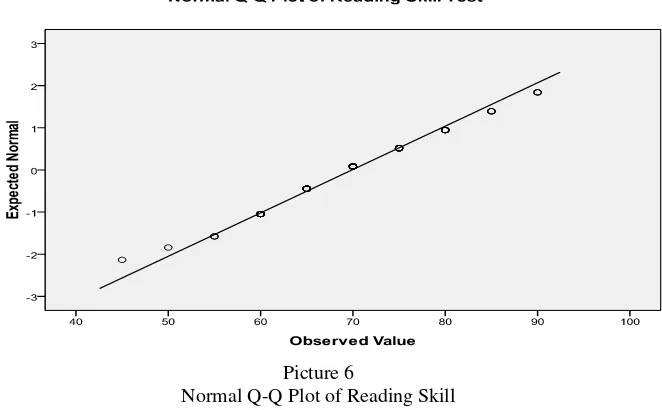
The normality condition of student’s reading skill can be seen on the
Picture 6
Normal Q-Q Plot of Reading Skill
From the table above, it can be seen that the scores position are located
on nearly line, it means that the spreading score of variable of student’s
reading skill is normal.
b. The Data Linearity Test
Linearity test is an assumption in the regression analysis. It means that the regression line between X and Y both are forming a linear line or not. On the other word, if the line is not shaping linier line, the regression analysis can not be continued.
The linearity test of the regression line can be used by calculating F (significance probability level) then determining null hypotheses (Ho).
If F (Sig=…) is lower than P (0,05), as a result, the regression line of related data is linier. On the other hand, if F (Sig=…) is higher than P
(0, 05), the regression line is not linier. Hence, the consequence is the data should be analyzed by non- linier regression (Nurgiantoro dkk, 2009: 329)
1) The Linearity on Regression Line of the Effect of Student’s
Perception on Using Audio Visual Media towards student’s
Reading Skill
The relationship between variables of student’s perception on using
audio media towards student’s reading skill can be seen on the
Table 6
The Linearity Test of Student’s Perception on Using Audio Media towards Student’s Reading Skill
Deviation from Linearity 947.865 11 86.170 1.960 .055
Within Groups 2066.468 47 43.967
Total 5574.583 59
Source: The primer data is processed by using SPSS version 17
The result of ANOVA test, on this section is preceded the obtained result of probability level is Sig = 0,055. Moreover, the probability score is (0,055) and it is higher than 0,05 hence, the regression
model can be used for predicting the effect of student’s perception on using audio media towards the ability of student’s reading skill
out of three schools (SMA 88, 99, and 51 Jakarta). Meaning, the
effect of regression line of student’s perception on using audio visual media towards student’s reading skill is linear.
2) The Linearity on Regression Line of the Effect of Independent Learning towards Reading Skill
The presenting of the table below gives information of the result calculation variance analysis, anova relationship between variable of independent learning towards reading skill by using SPSS program version 17.00.
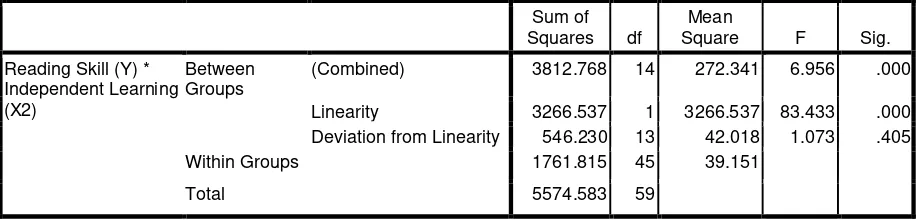
Table 7
The Linearity Test of Independent Learning towards Student’s Reading Skill
ANOVA Table
Deviation from Linearity 546.230 13 42.018 1.073 .405
Within Groups 1761.815 45 39.151
Total 5574.583 59
The result of ANOVA test, on this part is presented the obtained probability level is Sig = 0,405. Moreover, the probability score is (0,405) higher than 0,05 therefore, the regression line of data score involves is stated linier. It means the regression model can be used to predict the effect of independent learning towards the ability of
student’s reading skill out of three schools which are observed.
3. Test of Hypothesis
The data which are collected by the researcher is kind of interval and ratio data. Moreover, the correlation analysis technique that is used is Pearson Product moment Correlation (r). The result of calculation using SPSS 17, it can be seen as follows:
Table 8
The Result of Correlation Coefficient Calculation of The Effects of Student’s Perception on Using Audio Visual Media and Independent Learning towards Student’s Reading Skill
Model Summary
a. Predictors: (Constant), Independent Learning (X2), Perception on Using Audio Visual Media (X1)
Table 9
The Recapitulation of the Result of Regression Coefficient Tested Calculation of The Effects
of Student’s Perception on Using Audio Visual Media and Independent Learning towards Student’s Reading Skill
a. Predictors: (Constant), Independent Learning (X2), Perception on Using Audio Visual Media (X1)
b. Dependent Variable: Reading Skill (Y)
Table 10
The Recapitulation of the Result of Regression Similarity Line Calculation of
Perception on Using Audio Visual Media (X1)
1.303 .323 .365 4.032 .000
Independent Learning (X2) 1.567 .252 .563 6.219 .000
a. Dependent Variable: Reading Skill (Y)
c. 3.1. The Effects of Student’s Perception on Using Audio Visual Media
(X1) and Independent Learning (X2) towards Student’s Reading Skill
(Y)
Hypothesis 1
H0: means that there are no effects of student’s
perception on using audio visual media and independent learning toward student’s reading skill.
H1: means that there are effects of student’s
perception on using audio visual media and independent learning
toward student’s reading skill.
Based on the table model summary describes the amount of relationship between student’s perception on using audio visual media and independent learning simultaneously towards reading skill that is calculated by correlation coefficient is 0,823 or (ry12 = 0,823) it means that showing a very strong effect. On the other hand, the contribution
simultaneously of student’s perception on using audio visual media and independent learning towards student’s reading skill is R2 X 100% or0,823 x 100% = 67,8% the rest is 32,2% determined by the other factors.
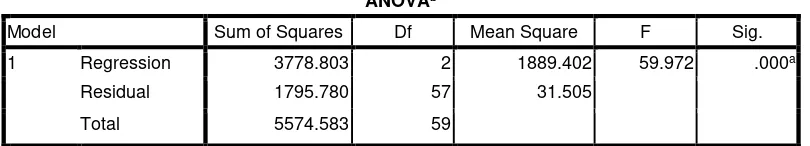
Meanwhile, for the test of hypothesis by using regression analysis is obtained the calculation result that is seemed on the table 4.9 and 4. 10, so that, it is obtained the similarity of regression line which presents
the effects of student’s perception on using audio visual media and
independent learning towards student’s reading skill, is = -103.625 + 1,303 X1 + 1,567 X2.
Meanwhile, the significance test of regression line is by attended of
calculation on the table 9 The regression significance criteria is “if sig < 0,05 means H0 is rejected” or “if Fobserved > Ftable means H0 is
rejected”, meaning that the regression coefficient is significant, on the
From the table 9 is seemed that sig = 0,000 and Fobserved is 59.972, meanwhile the Ftable = 2,77. Because the score of sig < 0, 05 (0,000<0, 05) and Fobserved > Ftable (59.972> 2.77) means H0 is rejected meaning that regression coefficient is significant. It means that there are
significant effects of student’s perception on using audio visual media
and independent learning towards student’s reading skill.
From the result of correlation test or regression, it can be concluded
that there are the effects of student’s perception on using audio visual
media and independent learning altogether towards student’s reading skill.
d. The Effect of Student’s Perception on Using Audio Visual Media (X1)
towards Student’s Reading Skill (Y)
Hypothesis 2
H0: means that there is no effect of student’s
perception on using audio visual media towards student’s reading skill.
H1: means that there is an effect of student’s
perception on using audio visual media towards student’s reading skill.
For proving the hypothesis 2 is by analyzing the calculation result of SPSS version 17 on the table 10. The determination of regression
significant criteria is “if tobserved > ttable means H0 is rejected” or “if Sig < 0,05 means H0 is rejected” it means that there is a significant effect between student’s perception on using audio visual media towards student’s reading skill. The score of tobserved is the number
which is stated on the column t on line student’s perception on using
audio visual media. Meanwhile, ttable is the score of distribution table t for the real standard 5% with the probability degree (df = n - 2) = 60
– 2 = 58 which is n is the amount of respondents.
According to table 10, is seemed the score of Sig = 0,000 and tobserved = 4.032, meanwhile ttable = 1,67. Because the score of Sig < 0,05 (0,000< 0,05) and tobserved > ttable (4.032>1.67) means H0 is
rejected meaning that there is a significant effect between student’s perception on using audio visual media towards student’s reading skill.
From the test of correlation and regression it can be concluded that
there is an effect of student’s perception on using audio visual media
towards student’s reading skill.
e. The Effect of Independent Learning (X2) towards Student’s Reading Skill (Y)
Hypothesis 3
H1: means that there is an effect of independent
learning towards student’s reading skill
To prove the hypothesis 3 by analyzing the result calculation of SPSS version 17 on the table 10, by determination of regression significance
criteria is “if tobserved > ttable means H0 is rejected” or “if Sig < 0, 05 means H0 is rejected” it means that there is a significant effect between independent learning towards student’s reading skill. The score of tobserved is the number which is applied on the column t on line independent learning. Meanwhile, ttable is the score of distribution table t for the real standard of 5% with the probability degree (df = n - 2) = rejected which means there is a significant effect between independent
learning towards student’s reading skill.
From the result of correlation test or regression it can be concluded that there is an effect of independent learning towards student’s reading skill.
4. Interpretation of the Research
a. The Effects of Student’s Perception on Using Audio Visual Media
(X1) and Independent Learning (X2) towards Student’s Reading Skill
(Y)
By knowing the result of data analysis which was taken from the respondents out of three schools namely SMA 88, 99, and 51 Jakarta Related to the result, it can be concluded that they agree if a learning process especially on English subject is provided by an audio visual media. Added by the result of the contribution of independent learning it can be implied that independent learning can give effect towards students reading skill. In other word, it can be concluded that there are
effects of student’s perception on using audio visual media and independent learning towards student’s reading skill. It is proven by
the data analysis result is R2 X 100% or 0,823 x 100% = 67,8% and the rest is 32,2% determined by the other. In addition, the sig = 0,000 and Fobserved is 59.972, meanwhile the Ftable = 2, 77. Because the score of sig < 0, 05 (0,000 <0, 05)and Fobserved > Ftable (59.972> 2.77) means H0 is rejected meaning that regression coefficient is significant. It means that
there are significant effects of student’s perception on using audio
visual media and independent learning towards student’s reading skill. From the result of correlation test or regression, it can be concluded
that there are the effects of student’s perception on using audio visual
b. The Effect of Student’s Perception on Using Audio Visual Media (X1)
towards Student’s Reading Skill (Y)
Accordingly, the calculation of data analysis it can be seen that the
contribution of variable student’s perception on using audio visual media (x1) towards student’s reading skill (y) is the score of Sig = 0,000 and tobserved = 4.032, meanwhile ttable = 1,67. Because the score of Sig < 0, 05 (0,000< 0,05) and tobserved > ttable (4.032>1.67) means H0 is
rejected meaning that there is a significant effect between student’s
perception on using audio visual media towards student’s reading skill. From the test of correlation and regression it can be concluded that
there is an effect of student’s perception on using audio visual media towards student’s reading skill.
c. The Effect of Independent Learning (X2) towards Student’s Reading Skill (Y)
The effect of independent learning towards student’s reading skill
based on this research data analysis can be interpreted that give strong effect for the respondents. It is proven by the result of the data that is the score of Sig = 0,000 and tobserved = 6,219, meanwhile, ttable = 1, 67. Because the score of Sig < 0,05or (0,000<0, 05) and tobserved > ttable (6.219>1.67) means H0 is rejected which means there is a significant
effect between independent learning towards student’s reading skill. From the result of correlation test or regression, it can be concluded that there is an effect of independent learning towards student’s reading skill.
C. CONCLUSION
By taken from the data analysis of this research there are several conclusions as follows:
1. There are the effects of student’s perception on using audio visual media (X1) and independent learning (X2) towards student’s reading skill (Y).It can be concluded by the result of data analysis that is the multiple regression which the multiple correlation coefficient is (R) is 0,823 or (ryx1x2 = 0,823) it means there are strong effects among them. The Fobserved is 59.972 with significance probability level is Sig = 0,000. Moreover, probability value is (0,000) less than 0, 05 it means the regression model
2. There is an effect of student’s perception on using audio visual media (X1)
towards student’s reading skill (Y).It can be concluded by determination of regression significance criteria is the score of Sig = 0,000 and tobserved = 4.032, meanwhile ttable = 1,67. Because the score of Sig < 0, 05 (0,000< 0,05) and tobserved > ttable (4.032>1.67) means H0 is rejected meaning that there is a significant effect between student’s perception on using audio
visual media towards student’s reading skill. From the test of correlation and regression, it can be concluded that there is an effect of student’s
perception on using audio visual media towards student’s reading skill.
3. There is an effect of independent learning (X2) towards student’s reading skill (Y).It can be concluded by the result of data analysis that is by determination of regression significance criteria is the score of Sig = 0,000 and tobserved = 6,219, meanwhile, ttable = 1,67. Because the score of Sig < 0,05or (0,000<0, 05)and tobserved > ttable (6.219>1.67) means H0 is rejected which means there is a significant effect between independent learning
towards student’s reading skill. From the result of correlation test or regression, it can be concluded that there is an effect of independent learning towards student’s reading skill.
Implication
By knowing the calculation of data analysis it can be implied of variables
student’s perception on using audio visual media (X1) and Independent Learning (X2) towards student’s reading skill as follows:
1. Student’s perception on using audio visual media gives positive information that the media of audio visual can assist the student to learn particularly on English subject specifically on student’s reading skill. It can be underlined that, the result gives effect significantly for the students or respondents in this research.
2. Independent learning based on the result of this research data analysis gives positive effect significantly towards student’ reading skill. It can be
implied that, this variable is a crucial factor on improving student’s ability
on reading skill.
Suggestion
By getting the result of data analysis of this research there are several suggestions can be preceded as follows:
1. To the Student
skill. It means that the student should build their independent learning to increase their ability particularly on English subject specifically on reading skill.
2. To the Teacher
By knowing the result of the data analysis of this research study it can be suggested to the teacher particularly English subject teacher that the audio visual media give positive effect for the student on learning reading skill. On the other word, the English subject teacher should master the audio visual media which is provided in the classroom. Therefore, the using of audio visual media can give advantages maximally for the student on learning reading skill.
3. To the School
By knowing the in formation of the result of the data analysis in this research, it is suggested to the school to provide the audio visual media for assisting the teacher particularly on English subject. On the other word, the school could also train the teacher for mastering audio visual media uses; therefore, the media can be used maximally not only for the teacher but also for the student and school.
REFERENCES
Grabe, William and Stoller, Fredricka L. 2002. Teaching and Researching Reading. London: Longman Pearson Education.
Gino dkk. 1999. Belajar dan Pembelajaran I: SI/ Semester III / 2 SKS. Surakarta: UNS Press.
Nurgiyantoro dkk. 2009. Statistika Terapan untuk Penelitian Ilmu- Ilmu Sosial. Yogyakarta: Gadjah Mada University Press.
Internet Resources:
(http://oxforddictionaries.com/definition/english/test)
(http://www.brainyquote.com/quotes/authors/n/nelson_mandela.html) (http://www.un.org/en/documents/udhr/index.shtml)
Journals: