THE CLIMATE SENSITIVE DESIGN IN HOT-HUMID URBAN DESIGN
M. Donny Koerniawan
Department of Architecture, School of Architecture Planning, and Policy Development, Institute of Technology, Bandung, Jl. Ganesha 10 Bandung
Email: [email protected]
ABSTRACT
Urban and microclimate have intense relationship that affecting each other’s. Specific urban structure can affect
microclimate because of high radiation generated. In the other side, urban structure blocks distribution of incoming wind. Urban structure changes how the microclimate influences the city. The successful urban structure can impact how outdoors open spaces are used meanwhile good open spaces are affected by how comfortable can be accepted. Microclimate control is the first element has to be considered to design comfortable outdoor open spaces. This research used monthly mean air temperature, relative humidity, precipitation, vapor pressure, and wind velocity for the period 2009–20014 to simulate any type of microclimate situation that influence thermal comfort in the urban context. Data were collected from 3 selected meteorological stations in Jakarta and websites. PET (physiological equivalent temperature) is used to assess the value of thermal comfort in outdoor spaces. This study shows that hot-humid city has abundance solar radiation, which influences the heat in the urban area that need to be released immediately meanwhile because of the urban structure reduce the wind velocity that enter into the urban area, the city does not has strong energy to release the heat. So urban structure has to be well designed to make wind can release the heat trapped in the urban area.
Keywords: Urban structure; outdoor thermal comfort; microclimate; PET.
INTRODUCTION
Research that concern in relationship of urban microclimate and urban structure in developing countries, like Indonesia, is crucial not only there are not many researchers involved but also it is an important part of urban livable development. Livable city represents how people in the city live in balance social, economy, and environmental. It should also put the people at forefront of all its planning activities and recognize its natural assets, its citizens and its environment and build environment (UNEP, 2007). Their climate, their location, and natural features have to be considered effect the city planning and design.
The studied by Aden, et al. (2013) shows that the people have more access to the nature including green space tend to be healthier, happier, and have lives longer. Several authors (Aden et al, 2013; Stewart & Oke, 2012; Oke, 1984) show the results that livable quality is affected by the outdoor spaces quality. In the tropical country, especially in hot-humid country like Indonesia, people use open space along the year (Koerniawan, 2015). So the outdoor open spaces in hot-humid city should be designed and maintained sustainability. In order to contribute to the sustaina-bility of open space, the climatic guidelines should transfer into urban thermal comfort structure planning knowledge.
Urban form determines the behavior of urban microclimate that will affect the presence of people in open spaces (Lin, 2009; Lin et al, 2012); therefore,
the report of local climate conditions in the region in relation to the proper distribution and sizing of urban obstacles is needed to improve thermal comfort in outdoor spaces. A study of Mediterranean climate in the Island of Tinos, Greece (Anden, 2013) shows that north-south orientation streets with aspect ratios between 0.5 and 1.5 can reduce extreme thermal conditions. In addition to orientation and aspect ratio, the application of climatology urban design should consider other factors depending on the location such as ventilation, the density of the buildings and the trees (Givoni, 1994; Lin et al, 2010), the materials used in facades, and the pavement type (Oke, 1984) to improve pedestrian thermal comfort.
Urban planning and design are facing one of the major problem i.e. global warming, mostly as a result of green house gas emissions, and its regional effects. At several cities, climate represents a natural resource on which the urban climate department is predicted. Planners, urban designers and architects use the information of geographical location, topography, landscape, vegetation, and fauna as factors that affect the decisions on planned areas. Weather and climate are two additional factors that interconnected in diverse ways with urban structure.
which it is located. Urban area is located especially in basin, coastal, and in river valleys, which topogra-phies are themselves subject to climate change effects. The breezes of mountain/valley and sea/land can show the urban effect by controlling circulation and the reduction of urban emission.
The general framework of this study is to answer the need of analyzing thermal comfort especially in hot-humid climate regions and its influence in urban structure design factors. The principle of this study is to conclude the most suitable microclimate situation to achieve human thermal comfort in urban develop-ment in Jakarta.
METHODOLOGY
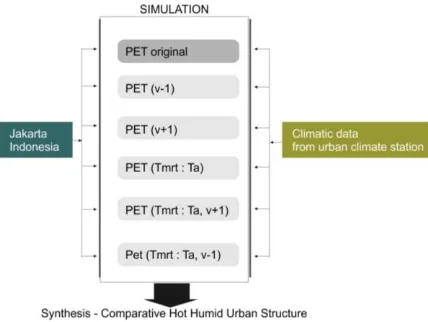
This research evaluated the background of the urban microclimate conditions in the hot-humid climate of Jakarta, based on the effects of urban structural modifications. This research used metho-dology from Rodríguez et al. (2016) that simulates the effects of shading and variation of wind speed into different urban structure. The climate data from meteorological stations are used to setup the perfor-mances of any type of urban structure, i.e.: from the original data of meteorology station (without modi-fications), wind speed reduction of -1.0 m/sec., wind speed increase of +1.0 m/sec., reduction of shade where Tmrt is equal to two, and finally combinations of shading and variation of wind speed (Rodríguez et al, 2016) see Fig. 1. Thermal comfort zone from tropical regions (Lin & Matzarakis, 2008)) are used as the criteria of assessment.
Fig. 1. Simulation Framework of Urban Structure Com-parison (modified from Rodríguez Algeciras et al, (2016))
Outdoor Thermal Comfort Indices
Höppe (1993); Jendritzky & Tinz (1999); Spag-nolo & de Dear (2003) state that there are some
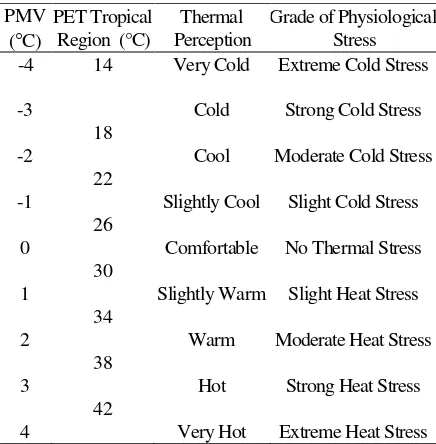
physiological thermal comfort indices. Physiological Equivalent temperature (PET) is one of them that derived from the human energy balance for any given place (indoors or outdoors). Comparable to com-monly used PMV index for thermal perception and grade of physiological stress on human beings by Fanger (1972) and Jendritzky et al (1990). PET is one common index to describe the thermal bioclimate that accepts the evaluation of thermal conditions in a physiologically important method as well.
In 1996, Matzarakis and Mayer shifted ranges of PMV (Fanger, 1972; Mayer et.al, 2008) into equiva-lent with PET ranges. They are effective only for the expected values of internal heat gain and thermal resistance of the clothing.VDI (1998), Höppe (1999) state that PET is equivalent to the air temperature in a typical indoor setting, the heat balance of the human body works at 80 W metabolism of light activity, which added to basic metabolism and with heat resistance of clothing 0.9 clo. Base on the human energy balance of the human body, PET is very well matched to the human-biometeorological evaluation of the thermal component in any different climates, therefore, it is suitable to thermal physiologically and reproducible.
Compare to others human thermal comfort indices that obtained from the human energy balance like PMV (Predicted Mean Vote), PET has advantage of a widely known unit of degree Celsius (Hoppe, 1999; Matzarakis et al, 1999). PET is more under-standable to architects or planners who may not so familiar with the human-biometeorological termino-logy (Matzarakis et al, 1999). It has eight-point scale from very cold to very hot. The scale is combining individual parameters (i.e. metabolism and clothing resistance) and environmental parameters (i.e. air temperature, humidity, wind velocity, and radiant temperature). This research used PET index that stated by Lin & Matzarakis (2008), which suitable with tropical region, see Table 1.
Data Usability
Table 1. PMV and PET Value
-1 Slightly Cool Slight Cold Stress
26
0 Comfortable No Thermal Stress
30
1 Slightly Warm Slight Heat Stress
34
Source: Lin & Matzarakis (2008)
Tools
CTIS (Climate, Tourism/Transfer-Information Scheme) from Ketterer & Matzarakis (2014) is used to represent the result of the diurnal data of PET value from original Climate stations and simulations. CTIS is made by Matzarakis & Amelung (2008), this software is operated with data files that contain frequencies of PET value. It can represent customiza-ble diagrams for all simulations performed. The result from CTIS is easy to understand and visualize (Lin & Matzarakis, 2008; Ketterer & Matzarakis, 2014). The results are 10-days period of data of PET (original and simulated result). To present more precisely informa-tion on climate condiinforma-tion, Excel software is used to draw the 10 days period of monthly time scale.
RESULTS AND DISCUSSION
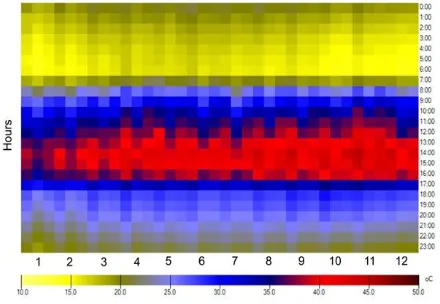
Fig. 2 represent PET value of Jakarta from original data. PET values have been calculated from 2009 to 2014 (5 years) of weather data for quan-tification of the background urban climate conditions of Jakarta. After calculated using CTIS, the result show 9.5% of time are in the slightly warm classes (PET >30°C) that happen in the nighttime from 9 pm to 5 am in Jakarta. 11% of warm condition occur at 7 am to 9 am (in the morning time), and 14% hot to very hot happen at midday (11 am to 3 pm) and 12% are comfortable (26°C < PET <30°C). However, frequencies of feeling cold to cool (PET <22°C) are about 21.8% happened in the nighttime. Therefore, Jakarta is in a warm and hot climate region during
morning to evening (9 am to 3 pm). For more detail can be seen in figure 3.
Fig. 2. PET Value of Jakarta. Data was Taken from 2009-2014 (5 years)
Table 2 shows the distribution of PET value and time, the diagram shows the thermal stress. The PET value shows the acceptable level of thermal comfort (22<PET<34oC) occurs along the years about 36.51% especially occur from May to August. Cold level of PET (< 22oC) occurs approximately from January to April. Heat stress (PET> 34oC) occurs from mid-August to November when in Indonesia is in the dry season.
Table 2. Monthly Frequency Distribution of PET
Configuration Cold Stress Comfortable Heat Stress PET < 22oC 22<PET<34oC PET> 34oC
is more shadow (PET < 22oC), higher 3% than we increase wind speed. The increasing wind speed almost does not have the effect of comfort level in the hot humid city, but decreasing the wind speed effect uncomfortable become higher 8%.
Fig. 3. Monthly of PET Value and Time Based on Original Data (2009-2014) in Jakarta
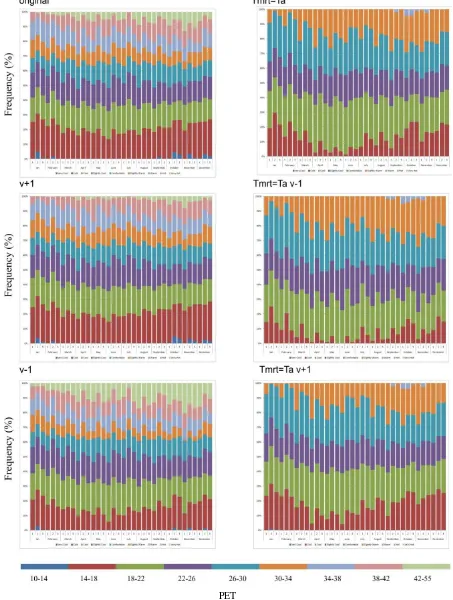
Figure 3 shows the mean monthly diurnal variation of PET. Based on the original data of PET, the performance of comfortable occurs in the morning (9 am) and evening (4 pm). During summer, September to November, the uncomfortable condition increase. In the nighttime, the cold occurs and the frequency of comfortable improved because of the absence of solar radiation. In summer, during daytime, in the shading conditions (Tmrt = Ta), PET is below 34°C meanwhile in the open space (original data) PET value reaches above 37°C. In the wet season (January-March), PET value is down to below 32°C. This result clearly shows the influence of solar radiation on thermal comfort. During summer days, the levels of thermal comfort improve because of the increasing wind speed. If the wind speed increases, the thermal comfort conditions can be more com-fortable, but if the wind speed decreases, in the daytime the PET will be above 34°C (figure 4). Furthermore, decreasing wind speed improved thermal comfort conditions in dry season/summer. The simulation results confirm that wind speed has an influence on the mitigation of unpleasant thermal conditions; however, shade condition has more influence.
°C
Based on simulation results, some aspects about thermal comfort in Jakarta should be exposed by comparing simulation of microclimate data at different configurations. In all shade situations (Tmrt=Ta), the frequency of comfort value increase. Therefore, increasing shade and wind speed can improve thermal comfort situations (PET above
30°C). Also, heat stress conditions (>35°C), can be mitigated by add shading and raise wind speed respectively. The combination of shading and wind speed enhancement is the most important strategy to reduce heat stress. Therefore, during the summer period, wind speed enhancement and shaded areas provision are recommended. In the midday of summer season shade area and wind speed enhan-cement will raise the PET frequency of comfortable. On the other hand shade area and wind speed enhancement are needed to improve comfort.
CONCLUSION
Thermal comfort can be improved by shade provision and wind speed enhancement that will decrease PET value below 22°C in summer day. The simulations result show that thermal comfort can be improved by modifications of wind speed and solar radiation. Our findings confirm those reported by a similar research by Abreu et al, (2014) and Algeciras & Matzarakis, (2015). Similar to our results, it was perceived that shading is the main factor affecting the quantitative of heat stress, followed by wind speed modifications, so the shaded pedestrian is one of the most important strategies to mitigate heat stress in the hot-humid country (Ali-Toudert & Mayer, 2007; Fröhlich & Matzarakis, 2013; Ketterer & Matzarakis, 2014). The good urban structure designs are always pay attention to climate sensitive design, using shadowing to mitigate the heat stress is the main important way that architect and urban planner have to take into account.
REFERENCES
Algeciras, Rodríguez, J.A., & Matzarakis, A. (2015). Human thermal comfort conditions and urban planning in hot-humid climates—The case of Cuba. International Journal of Biometeorology, 60(8), pp.1151–1164.
Abreu L., Labaki, L. & Matzarakis A (2014) Thermal bioclimate as a factor in urban and architectural planning in tropical climates—the case of Campinas, Brazil. Urban Ecosystem, 17, pp. 489–500. doi:10.1007/s11252- 013-0339-7 Ali-Toudert, F. & Mayer, H. (2007). Thermal comfort
in an east–west oriented street canyon in Freiburg (Germany) under hot summer condi-tions. Theoretical and Applied Climatology, 87, pp.223–237.
PET
Eliasson, I. (2000). The use of climate knowledge in urban planning. Landscape Urban Planning, 48 (1–2), pp.31–44
Fanger, P. O. (1972). Thermal comfort. McGraw-Hill, New York.
Fröhlich, D. & Matzarakis, A. (2013). Modeling of changes in thermal bioclimate: examples based on urban spaces in Freiburg, Germany. Theo-retical and Applied Climatolology, 111, pp.547-558.
Givoni, B. (1994). Building design principles for hot humid regions. Renewable Energy, Vol. 5(2), 906-916.
Höppe, P. (1993). Heat balance modelling. Experien-tia, 49, pp.741–746.
Höppe, P. (1999). The physiological equivalent tem-perature – a universal index for the biometeoro-logical assessment of the thermal environment.
International Journal Biometeorol, 43, pp.71– 75.
Jendritzky, G. & Tinz, B. (1999). Human bioclimate maps for climate impact research; Proceedings of International Conference of Biomet and International Conference on Urban Climate. ICB-ICUC '99, Sydney 1999; Geneva: WCASP; 2000. pp. 63–83. WMO/TD No. 1026.
Ketterer, C. & Matzarakis, A. (2014). Human-Bio-meteorological Assessment of Heat Stress Reduction by Replanning Measures In Stuttgart, Germany. Landscape and Urban Planning, 122, pp.78–88.
Koerniawan, M.D. (2015). Thermal Comfort Inves-tigation in Three Hot-Humid Climate Theme Parks in Jakarta. American Journal of Environ-mental Sciences, 11(3), pp.133–144.
Lin, T.P. & Matzarakis, A. (2008). Tourism climate and thermal comfort in Sun Moon Lake, Tai-wan. International Journal of Biometeorology, 52(4), pp.281–290.
Mayer, H., Holst, J., Dostal, P., Imbery, F. & Schind-ler, D. (2008). Human thermal comfort in
summer within an urban street canyon in Central Europe. Meteorol Z., 17, pp.241–50.
Matzarakis, A. & Amelung, B. (2008). Physiological Equivalent Temperature as Indicator for Impacts of Climate Change on Thermal Comfort of Humans. Media, 30, pp.161–172.
Matzarakis, A., Mayer, H. & Iziomon, M. (1999). Heat stress in Greece. Applications of a univer-sal thermal index: physiological equivalent temperature. International Journal Biometeorol, 43, pp.76–84.
Matzarakis, A. & Mayer, H., (1996). Another kind of environmental stress: Thermal stress. WHO collaborating centre for Air Quality Manage-ment and Air pollution Control. NEWS LETTERS, 18, pp.7–10.
Oke, T.R. (1984). Towards a prescription for the greater use of climatic principles in settlement planning. Energy and Buildings, 7(1), pp.1–10. Rodríguez, A. J.A. et al., (2016). Human thermal
comfort conditions and urban planning in hot-humid climates—The case of Cuba. Internatio-nal JourInternatio-nal of Biometeorology, 60(8), pp.1151– 1164.
Spagnolo, J. & de Dear, R. (2003). A field study of thermal comfort in outdoor and semi-outdoor environments in subtropical Sydney Australia.
Build Environment, 38, pp.721–738.
Stewart, I.D. & Oke, T.R., (2012). Local climate zones for urban temperature studies. Bulletin of the American Meteorological Society, 93(12), pp.1879–1900.
UNEP, (2007). Liveable Cities the Benefits of Urban Environmental Planning I., Washington DC: The Cities Alliance.