Tabel 1. Persentase mortalitas S. litura 1 HSA
Perlakuan
Persentase mortalitas S. litura 1 Hsa (%)
Total Rata-Rata
Tests of Between-Subjects Effects
Dependent Variable: hasil Source Type III Sum
of Squares
Tabel 2. Persentase mortalitas S. litura 2 HSA
Perlakuan
Persentase mortalitas S. litura 2Hsa (%)
Total Rata-Rata
Tests of Between-Subjects Effects
Dependent Variable: hasil Source Type III Sum
of Squares
Tabel 3. Persentase mortalitas S. litura 3 HSA
Perlakuan
Persentase mortalitas S. litura 3Hsa (%)
Total Rata-Rata
Tests of Between-Subjects Effects
Dependent Variable: hasil Source Type III Sum
of Squares
Tabel 4. Persentase mortalitas S. litura 4 HSA Perlakuan
Persentase mortalitas S. litura 4 HSA
Total Rata-Rata Ulangan
Tests of Between-Subjects Effects
Dependent Variable: HASIL Source Type III Sum of Squares
df Mean
1. MEDIA TUMBUH
Dependent Variable: HASIL
MEDIA TUMBUH Mean Std. Error 95% Confidence Interval Lower
Bound
M0
1,129E-2. WAKTU APLIKASI
Dependent Variable: HASIL WAKTU
APLIKASI
Mean Std. Error 95% Confidence Interval Lower
Bound
Upper Bound
S1 13,043 ,173 12,677 13,409
S2 12,500 ,173 12,134 12,866
3. MEDIA TUMBUH * WAKTU APLIKASI
Dependent Variable: HASIL
Means for groups in homogeneous subsets are displayed. Based on observed means.
The error term is Mean Square(Error) = ,358. a. Uses Harmonic Mean Sample Size = 6,000. b. Alpha = ,05.
Tabel 5. Persentase mortalitas S. litura 5 HSA Perlakuan
Persentase mortalitas S. litura 5 HSA
Total Rata-Rata Ulangan
Tests of Between-Subjects Effects
Dependent Variable: hasil Source Type III Sum
of Squares
df Mean
Intercept 20097,094 1 20097,094 2781668,83 9
a. R Squared = 1,000 (Adjusted R Squared = 1,000)
1. media tumbuh
media tumbuh
Mean Std. Error 95% Confidence Interval Lower Bound Upper Bound
M0 3,189 ,035 3,116 3,263
M1 2,200 ,035 2,127 2,274
M2 50,185 ,035 50,111 50,259
M3 60,176 ,035 60,102 60,249
2. waktu aplikasi
Dependent Variable: hasil waktu
aplikasi
Mean Std. Error 95% Confidence Interval Lower Bound Upper Bound
S1 28,925 ,025 28,873 28,977
S2 28,950 ,025 28,898 29,002
3. media tumbuh * waktu aplikasi
Dependent Variable: hasil
95% Confidence Interval Lower
Bound
Upper Bound
Means for groups in homogeneous subsets are displayed. Based on observed means.
The error term is Mean Square(Error) = ,007. a. Uses Harmonic Mean Sample Size = 6,000. b. Alpha = ,05.
Tabel 6. Persentase mortalitas S. litura 6 HSA
Perlakuan
Persentase mortalitas S. litura 6 HSA
Total Rata-Rata Ulangan
Total 543,750 542,910 543,020 1629,680 543,227 Rata-rata 67,969 67,864 67,878 203,710 67,903
Tests of Between-Subjects Effects
Dependent Variable: HASIL Source Type III Sum of Squares
df Mean
Intercept 110660,704 1 110660,704 2152582,99 8
a. R Squared = 1,000 (Adjusted R Squared = 1,000)
Dependent Variable: HASIL MEDIA
TUMBUH
Mean Std. Error 95% Confidence Interval Lower Bound Upper Bound
M0 50,627 ,093 50,430 50,823
M1 50,145 ,093 49,949 50,341
M2 80,635 ,093 80,439 80,831
M3 90,207 ,093 90,010 90,403
2. WAKTU APLIKASI
Dependent Variable: HASIL WAKTU
APLIKASI
Mean Std. Error
95% Confidence Interval Lower Bound Upper Bound
S1 67,861 ,065 67,722 68,000
S2 67,946 ,065 67,807 68,085
3. MEDIA TUMBUH * WAKTU APLIKASI
Dependent Variable: HASIL
Means for groups in homogeneous subsets are displayed. Based on observed means.
The error term is Mean Square(Error) = ,051. a. Uses Harmonic Mean Sample Size = 6,000. b. Alpha = ,05.
Tabel 7. Persentase mortalitas S. litura 7HAS
Perlakuan
Persentase mortalitas S. litura 7 HSA
Total Rata-Rata Ulangan Total 702,930 709,210 710,220 2122,360 707,453 Rata-rata 87,866 88,651 88,778 265,295 88,432
Tests of Between-Subjects Effects
Dependent Variable: HASIL Source Type III Sum of Squares
df Mean
Intercept 187683,832 1 187683,832 55307,404 ,000
M 1384,093 3 461,364 135,957 ,000
1. MEDIA TUMBUH
MEDIA TUMBUH
Mean Std. Error 95% Confidence Interval Lower Bound Upper Bound
M0 80,333 ,752 78,739 81,928
M1 83,143 ,752 81,549 84,738
M2 90,250 ,752 88,656 91,844
M3 100,000 ,752 98,406 101,594
2. WAKTU APLIKASI
Dependent Variable: HASIL WAKTU
APLIKASI
Mean Std. Error 95% Confidence Interval Lower Bound Upper Bound
S1 89,203 ,532 88,075 90,330
S2 87,661 ,532 86,534 88,788
3. MEDIA TUMBUH * WAKTU APLIKASI
Dependent Variable: HASIL
Means for groups in homogeneous subsets are displayed. Based on observed means.
The error term is Mean Square(Error) = 3,393. a. Uses Harmonic Mean Sample Size = 6,000. b. Alpha = ,05.
Tabel 8. Preverensi Beauveria basiana Terhadap Medium /10g medium aplikasi
Perlakuan
Preverensi Beauveria basiana Terhadap Medium /10g
medium aplikasi Total Rata-Rata Ulangan
3 18104355,86 1
4376,645 ,000 Within Groups 33092,667 8 4136,583
Total 54346160,25
0
Tabel 9. Keparah serangan S. litura pada tanaman tembakau 7 Hsa (%)
Perlakuan
Keparah serangan S. litura pada tanaman tembakau 7 Hsa (%)
Total Rata-Rata
Tests of Between-Subjects Effects
Dependent Variable: HASIL Source Type III Sum of Squares
df Mean
Intercept 11238,950 1 11238,950 22426,320 ,000
M 3222,404 3 1074,135 2143,340 ,000
Dependent Variable: HASIL JENIS
MEDIUM
Mean Std. Error 95% Confidence Interval Lower Bound Upper Bound
M0 40,635 ,289 40,022 41,248
M1 14,835 ,289 14,222 15,448
M2 20,820 ,289 20,207 21,433
M3 10,270 ,289 9,657 10,883
2. WAKTU APLIKASI
Dependent Variable: HASIL WAKTU
APLIKASI
Mean Std. Error 95% Confidence Interval Lower Bound Upper Bound
S1 21,394 ,204 20,961 21,827
S2 21,886 ,204 21,453 22,319
3. JENIS MEDIUM * WAKTU APLIKASI
Dependent Variable: HASIL
95% Confidence Interval Lower
Means for groups in homogeneous subsets are displayed. Based on observed means.
a. Uses Harmonic Mean Sample Size = 6,000. b. Alpha = ,05.
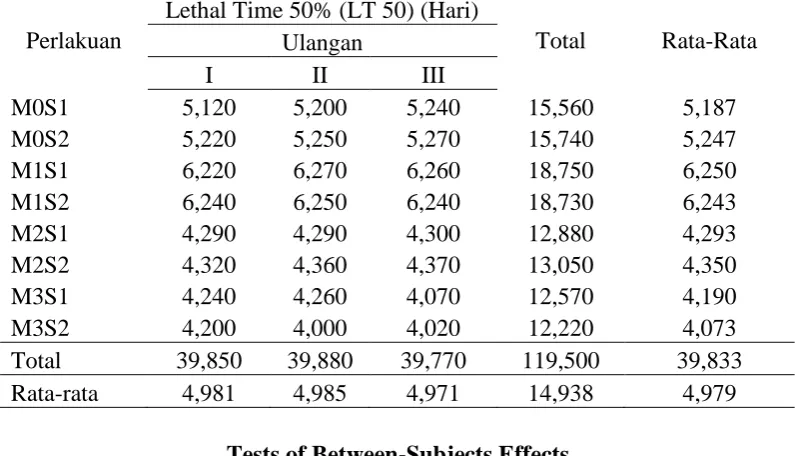
Tabel 10. Lethal Time 50% (LT 50) (Hari)
Perlakuan
Lethal Time 50% (LT 50) (Hari)
Total Rata-Rata Ulangan
Tests of Between-Subjects Effects
Dependent Variable: HASIL Source Type III Sum of Squares
df Mean
Intercept 595,010 1 595,010 164898,96
Dependent Variable: HASIL JENIS
MEDIUM
Mean Std. Error 95% Confidence Interval Lower Bound Upper Bound
M0 5,217 ,025 5,165 5,269
M1 6,247 ,025 6,195 6,299
M2 4,322 ,025 4,270 4,374
M3 4,132 ,025 4,080 4,184
2. WAKTU APLIKASI
Dependent Variable: HASIL WAKTU
APLIKASI
Mean Std. Error 95% Confidence Interval Lower Bound Upper Bound
S1 4,980 ,017 4,943 5,017
S2 4,978 ,017 4,942 5,015
3. JENIS MEDIUM * WAKTU APLIKASI
Dependent Variable: HASIL
Means for groups in homogeneous subsets are displayed. Based on observed means.
The error term is Mean Square(Error) = ,004. a. Uses Harmonic Mean Sample Size = 6,000. b. Alpha = ,05.
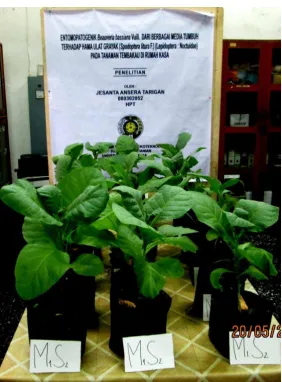
Gambar 2. Tanaman tembakau perlakuan M1S1
Gambar 5. Tanaman tembakau perlakuan M1S2
Gambar 6. Tanaman tembakau perlakuan M0S2
Gambar 7. Tanaman tembakau perlakuan M0S1