54 CHAPTER III
RESEARCH METHOD
In this part, the researcher describe about research methodology that
use in conduction the research. It purposed to answer the problem of the study.
This chapter consist of: research design, approach, population and sample, data
collecting procedur, instruments of the study, and instrument try out.
A. Research Design
This study used quantitative design. It was quantitative design because
quantitative was the data that from of number using statistic data. According to
Donald Ary “Quantitative research a ginnery employing operational definitions to generate numeric data to answer predator mined hypothesis or questions.”90
Creswell stated that a quantitative study, consistent with the quantitative
paradigm, was an inquiry into social or human problems based testing a theory
composed of variables, in order to determine whether predictive generalization of
the theory hold true.91
Design of this research applied quasi - experiment design. Quasi-
experimental design were similar to random experimental design in that they
involve manipulation of an independent variable but differ in that subject were
not random assign to treatment groups. Because the quasi-experimental design
did not provide full control, it was extremely important that writer be aware of
the threats to both internal and external validity and considers these factors in
90 Ary Donald,et…all.
Introduction To Research In Education eight, Canada: Wadsworth (Engage Learning), 2010,p.648
91
their interpretation. Although true experiments were preferred,
quasi-experimental design were considered worthwhile because they permit writer to
reach reason able conclusions even though full control was not possible.92 Tabel 3.1
The scheme of Quasi Experimental Design
Subject Per-test Treatment Post-test
A Y1 X Y2
B Y1 - Y2
Y1—X—Y2
Where:
C : experimental group
D : control group
Y1 : Pretest
Y2 : Posttest
X : Treatment
Because both of experiment group and control group take some pre test and
post test, and the study will do at the same time.
B. Population and Sample
1. Population
Population was all cases, situation, or individuals who share one or
more characteristics.93 The population of this research was all the students of the
92
Donald Ari, Lucy Chesar Jacobs, Chris sorensen, Asghar Razavieh,
introduction to research in education, Eight Edition, 2010, p. 316 93
tenth grade student of SMA Muhammadiyah 1 Palangka Raya. The number of
population were about 105 students. It is classified into five classes.
Table 3.2
The Number at Tenth Grade Students of SMA Muhammadiyah 1 Palangka
Raya
No Classes The Number of Students
1 X-1 21
The small group that was observation called a sample. A sample was a
portion of group of a population.94 Sample was part of population.95 To take the sample, the writer used randomized. Member of sample in this technique was
units, then each unit taken the smallest of thesame unit.96 In this study, the writer took X-1 and X-2 classes. The reasons why the writer took X-1 and X-2 classes
as the sample of the research because those classes have represent the average
English achievement of the whole of population and also they have classroom
Lcd, the important fasilities that the writer need.
The writer determined the population into two groups. They were X-1
as experimental group and X-2 as control group.
94
Donald Ari, Lucy Chesar Jacobs, Chris sorensen, Asghar Razavieh, introduction to research in education, Eight Edition, 2010, p. 148.
95
Deni,Darmawan,Metode Penelitian Kuantitative, Bandung: PT. Remaja Rosdakarya, 2013,p.138.
96
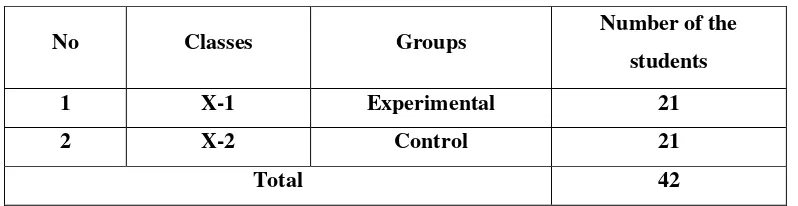
Tabel 3.3 the number of sample
No Classes Groups Number of the
students
1 X-1 Experimental 21
2 X-2 Control 21
Total 42
C. Data Collection Procedure
The procedure to collected the data consiste of some steps as follows:
1. The writer observed on Saturday, November,07, 2015 the school by
headmasters’ permission.
2. The writer asked the class with the English teacher who taught English in
the class that become the class of research:
a. The number of the class.
b. The number of the students.
3. The writer determined the class into experiment group and control group.
4. The writer gave pre test Monday, April 2th 2016, to the students consist of X-1 as the experiment class and X-2 as the control class, writer gave
writing test to the students’ in the form of Essay test consist of five items.
5. The writer taught of the treatment group using Questioning Strategy. (see
appendix 1)
Table 3.4 Procedure in Teaching Writing (meeting 1 till 4)
Teaching process using Questioning Strategy (for experimental group)
1. Pre writing activity - Prepare of picture narrative text
- The Writer explained what narrative text was
and also explain parts or generic structures.
- Introduce the questioning strategy (WH-
Question) and it used and the following
points: what, when, where, why, who, and
how.
- Choosed or had the students choose by
themselves the topic to write about.
2. Whilst writing
activity
- Gave the pictures narrative text to the
students as the instructional media for
writing stage.
- Asked the students to write their own
narrative text based on the pictures.
- The students began to write a narrative text
by answering the questions give.
- Discussed the answer with the students.
3. Post writing activity - Collecting the students’ work.
- Asked the students to infer what they
understand about the narrative text and
6. The writer teach the control group without questioning strategy.(see
appendix 1)
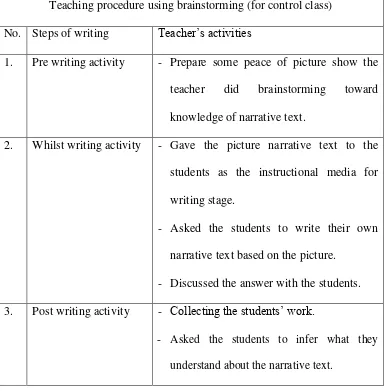
Table 3.5 Procedure in Teaching Writing (meeting 1 till 4)
Teaching procedure using brainstorming (for control class)
No. Steps of writing Teacher’s activities
1. Pre writing activity - Prepare some peace of picture show the
teacher did brainstorming toward
knowledge of narrative text.
2. Whilst writing activity - Gave the picture narrative text to the
students as the instructional media for
writing stage.
- Asked the students to write their own
narrative text based on the picture.
- Discussed the answer with the students.
3. Post writing activity - Collecting the students’ work.
- Asked the students to infer what they
understand about the narrative text.
7.The writer gave post test Monday, Mei 16th 2016, to the students consist of X-1 as the experiment class and X-2 as the control class, writer gave
writing test to the students’ in the form of Essay test consist of five items.
8. The writer gave score to the data from experiment group and control
9. The writer started to analyse the obtain data from the pre test and post
test using t-test.
10. The writer interpreted the analysis result.
11.Thewriter concluded the activity.
Questioning strategy as quasi-experimental study toward students’ writing score was the concept of this study. It was limit at tenth Grade students at
SMA Muhammadiyah 1 Palangka Raya in studying Narrative text.
The measure the score at tenth grades students of SMA
Muhammadiyah 1 Palangka Raya in writing narrative, the research would like to
used the Evaluation standard of English Subject which use by the Engish teacher
at SMA Muhammadiyah 1 Palangka Raya. The minimal completeness Standard
of English subject at SMA Muhammadiyah1 is 75. It meant that the students
pass the test if they got 75 or more. But, they got under 75, it meant they did not
pass the test.97 We can see the standard in the following table; Tabel 3.6 Evaluation Standard of English Subject
Interval Interpretation
75-100
0-74
Master
Not master
D. Instrument of the Study
The data were very important in the study. The data needed to prove
and support this study. By this collect data, the researcher could measure the
97
effectiveness of questioning strategy in prewriting technique on the students’ ability in writing narrative text at SMA Muhammadiyah 1 Palangka Raya. There
researcher used instrument in this study to get the data, namely was test.
1. Test
Brown stated a test, in plain words was a method of measuring a
person’s ability or knowledge in a gave domain.98 A test was an instrument or
procedure design to elicit performance from learners with the purpose of
measuring their attainment of specific criteria. Tests were almost always
identifiable time periods in a curriculum when learners muster all their faculty to
over peak performance, knowing that their responses are being measure and
evaluate. Test was useful devices among other procedure and tasks design to
assess students.99 Test were valuable measure instruments for educational research. A test was a set of stimuli present to an individual in order to elicit
respons on the basis of which a numerical score can be assigne.100
The test was a systematic procedure propose by the Evaluators to
compare the behavior of two or more students. In fact, the test generally consist
of a set of questions or tasks that must be answer by the students or the test was a
group of questions or tasks to which a student was to respond. The purpose of
testing was to produce a quantitative representation of the pupil trait that was
design to measure.101
98
H. Douglas Brown, Teaching by Principles an Interactive Approach to Language Pedagogy, Second Edition, p.384.
99
H. Douglas Brown, Teaching by...., p. 401- 402. 100
Donald Ari, Lucy Chesar Jacobs, Chris sorensen, Asghar Razavieh, introduction to research in education, Eight Edition, 2010, p. 201.
101
For the pre-test and post-test were 5 items. For the pre-test in
Experiment class conducted on 2 Mei 2016 and for the pre-test in control class
conducted on 2 Mei 2016. The post-test in Experimental class conducted on 16
Mei 2016 and for post-test in control class conducted on 16 Mei 2016.
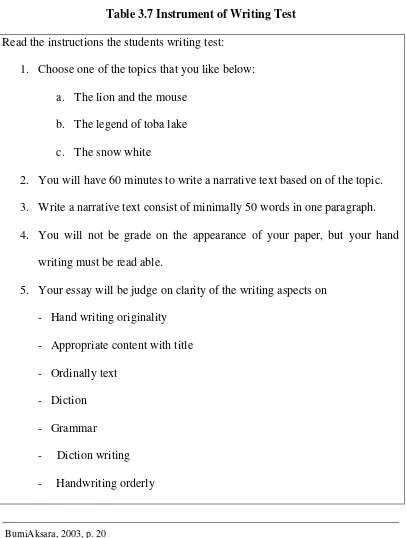
Table 3.7 Instrument of Writing Test
Read the instructions the students writing test:
1. Choose one of the topics that you like below:
a. The lion and the mouse
b. The legend of toba lake
c. The snow white
2. You will have 60 minutes to write a narrative text based on of the topic.
3. Write a narrative text consist of minimally 50 words in one paragraph.
4. You will not be grade on the appearance of your paper, but your hand
writing must be read able.
5. Your essay will be judge on clarity of the writing aspects on
- Hand writing originality
- Appropriate content with title
- Ordinally text
- Diction
- Grammar
- Diction writing
- Handwriting orderly
6. Your text should include the following points:
Validity defined as the extents to which the instrument measure what it
purposed to measure.103 Validity was the most important characteristic to consider when constructing or selecting a test or measure technique. A valid test
or measure was one which measure what it was intend to measure.104 Validity was define as the extent to which scores on a test enable one to make meaningful
and appropriate interpretations.105
Validity was the most important consideration in developing and
evaluating measure instruments. Historically, validity defined as the extent to
which aninstrument measure what it claime to measure. The focus of recent
views of validity was not on the instrument itself but on the interpretation and
meaning of the scores derive from the instrument.106
Three types of validation are important in the role as a classroom
102
Sara Cushing Weigle, Assessing Writing, series editor: J. Charles Akderson and Lyle F. Bachman, New York: Cambridge University Press, 2002, p.104.
103
Michael J.Miller, Ph.D., Reliability and Validity, Western International RES 600: Graduation Research Methods, p.3.
104
Postlethwaite,T.Neville, Educational research: some basic concepts and terminology, Hamburg University, Series Editor, 2005, p. 39.
105
Donald Ari, Lucy Chesar Jacobs, Chris sorensen, Asghar Razavieh, introduction to research in education, Eight Edition, 2010, p. 224.
106
teacher: content validity, face validity, and construct validity.107 1. Content Validity
Sudijono in Mayasyarah stated content validity of a learning result test
was the validity that was gain after doing the analyse, investigation or
examination of the content that was contain in the learning result test.108 Djiwandono in Mayasyarah stated content validity demand a content suitability
between a skill being measure and a used test to measure.109 Dornyei state content validity concern expert judgment about test content.110 In this study content validity, the writer construct the test based on what material in syllabus.
2. Face Validity
Face validity was almost always perceive in terms of content: if the test
sample the actual content of what the learner has achieve or expects to achieve,
then face validity will be perceive. Ary et al. state face validity was a term
sometime used in connection with a test’s content. Face validity refers to the extent to which examine believe the instrument was measure what it was suppose
to measure.111 The writer formulate the question test in English language to prove the content validity. The writer formulate the test adapt from MELAB instruction.
3. Construct Validity
Dornyei stated construct validity show how the test results conform to a
107
H. Douglas Brown, Teaching by Principles an Interactive Approach to Language Pedagogy (second edition),p.388.
108
Mayasyarah, The Effectiveness of Video Compact Disc as an Audiovisual Medium toward The Students’ Listening Comprehension Score of The Tenth Grade Students at MAN Model of Palangka Raya, Unpublished Thesis, p. 16.
109 Ibid 110
Zoltan Dornyei, Research Method in Applied Linguistics Quantitative, Qualitative A Mixed Methodologies, p. 51.
111
theory of which the target construct was a part.112 Djiwandono in Mayasyarah state the construct validity was to show the finding score that reflect the same
construct with the target skill of its measuring.113 The writer formulate the test item as a test of writing test. The test used to measure the write skill of the
students at the tenth grade of SMA Muhammadiyah1 Palangka Raya in Academic
year 2015/2016.
In this study, the validation of instrument was mainly direct to the
content validity. According to Sudijono in Mayasyarah, validity of learning result
test was the validity that was gain after doing the analyse, investigation or exam
of the content that was contain in the learning result test.114 Related to the writing test, the content validity was check by exam and the test use to measure the
objective. The writer was used inter-rater method (test of validity). Inter-rater was
two rater who scores the students’ writing to get the score compositions as possible.The writer use product moment correlation as the formula to calculate
the validity from the test result.115
𝒓xy = √* ( )( ) ( ) + * ( ) +
Where:
𝒓xy : Index Correlation Number “ r” product moment.
112
Zoltan Domyei, Research Method in Applied Linguistics Quantitative, Qualitative A Mixed Methodologies, p. 51.
113
Mayasyarah, The Effectiveness of Video Compact Disc as an Audiovisual Medium toward The Students ’ Listening Comprehension Score of The Tenth Grade Students at MAN Model of Palangka Raya, Unpublished Thesis, p. 17.
114
Mayasyarah, The Effectiveness of Video Compact Disc as an Audiovisual Medium toward The Students’ Listening Comprehention Score of the Tenth Grade Students at MAN Model of Palangka Raya, Unpublished Thesis, p. 16.
115
N : Number of Case.
𝚺XY : Multiplication Result between Score X and Score Y.
𝚺Y : Total Value of Score X.
𝚺Y : Total Value of Score Y.
Interpretation:
rXy > rt= Valid
rxy< rt = Invalid
According to Riduwan in Mayasyarah, he states the criteria of
interpretation the validity:116
0.800 - 1.000 = Very High Validity
0.600 - 0.799 = High Validity
0.400 - 0.599 = Fair Validity
0.200 - 0.399 = Poor Validity
0.00-0.199 = Very Poor Validity.
G. Reliability
Reliability indicate how consisten a test measure whatever it does
measure.117 The reliability of a measure instrument was the degree of consistency with which it measure whatever it was measure.118 Reliability was concern with the effect of such random error of measure on the consisten of score. But some
116
Mayasyarah, The Effectiveness of Video Compact Disc as an Audiovisual Medium toward the Students ’ Listening Comprehension Score of the Tenth Grade Students at MAN Model of Palangka Raya, Unpublished Thesis, p. 18.
117
Donald Ari, Lucy Chesar Jacobs, Chris sorensen, Asghar Razavieh, introduction to research in education, Eight Edition, 2010, p. 224.
118
error involved in measures were predictable or systematic.119
Reliability procedures were concern with determining the degree of in
consistency in score cause by random error.120 A reliable test was consistent and dependable.121 Scores reliability was the consistency of scoring by two or more The rater were the writer self, and Lydia Shanti, S.Pd teacher of English in SMA
Muhammadiyah1 Palangka Raya. The writer used analytic scoring. In analytic
scoring, scripts were rated on several aspect of writing or criteria rather than gave
a single score. Depending on the purpose of the assessment, scripts might be rate
on such feature as content, organization, cohesion, register, vocabulary, grammar,
or mechanic.124
Donald Ari, Lucy Chesar Jacobs, Chris sorensen, Asghar Razavieh, introduction to research in education, Eight Edition, 2010, p. 256.
124
H. Data Analysis Procedures
To analyze the data the researcher did some procedure below:
a. Collecting the students’ score of pretest and posttest
b. Arranging the obtained score into the distribution of frequency of score
table.
c. The calculating mean, median, standard deviation and standard error of
variable X1 from the experiment group.
d. The calculating the mean, standard deviation, and standard error of variable
X2 from the control group.
e. The calculating the standard error from the difference mean between
variable X1 and X2
f. The writer used manual calculation t-test and SPSS 18 to answer the
problem of the study with formula:
a. It calculated the standard error of the difference between X-1 and X-2
as follow:125
SEM1- SEM2 = √( ) ( )
b. Then, it inserted to the formula to get value of tobserved as follow:126
To =
Which the criteria:
If tobserved (the value) ≥ ttable, it means Ha was accepted and Ho was
rejected.
125
Triwid syafarotun Najah, p.97 126
If tobserved (the value) ≤ ttable, it means Ha was rejected and Ho was
accepted
where:
: Differentiation of Two Means.
SEm1- m2 : The Standard Error of the Difference between Two Means.
With the criteria:
SEm1- m2 : If ttest> ttable : Ha is accepted and Ho is rejected.
If ttest< ttable : Ha is rejected and Ho is accepted.
g. Interprets the result of ttest. Previously, it accounted the degrees of freedom
(df) with the formula:127 Df = ( N1 + N2- 2 )
Where:
Df: Degrees of freedom
N1: Number of subject group 1
N2: Number of subject group 2
2: Number of variable
After that, the value of ttest consulted on the ttable at the level of
significance 1% and 5%. In this study, the writer used the level of
significance at 5%. If the result or ttest was higher than ttable, it meant Ha was
accepted. But if the result of ttest was lower than ttable, it means Ho was
accepted
127
h. After calculated the data by using manual, then calculated the result ttest to
test the hypothesis of the study by using SPSS 18 program.
i.Then, interpretation was made to answer the research problem.