CHAPTER III
METHOD OF THE STUDY
This chapter consists of a type of the study, the design of the study, variables of the study, population and sample, instrumentation, data collecting procedure and data analysis procedure.
A. Type of the Study
This study will use the quantitative approach in this study. It is because the study investigated the problems on students’ writing ability. The type of this study is quasi-experimental design. Quasi-experimental designs are similar to randomized experimental designs in that they involve manipulation of an independent variable but differ in that subjects are not randomly assigned to treatment groups. Because this study does not provide full control. It is extremely important that study is aware of the threats to both internal and external validity and considers these factors in their interpretation.1
B. Design of the Study
The will use quasi-experimental design. Experimental design is a plan for an experiment that specifies what independent variables will be applied, the number of levels of each, how subject are assigned to groups, and the dependent variable. This study will be used quasi- experimental design since it is possible to randomly assign subjects to treatment group.
1
Donald Ary, et al., Introduction to Research..., p.316.
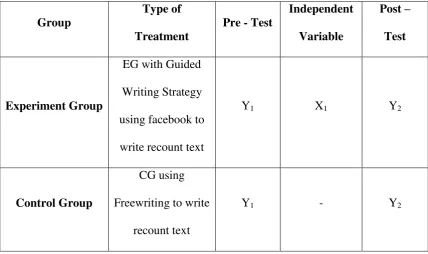
There are two groups in this study. The first group is control group (CP) using conventional method. The second is experiment group (EG) group which is use Guided Writing Strategy. The groups will have pre-test and post-test to measure the result of the students’ writing.
The description of the experiment is in the following table:
Table 3. The Description of the Experiment
Group Writing Strategy using Facebook. It is independent variable (X).
2. The second variable of the study is the result of students’ writing
scores. It is dependent variable (Y).
2
D.Population and Sample
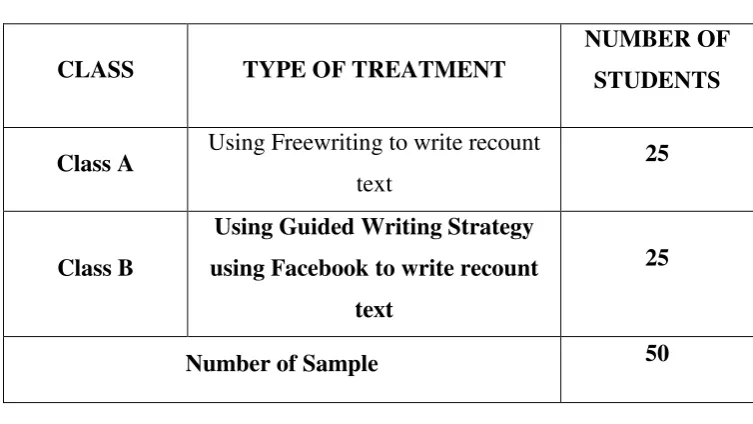
The population is all cases, situation, or individuals who share one or more characteristics. The population is the group to which a researcher would like the results of a study to be able to generalize. In this study, the populations of the study are two classes at tenth grade of Senior High School NU of Palangka Raya. The number of populations is 50 students. There are two classes, class A (25) Students and class B (25) Students. Therefore it is called by quasi-experimental design.3
Table 3.1. The description of the population and sample
CLASS TYPE OF TREATMENT
NUMBER OF
STUDENTS
Class A Using Freewriting to write recount
text
25
Class B
Using Guided Writing Strategy
using Facebook to write recount
text
25
Number of Sample 50
3
This study takes the classes as the sample for some reasons. First, the students are difficult to write. Second, the researcher wants to know the effect of guided writing using facebook on students’ writing ability.
E. Research Instrumentation
1. Test
A test is a set of stimuli presented to an individual in order to elicit responses on the basis of which a numerical score can be assigned. This score, based on a representative sample of the
individual’s behavior, is an indicator of the extent to which the subject
has the characteristic being measured.4
In the study, the method is used to get data about a score of the pre-test and post-test given to the two groups. The test in this study is writing test. In the test of writing, the students get a free chance to write as much as possible. They can freely write and organize their ideas in writing form.
a. Pre- test
This study will give pre-test to the experiment class and the control class before giving the treatment.
b. Post- test
This study will give Post-test to the experiment class and the control class after receiving treatment. It purposes is to know the improvement of students’ writing score.
4
2. Documentation
In the study, documentation will be used in order to find the information need in this research. This technique of collecting data is by seeing the documentation get the real information of the experiment like,
a. The students’ name
b. Photos of teaching learning process in the class c. The syllabus of English subject
d. The screen capture of students’ writing using facebook
e. The result of the test or Students’ writing scores
3. Test Validity and Reliability
a. Test Validity
Validity is defined as the degree to which evidence and theory support the interpretations of test scores entailed proposed uses tests.5 Validity is also defined as the extent to which an instrument measured what it claimed to measure6. Content Validity
Content validity is essentially and of necessity based on the judgment and judgment must be made separately for each situation.7 It refers to whether or not the content of the manifest variables is right to measure the latent concept that is trying to measure. In this study, the instrument tests are suitable with the condition at the class.
5
Donald Ary, Introduction to Research in Education, Eight Edition, P. 225. 6
Ibid,. 7
1. Construct Validity
Construct validity is concerned with the extent to which a test measures a specific trait or construct.8 It is related to the theoretical knowledge of the concept that wants to measure. The meaning of the test score is derived from the nature of the tasks examines are asked to perform.9
In this study, the researcher measured the students writing ability. Therefore the test instrument is made in the form of a writing test and the test is done by two testers to get the higher reliability. The score takes in five criteria, which are the score of Content, Organization, Vocabulary, Language Use dan Mechanics. Then to get the mean, the score from all criteria should be the sum.
2. Criterion-Related Validity
It refers to the extent which test scores are systematically related to one or more outcome criteria.10 It emphasizes on the criterion because the researcher will use the test scores to infer performance on the criterion. The type of criterion-related validity is used in this study is concurrent validity. It refers to the relationship between scores on a measure and criterion scores obtained at to the same time. In this study, the researcher uses two testers to do the test. So the validity of the test instrument is considered from the scores given by both testers.
b. Test Reliability
8
Ibid,.. P. 218.
9
Muhammad Adnan Latief, Tanya Jawab Metode Penlitian Pembelajaran Bahasa, Malang : Universitas Malang Press, 2010, P. 134.
10
The reliability refers to the degree of consistency measurement that a test yields in measuring what is intended to measure.11
To
score the students’ writing test as fairly and consistently as possible,
the researcher uses inter-rater reliability (test of reliability). Inter-rater reliability refers to the degree of consistency and agreement between scores assigned by two or more raters or observers who judge or grade the same performance or behavior. For example, the process of scoring essay test for subjective decisions on the part of those who have to grade the tests. To score the just like essay tests, writing test also requires subjective decisions. That is why the researcher chose this type of reliability. In this case, two raters are employed to score the students’ writing ability. The first rater is the researcher himself and the second rater is the other rater.12
In the present study, the researcher used the analytic scoring method. The scoring method can seem in the table below:
Table 2.1 Scoring Guide of Writing Test13
Component Score Level CRITERIA
Content Most relevant to the topic, but lacks detail.
11
Donald Ary, Lucy Chese Jacobs and Chris Sorensen, Introduction to Research in Education, Eight Edition, USA : Wadsworth Publishing, 2010, p. 236.
12
Ruth David, Practical Statistics for Educators, Fourth Edition, Unitid Kingdom : Rowman and Little Field Published, Inc,. 2011, P.196.
13
21-17 Fair to poor Limited knowledge of the subject. Little substance. Inadequate development of the topic.
16-13 Very poor Does not show knowledge of the subject. Non-substantive. Not pertinent. Or not enough to evaluate
Organization
20-18 Excellent to very good
Fluent expression. Ideas clearly stated/supported. Succinct.
Well-Somewhat choppy. Loosely organized but main ideas stand out. Limited support. Logical but incomplete sequencing
13-10 Fair to poor
Non-fluent. Ideas confused or disconnected. Lacks logical sequencing and development.
Does not communicate. No organization. Or not enough evaluation. word/idiom form, choice, usage. Meaning confused or obscured.
9-7 Very poor
Essentially translation. A Little knowledge of English vocabulary, idioms, word form. Or not enough evaluate.
Language Use
20-18 Excellent to very good
Effective complex constructions. Few errors of agreement, tense, number, word order/function, article, pronouns, prepositions.
17-14 Good to
average
Effective but simple constructions. Minor problems in complex construction. Several errors of agreement, tense, number, word order/function, articles, pronouns, prepositions, but meaning seldom obscured.
13-10 Fair to poor
deletions. Meaning confused or obscured.
9-7 Very poor
Virtually no mastery of sentence construction rules. Dominated by errors. Does not communicate. Or not enough to errors of spelling, punctuation, capitalization, paragraphing.
4
Good to average
Occasional errors of spelling, punctuation, capitalization, paragraphing but meaning not obscured.
3 Fair to poor
Frequent errors spelling, punctuation, canalization, paragraphing. Poor handwriting. Meaning-focused or obscured.
2 Very poor
No mastery of conventions. Dominated by errors of spelling, punctuation, capitalization, paragraphing. Handwriting illegible. Or not enough to evaluate.
The Categories Of Writing Score whether or not the distribution of research data. Therefore, the researcher uses SPSS 17.0 program to measure the normality of the data.
Homogeneity test aims to test the quality (homogeneity) score samples. The researcher used SPSS 17.0 Program to measure the homogeneity of the data.
c. Kolmogorov-Smirnov test
In statistics, the Kolmogorov–Smirnov test (K–S test or KS test) is a nonparametric test of the equality of continuous, one-dimensional probability distributions that can be used to compare a sample with a reference probability distribution (one-sample K–S test), or to compare two samples (two-sample K–S test).14 The Kolmogorov– Smirnov statistic quantifies a distance between the empirical distribution function of the sample and the cumulative distribution function of the reference distribution, or between the empirical distribution functions of two samples. The null distribution of this statistic is calculated under the null hypothesis that the samples are drawn from the same distribution (in the two-sample case) or that the sample is drawn from the reference distribution (in the one-sample case). In each case, the distributions considered under the null hypothesis are continuous distributions but are otherwise unrestricted.15
The two-sample K–S test is one of the most useful and general nonparametric methods for comparing two samples, as it is sensitive to
14
https://en.wikipedia.org/wiki/KolmogorovSmirnov_test/. (accessed on Friday, February 26th, 09.00 a.m.)
differences in both location and shape of the empirical cumulative distribution functions of the two samples.16
The Kolmogorov–Smirnov test can be modified to serve as a goodness of fit test. In the special case of testing for normality of the distribution, samples are standardized and compared with a standard normal distribution. This is equivalent to setting the mean and variance of the reference distribution equal to the sample estimates, and it is known that using these to define the specific reference distribution changes the null distribution of the test statistic: see below. Various studies have found that, even in this corrected form, the test is less powerful for testing normality than the Shapiro–Wilk test or Anderson–Darling test. However, other tests have their own disadvantages. For instance the Shapiro–Wilk test is known not to work well with many ties (many identical values).17
The empirical distribution function Fn for n iid observations Xi is defined as
where is the indicator function, equal to 1 if and equal to 0 otherwise.
The Kolmogorov–Smirnov statistic for a given cumulative distribution function F(x) is
16Ibid.
17
where sup x is the supremum of the set of distances. By the Glivenko– Cantelli theorem, if the sample comes from distribution F(x), then Dn converges to 0 almost surely in the limit when goes to infinity. Kolmogorov strengthened this result, by effectively providing the rate of this convergence (see below). Donsker's theorem provides yet a stronger result.18
In practice, the statistic requires a relatively large number of data points to properly reject the null hypothesis.
1) The Kolmogorov distribution
The Kolmogorov distribution is the distribution of the random variable
where B(t) is the Brownian bridge. The cumulative distribution function of K is given by
Both the form of the Kolmogorov–Smirnov test statistic and its asymptotic distribution under the null hypothesis were published by Andrey Kolmogorov, while a table of the distribution was published by
Nikolai Vasilyevich Smirnov. Recurrence relations for the distribution of the test statistic in finite samples are available.19
Under null hypothesis that the sample comes from the hypothesized distribution F(x),
in distribution, where B(t) is the Brownian bridge.
If F is continuous then under the null hypothesis converges to the Kolmogorov distribution, which does not depend on F. This result may also be known as the Kolmogorov theorem; see Kolmogorov's theorem for disambiguation.20
The goodness-of-fit test or the Kolmogorov–Smirnov test is constructed by using the critical values of the Kolmogorov distribution. The null hypothesis is rejected at level if
where Kα is found from
The asymptotic power of this test is 1.
2) Test with estimated parameters
19
https://en.wikipedia.org/wiki/KolmogorovSmirnov_test/. (accessed on Friday, February 26th, 09.00 a.m.)
20
If either the form or the parameters of F(x) are determined from the
data Xi the critical values determined in this way are invalid. In such
cases, Monte Carlo or other methods may be required, but tables have been prepared for some cases. Details for the required modifications to the test statistic and for the critical values for the normal distribution and the exponential distribution have been published,[5] and later publications also include the Gumbel distribution.[6] The Lilliefors test represents a special case of this for the normal distribution. The logarithm
transformation may help to overcome cases where the Kolmogorov test
data does not seem to fit the assumption that it came from the normal
distribution.21
3) Discrete null distribution
The Kolmogorov–Smirnov test must be adapted for discrete
variables. The form of the test statistic remains the same as in the
continuous case, but the calculation of its value is more subtle. We can see
this if we consider computing the test statistic between a continuous
distribution and a step function that has a discontinuity at .
In other words, the limit , if it exists, is different from .
Thus, when computing the statistic
21
it is unclear how to replace the limit unless we know the limiting value of
the underlying distribution.22
In SAS, the Kolmogorov–Smirnov test is implemented in PROC NPAR1WAY. The discretized KS test is implemented in
the ks.test() function in the dgof package of the R project for statistical computing. In Stata, the command k smirnov performs a Kolmogorov– Smirnov test.23
Illustration of the two-sample Kolmogorov–Smirnov statistic. Red
and blue lines each correspond to an empirical distribution function, and
the black arrow is the two-sample KS statistic.24
The Kolmogorov–Smirnov test may also be used to test whether
two underlying one-dimensional probability distributions differ. In this
case, the Kolmogorov–Smirnov statistic is
where and are the empirical distribution functions of the first and the second sample respectively, and is the supremum function. The null hypothesis is rejected at level if
22
Ibid,..
23
https://en.wikipedia.org/wiki/KolmogorovSmirnov_test/. (accessed on Friday, February 26th, 09.00 a.m.)
The value of is given in the table below for each level of
0.10 0.05 0.025 0.01 0.005 0.001
1.22 1.36 1.48 1.63 1.73 1.95
Note that the two-sample test checks whether the two data samples come
from the same distribution. This does not specify what that common
distribution is (e.g. whether it's normal or not normal). Again, tables of critical
values have been published. These critical values have one thing in common
with the Anderson–Darling and Chi-squares, namely the fact that higher values
tend to be rarer.25
4. Data Collecting Procedures
To answer the study questions of the effect of using guided writing strategy to write recount text on writing score, this study conducts the following steps:
1. Grouping the students into experimental group and control group. 2. Giving pre-test to the experimental group and control group.
25
3. Teaching about recount text to students in the experimental group by using guided writing strategy using facebook and teach recount text to students in the control group by Freewriting.
4. Giving pos-test to the experimental group and control group. 5. Taking the result of the test.
5. Data Analysis Procedures
The data analysis procedures of this study, they are as follows:
1. Collecting the students’ writing scores of Pre-test and post- test.
2. Arranging the obtained score into the distribution of frequency of score table.
3. Calculating mean, median, modes, standard deviation and standard error of students’ score.
4. Measuring the normality, homogeneity, and linearity.
5. Analyzing the data by using T-Test to answer the problem of the study. In addition, the SPPS program is applied.
6. Interpreting the result of analyzing data.
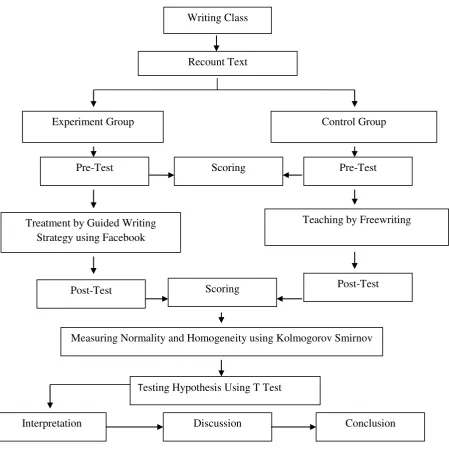
Figure 1. Steps of Collecting, Data Analysis Procedure, and Testing Hypothesis
Writing Class
Recount Text
Experiment Group Control Group
Pre-Test Scoring Pre-Test
Treatment by Guided Writing Strategy using Facebook
Teaching by Freewriting
Post-Test
Post-Test Scoring
Interpretation
Testing Hypothesis Using T Test
Measuring Normality and Homogeneity using Kolmogorov Smirnov