CHAPTER III
RESEARCH METHODOLOGY
This chapter discusses research type, research design, variable of study, population and sample, research instrument, data collecting procedure and data analysis procedures.
A. Research Type
Considering the purposes of the research and the nature of the problems, the type of the research is quantitative research that uses cluster sampling. The research took two classes as experiment class and control class. Experiment class was sample class given treatment using self-questioning strategy. In the other hand, control class was compared class that the teaching learning process did not use self-questioning strategy.
B. Research Design
This study was quantitative research and used Quasi-experimental design. Quasi-experimental design was not based on random assignment of subjects to experimental and control groups. However, they attempted to compensate for this short-coming through the careful scheduling of observation and treatments in such a way as to climate many of the threats to internal validity.1
There were two classes in this study. The first group was control class (C) teaching conventionally. The second was experiment group (E) group which was applied self-questioning strategy. The groups were given pre-test and
1
Wido H. Toendan, Educational Research Method an Instroduction, Palangka Raya: University of Palangka Raya, 2006, p.215
test to measure the result of students’ reading score. The scheme of this model is:
Table 3.1 The Scheme of Quasi-Experimental Design
Group Pre-Test Treatment Post-Test
E Y1 X Y2
C Y1 - Y2
E : Experimental Group C : Control Group X : Treatment Y1 : Pre-Test Y2 : Post-Test
The writer classified the students into two groups, Experiment and Control group. The writer taught the students directly for six times. Self-questioning strategy was only used to teach the experimental group. The material for both groups was similar.
C. Variables of the Study
independent variable, and the second is called a dependent variable.2 The present study include the following variables:
1. Independent variable: Self-questioning as a strategy using in teaching of reading comprehension subject (X).
2. Dependent variable : Students’ reading comprehension score (Y).
D. Population and Sample
1. Population
Population is all subjects of a research. Population refers the entire group of
people, events, or things of interest that the writer wishes to investigate. Based on
these two theories, it can be concluded that population is all subjects or individuals
with certain characteristics that will be analyzed.
The population of this study was all of the third semester students of English Department, STAIN Palangka Raya in the academic year of 2014/2015. The Number of population were about 73 students.
2. Sample
Sample is a subset of individuals or case from within a population.3 Based on the population which is grouped into classes, the sample of this study was class or cluster. In this case, there were two samples based on purposive technique. The sample was class A as experimenat class, class C as control class.
The description of the population and sample as follow:
2
David Nunan, Research Methods in Language Learning, New York: Cambridge University Press, 1992, p. 232-233.
3
Table 3.2. The Description of the Population and Sample
CLASS NUMBER OF
STUDENTS
TYPE OF TREATMENT
Class A 26 Self-Questioning Strategy
Class C 27 Conventionally
E. Research Instrument
The data were very important in the study. The data needed to prove and support this study. By this collected data, the writer measured the effectiveness of self-questioning strategy on the students’ reading ability at STAIN Palangka Raya. The instrument that used in the study to get the data was test.
1. Test
According to Heaton "Test may be constructed primarily as devices to reinforce learning and to motivate student, or primarily as a means of as seeing the student's performance the language.”4
The major data in this study was the data of the students’ reading comprehension score took from pre-test and post-test. Pre-test gave to find out the students’ reading ability before the treatment given, while post-test gave to find out the students’ reading ability after the treatment given.
The test constructed in multiple choice form which consisted of 60 items, 30 items for pre-test and 30 items for post-test. The test items were adapted from A Quick and Effective Strategy to Prepare the TOEFL Test by: Slamet Riyanto, Leila NH and Emilia NH. Publisher: Pustaka Pelajar. 2008. Yogyakarta: Indonesia. The test item showed in appendix 4 and 5.
4
The reason why the test item was constructing in multiple choice form was because multiple choice is objective test. Objective test are frequently criticised on the grounds that they are simpler to answer than subjective examinations. Item in an objective test, however, can be made just as easy or as difficult as the test constructor wishes. Beside of having the strength, a test in form of multiple choice aslo has a weakness. Multiple choice test type encourages guessing. It can be solved by doing try out of the test items to find out the test validity and reliability.5
Because this test used 30 item test in the form of multiple choice, the writer gave score to the students’ test result by using the formula:
Score = X100%
Where:
B : Frequency of the correct answers N : Number of test items
In connection with the score of students’ test, the writer used scoring rubric as seen in table 3.3 as follows:
Table 3.3
Scoring Rubric for Students’ Reading Comprehension6
Rubric Score Grade Category
80-100 A+ Excellent
65-70 A Excellent
55-60 B+ Good
5Ibid,
p.12
6
Rubric Score Grade Category
45-50 B Good
35-40 C+ Fair
25-30 C Fair
15-20 U Unsatisfactory
5-10 U Unsatisfactory
0 U Unsatisfactory
The performance of the test items was obvious importance as compiling future tests. Since a great deal of time and effort are usually spent on the construction of good objective items, in this case is multiple choice items, most teachers and test constructors will be desirous of either using them again without further changes or else adapting them future use. It is thus useful to identify these items which were answered correctly by the more able students taking the test and badly by the less able students. The identification of certain difficult items in the test, together with a knowledge of the performance of the individual distractors in multiple choice items, can prove just as valuable in its implications for teaching for testing.7
Each item of multiple choice in this research analyzed from the point of view of (1) item difficulty, (2) item descrimination and (3) destractor analysis.
a. Item Difficulty
The index of difficulty (or the facility value) of an item simply shows how easy or difficult the particular item proved in the test. The index of dificulty (F.V) was generally expressed as the fraction (or
7
percentage) of the students who answered the item correctly. It was calculated by using the formula8:
Where:
F.V = Item difficulty (facility value) R = the number of correct answer
N = the number of students taking the test
Then the result of the formula above was related to the value of F.V as in the following classification:9
F.V 0.00-0.30 = Difficult F.V 0.30-0.70 = Fair F.V 0.70-1.00 = Easy
b. Item Discrimination
The discrimination index of an item indicated the extent to which the item discriminates between the testees, separating the more able testees from the less able. The index of discrimination (D) tells us whether those students who performed well on the whole test tended to do well or badly on each item in the test. It is pre-supposed that the total score on the test is a valid measure of the student’s ability. (I.e. the good student tends to
do well on the test as a whole and the poor students badly). On this basis,
8
Soenardi Djiwandono, Tes Bahasa Pegangan bagi Pengajar Bahasa, Jakarta: PT. Indeks, 2008, p. 219.
9
Suharsimi Arikunto, Dasar-Dasar Evaluasi Pendidikan, Jakarta: Bumi Aksara, p. 210.
the score on the whole test is accepted as the criterion measure, and it thus becomes possible to separate the “good” students (H (high group)) from the “bad” ones (L (low group)) in performances on individual item.
If the “good” students tend to do well on an item (as shown by many of
them doing so – a frequency measure) and the “poor” students badly on the same item, then the item is a good one because it distinguishes the “good” from the “bad” in the same way as the total test score. This is the
argument underlying the index of discrimination.10
To analyze the item discrimination of test item, the writer used the following formula11:
Where:
D = item discrimination
RH = higher group who choose right answer RL = lower group who choose wrong answer
= a half amount of both groups
According to Djiwandono, the result of that analysis described by use the following table:
10
J. B. Heaton, Ibid, p. 173-174
11
Table 3.4 Item Discrimination Level12
Item Discrimination Level Test Item Categories
0,40 or more Very good
0,30 – 0,39 Good enough but need repair
0,20 – 0,29 Not really good, need repair
0,19 or less Bad, need revise or delete
c. Destructor Analysis
Each destructor, or incorrect option, should be reasonably attractive and plausible. It should appear right to any testee who is unsure of the correct option. Items should be constructed in such a way that students obtain the correct option by direct selection rather than by the elimination of obviously incorrect options.13
For most purposes, each destructor should be grammatically correct when it stands by itself: otherwise testees will be exposed to incorrect forms.14
Unless a destructor is attractive to the student who is not sure of the correct answer, its conclusion in a test item is superfluous. Plausible destructors are best based on (a) mistakes in the students’ own written
work, (b) their answers in previous test, (c) the teacher’s experience, and
(d) a constructive analysis between the native and target language.
12
Soenardi Djiwandono, Ibid, p. 224 adapted from Robert L. Ebel, Essentials of Educational Measurement, New Jersey: Prentice-Hall Inc.,1979, p.267
13
J. B. Heaton, Ibid, p.19
Destructors should not be too difficult nor demand a higher proficiency in the language than the correct option. If they are too difficult, they will succeed only in distracting the good students, who will be led into considering the correct option too easy (and a trap).15
2. Research Instruments Try Out
The writer obtained the instrument quality consists of instrument validity, instrument reliability, and index of difficulty. The procedures of the tried out were:
a. The writer tried out the test item on Thursday, September 11th, 2014, to the students who determine be students’ tried out (5th semester English students of STAIN Palangka Raya, B Class). The test item consisted of 100 questions.
b. The writer collected the answer and gave the score to the respondents. c. The writer analyzed the respondents’ score to find out instrument
validity, reliability, index of difficulty, item discrimination, and destructor analysis.
To measure the validity of the instrument, the writer used the formulation of Product Moment by Pearson as follows.16
rxy = ___ N∑XY-(∑X)( ∑Y)_______
√
15Ibid., 16
Where:
rxy : Total coefficient of correlation ∑X : Total Value of Score X
∑Y : Total Value of Score Y
∑XY : Multiplication Result between Score X and Y N : Number of students.
Interpretation :
The criteria of interpretation the validity:17 0.800 – 1.000 = very high validity
0.600 – 0.799 = high validity 0.400 – 0.599 = fair validity 0.200 – 0.399 = poor validity 0.0 – 0.199 = very poor validity
Based on the explanation above, in making the test the writer tried to match each of the items test with the curriculum that is used by STAIN Palangka Raya. The purpose was to make the test appropriate with the lesson that the students accepted in the moment when the research done. All of the result analysis showed in the appendix 4 to 8.
17 Ibid,.
3. Instrument Reliability of the Study
Reliability is a necessary of any good test: for to be valid at all, a test must first be reliable as a measuring instrument. If the test is administered to the same candidates on different occasion (with no language practice work taking place between these occasion). Then, to extent that it produces differing result, it is not reliable.18
To determine the instrument reliability of the objective form, the writer used single test single trial method. It only needed a group subject, a kind of instrument test and a test.
The formula of instrument reliability is,19
r11 = Vt = the standard deviation of all the testers’ score The steps in determining the reliability of the test were:
a. Made tabulated of tests scores.
b. Measured the mean of the testees’s scores with the formula : M= N
Y
c. Measured the total variants with the formula:
18
Donald Ary, Lucy Cheser Jacobs, Chir Sorense, Asghar Razavich, Introduction to Research in Education, 8th ED., USA: Wadsworth Cengange Learning, 2010, p.148
19
Vt=
N N
Y
Y
)
22 ( )
Where:
Vt = the total variants ∑Y = the total of score
∑Y2
= the square of score total
N = the number of testes
d. Calculated the instrument reliability using KR-21.
e. The last decision was compared the value of 11 and t
f. To know the level of reliability of instrument, the value of 11 was interpreted based on the qualification of reliability as follows:
0.800- 1.000: Very High Reliability 0.600-0.799 : High Reliability 0.400-0.599 : Fair Reliability 0.200-0.399 : Poor Reliability
11 > r
table = Reliable
11 <
0.000-0.199 : Very Poor Reliability
From the measurement of instrument try out reliability know that the numbers of test items were reliable or not.
4. Instrument Validity of the Study
The validity of a test is extent to which it measure what is suppose to measure and nothing else.20 An instrument was considered to be a good one if it meet some requirement. One of them was validity.
Every test, whether it was a short, informal classroom test or a public examination, should be a valid a constructor could make it. The test must aim to provided a true measure of a particular skill which it was intend to measure, to the extent that was measure external knowledge and other skills at the same time, and it would not be a valid test. Validity on this study was distinguished into some kinds as followed:
a. Face Validity
Face validity is an estimate of whether a test appears to measure a certain criterion; it would not guarantee that the test actually measures phenomena in that domain. The test intended to measure the students’ reading scores in the third semester: it covered material in the third semester.
b. Construct Validity
This type of validity assumes the existence of certain learning theories or constructed underlying the acquisition of abilities and skills. If a test has construct validity, it was capable of measuring certain specific characteristic in
20
accordance with a theory of language behavior and learning. Construct validity adequately the test content samples larger domain of situations at presents. In the other words a test supposed to be valid in terms of its content when it is developing as to contain adequately representative sample of the course, the objective, and the items. The writer used multiple choice items.
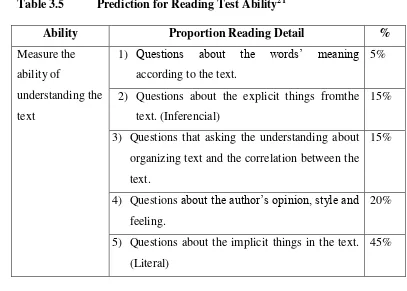
The writer used the following table to show the evidence of the validity: Table 3.5 Prediction for Reading Test Ability21
Ability Proportion Reading Detail %
Measure the
2) Questions about the explicit things fromthe text. (Inferencial)
15%
3) Questions that asking the understanding about organizing text and the correlation between the text.
15%
4) Questions about the author’s opinion, style and feeling.
20%
5) Questions about the implicit things in the text. (Literal)
45%
21
F. Data Collecting Procedure
To get the data is needed in this research, the writer used some steps to collect the data as follows:
1. The writer observed the class.
2. The writer determined two classes from the population into experiment group and control group.
3. The writer gave pretest to the experimental and control group. In the pretest, the writer gave two tests for both group; they were multiple choice (to measure students reading comprehension) and producing questions (to measure students’ ability in self-questioning strategy). This test gave for both group to measure and find out their mean before gave treatment.
4. The writer analyzed the result of pre test so that the data gained from the test were valid and reliable.
5. The writer taught the experiment group using self-questioning strategy and taught the control group conventially.
6. The writer gave a post-test to the experiment group and control group. 7. The writer gave scores to the data from experiment group and control group. 8. The writer analyzed the data that have been obtain from pre-test and
post-test.
9. The writer interpreted the analysis result.
G. Data Analysis Procedure
The writer analyzed the data acquire to answer the problem of the study about whether Self-Questioning strategy gives an effect or not toward students’ reading comprehension skill at the third semester English students of STAIN Palangka Raya, as follows:
1. Gave tests to the students of the third semester English students of STAIN Palangka Raya.
2. Collected the data of the students work sheet test result. 3. Gave score the students’ test result by using the formula:
Score = X100%
Where:
B : Frequency of the correct answers N : Number of test items
1. Compared pre-test and post-test difference score between experiment group and control group to find-out self-questioning effect on students’ score. 2. Classified students’ score based on category to find out the difference
between experiment group and control group.
3. Tabulated the students’ score into the percentage table based on item level. 4. Tabulated the data into the distribution of frequency of score table, then find
out the mean of students’ score, standard deviation, and standard error of
5. Calculated the data by using t-test to test the hypothesis of the study, whether the used of self-questioning gave effect to the students’ reading skill or not. To examine the hypothesis, the writer used t-test and SPSS 17.0 to answer the problem of the study with formula as follows:22
to=
M1-M2 : The difference of two means
SEm1-m2 : The standard error of the differences between two means
To know the hypothesis is accepted or rejected using the criterion:
If t-test (the value) ≥ ttable, it means Ha is accepted and Ho is rejected.
If t-test (the value) <ttable, it means Ha is rejected and Ho is accepted.
6. Interpreted the result of t-test. Previously, the writer accounted the degrees of freedom (df) with the formula:23
Anas Sudijono, pengantar Statistik Pendidikan, Jakarta: Rajawali Press, 1978, p.284. 23
N2 : Number of subject group 2
2 : Number of variable
After that, the value of T-test consulted on the t-table at the level of significance 1% and 5%. In this Study, the writer used the level of significance at 5%. If the result or T-test is higher than T-table, it means Ha is accepted. But if the result of T-test is lower than T-table, it means Ho is accepted.