THE LEARNING ENVIRONMENT AND MATHEMATICS
ACHIEVEMENT OF STUDENTS OF HIGH PERFORMANCE
SCHOOLS (HPS)
Mazlini Adnan1, Mohd Faizal Nizam Lee Abdullah1, Marzita Puteh1, Che Nidzam Che Ahmad1, Siti Mistima Maat 2
1
Faculty of Science and Mathematics,
Universiti Pendidikan Sultan Idris, Tanjong Malim, Perak 2
UniKL-MFI, Bangi, Selangor
ABSTRACT
The purpose of this research was to determine the learning environment and mathematics achievements of High Performance Schools (HPS) students. A total of 362 Form Four students participated in the study. It was conducted using the survey methodology, with a set of questionnaire which was divided into Sections A and B. Section A consists of demographic-based questions to find out respondents’ background information. Section B is the What Is Happening In This Class (WIHIC) instrument which consists of 40 items to examine students’ perception of student closeness, teacher support, involvement, cooperation and fairness in the classroom learning environment. In addition, the students’ mathematics achievement was based on the grades of their final examination. The preliminary study produces a Cronbach’s Alpha of 0.952 for WIHIC. Data were processed using SPSS Windows Version 20.0 analyzed to obtain percentage, frequency, mean, standard deviation, t-test and Pearson correlation. The data on students’ perception of their learning environment shows that the element of student closeness has the highest mean value, followed by the elements of cooperation, fairness, teacher support and involvement. In terms of students’ perception of the elements of involvement, cooperation and fairness, the results showed that there was a significant difference between male and female students. In addition, the study also found that there was a significant relationship between the elements of teacher support and fairness, and mathematics achievement.
Key words: learning environment, mathematics achievement, students’ perception
INTRODUCTION
The learning environment refers to a given space allotted for the learning process in the context of social, psychological or pedagogical which can influence students’ achievement and behavior (Fraser, 1998). Bandura’s social learning theory (1977) emphasized on the aspect of interaction which takes place between humans and their environment through reinforcement and observational learning. Bandura described the human behavior in terms of reciprocal interaction (determinism) (Shahabuddin et al., 2007), where humans influence their environment, and at the same time, they are influenced by the said environment (Yahya, 2006).
associated with their experience inside school (Salina et al., 2009). In addition, Salhah (2009) stated that Piaget (1973), through his constructivism theory believed that teachers should act as facilitators. They are to provide surroundings, teaching aids and environments which would allow learning to take place. Students should learn in a classroom where the physical and psychosocial environments encourage the learning process to happen. Since 30 years ago, studies related to the learning environment have grown rapidly and conducted by many researchers (Fraser, 1998; Fraser & Walberg, 1991; Margianti et al., 2001). These studies have proven that there is a link between the learning environment and the results of learning, in terms of students’ achievement, satisfaction and success (Ahmad, 2007).
The environment is the external conditions which affect and influence the human lives. There are two types of environments; the physical environment and the psychosocial environment. The physical environment is associated with the infrastructure development and material, such as a house. The non-physical environment is associated with emotional, cultural and social environments, which includes behavior, language and religion (Mizan, 2001). Students’ environment usually consists of their relationship with their teachers, parents and peers, both inside and outside the classroom. The learning environment refers to the school atmosphere which is determined by the schools’ vision, values and objectives. A good school atmosphere is actually established by a learning environment and school which is orderly, organized, calm and harmonious (Salina et al., 2009). Teachers should provide a conducive classroom for active social interaction and cooperation amongst the students (Salina et al., 2009). A conducive learning environment would promote learning and student development, which includes intellectual activities, friendship, cooperation and support (Nidzam et al., 2010).
Statement of Problem
The learning environment is an influential factor in students’ achievement. Quilter and Haper (1988) stated that there are three main causes of difficulty in learning mathematics, which are students’ intelligence, negative attitudes towards mathematics and the influence of the learning environment. A study by Fraser (1991) also shows that the school environment has an effect on students’ academic achievement and affections.
According to Rohaila et al. (2005), generally, the learning process is a complex one which involves two parties; the student and the learning environment. Nonetheless, well-equipped infrastructure and well-trained teachers are no guarantee to satisfactory academic achievement amongst all students. A group of students who are exposed to the same learning environment and strategies may not produce the same output in the classroom. This is due to a variety of reasons which can affect academic achievement (Rahman, 2007). HPS students come from various backgrounds and cultures which could be the reason as to why the same learning environment in the classroom is perceived differently by different students.
Humans are social creatures and the human behavior is closely influenced by their relationship with other humans. In the same sense, students’ social world develops in the course of their relationship with their peers (Yahya, 2006). The development of
students’ self-concept and their social relationship with their peers is very important. This goes in tandem with the National Philosophy of Malaysian Education, which aims to produce individuals who are sound and balanced (Salina et al., 2007). A close relationship with their peers would result in love and compassion, one of the important components of a good character. On the other hand, a problematic relationship with their peers would negatively affect the students’ focus in school, and could interfere with the teaching and learning process (Shahabuddin et al., 2007).
Since the learning style and learning environment are influential factors in students’ achievement, the researchers feel compelled to conduct a research on these factors so as to improve on the quality of students’ learning and excellence. It is very unfortunate when students who have the potential to excel in a subject fail to do so due to their learning styles that are not recognized by the teachers and the learning environment that is incompatible with their learning styles. Therefore, in order to produce excellent students, the contributing factors need to be identified and studied so that all the efforts can be geared towards achieving that goal effectively.
Research Objectives
The main objective of the research is to study the learning environment and mathematics achievements of HPS students under the Fully Boarding School (FBS) category. Specifically, the research aims to:
i. Identify students’ perception of their classroom learning environment,
ii. Identify differences in students’ perception of their classroom learning environment based on their gender,
iii. Identify relationships between the students’ perception of their classroom learning environment and their mathematics achievement.
METHODOLOGY
The research is conducted using survey methodology, through the distribution of a set of questionnaire as instrument to gather quantitative data. The population of the study is 5076, which are all the Form Four students of the 30 HPS under the FBS category. The Form Four students were selected due to the fact that they have been in school for a few years already, and are considered matured enough to give a reliable feedback (Nidzam et al., 2010). There are 362 respondents in the study (203 males and 159 females). Table 1 illustrates the distribution of the respondents.
Table 1. Distribution of Respondents
No. School Number of
students 1 Sekolah Menengah Sains Tengku Muhammad Faris
Petra
159
2 SBP Integrasi Tun Abdul Razak 103
3 Sekolah Menengah Sains Tengku Abdullah 100
Total 362
Research Instrument
The research instrument of the study is a set of questionnaire which comprises of two sections, Section A and Section B. Section A contains questions related to personal information of the respondents and Section B contains the WIHIC instrument. The WIHIC instrument is used to identify students’ perception of their classroom learning environment. The original version of WIHIC contains seven elements, with each element consisting of eight items. Each element is to identify students’ perception of their learning environment, which are student closeness, teacher support, involvement, research, task-orientation, cooperation and fairness. In this study, only five elements of the learning environment are used, namely student closeness, teacher’s support, involvement, cooperation and fairness. In all, there are forty items.
The scoring of WIHIC used a five-point Likert Scale, which consists of ‘almost never’, ‘rarely’, ‘sometimes’, ‘often’ and ‘very often’. The respondents are required to choose one of the five points which best describes them. Table 2 details each element of the WIHIC instrument.
Table 2. Details of elements of WIHIC
Elements Description
Student closeness How much students help and support one another. Teacher support How much teachers help and support students, and pay
attention to students’ problems.
Involvement How much students are interested to pay attention, participate in classroom and work with other students to come up with new ideas.
Cooperation How much students cooperate with one another during activities.
Fairness How much teachers treat all students equally, including paying compliments, asking questions and providing opportunities to participate in discussions.
(Source: Fraser, 1998)
Preliminary Study
A preliminary study was conducted on 40 Forth Form students from one of the HPS under the FRS category to determine the reliability index of the WIHIC instrument. The respondents were given a set of questionnaire which contained 37 items. The data analysis showed that Cronbach’s alpha coefficient value was 0.952. This indicated that the instrument is highly reliable.
FINDINGS
Mathematics achievement in this study is divided into five categories according to the respondents’ grades in their Final Examination. From the 362 respondents, 206 achieved excellent grades, 62 achieved upper credit grades, 44 achieved credit grades, 31 achieved pass grades and 19 had failed. In other words, 56.9% of the respondents
achieved excellent grades, 17.1% upper credit grades, 12.2% credit grades, 8.6% pass grades and 5.2% had failed.
Analysis of students’ perception of their classroom learning environment
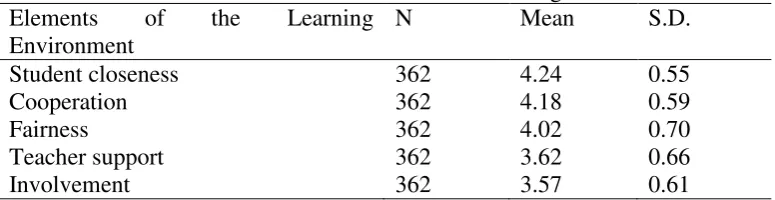
Analysis of descriptive statistics of the mean score was conducted on each element of the learning environment to obtain the mean values and standard deviation. The results of the analysis is arranged in order of the highest to the lowest mean values, as illustrated in Table 3. The element of student closeness has the highest mean value (4.24), followed by cooperation (4.18), fairness (4.02) and teacher support (3.62), while the element of involvement has the lowest mean value of 3.57.
Table3. Overall Mean of Elements of the Learning Environment Elements of the Learning
Environment
N Mean S.D.
Student closeness 362 4.24 0.55
Cooperation 362 4.18 0.59
Fairness 362 4.02 0.70
Teacher support 362 3.62 0.66
Involvement 362 3.57 0.61
Students’ Perception of the Element of Student Closeness
The findings show that the three items which have the highest mean are items C2, C1 and C3. Item C2“I know students of this class” has the highest mean (4.65), followed by item C1 “I like being friends with my classmates” with a mean value of 4.42 and item C3 “I am fond of my classmates” with a mean value of 4.40. On the other hand, two items with the lowest mean are items C6 and C7. Item C6 “I always help my classmates who have problems with their studies” has a mean value of 3.95. Item C7 “my classmates like me” has the lowest mean value of 3.93. Table 4 illustrates the mean of each item for the element of student closeness.
Table 4. Mean of student closeness items
Code Student Closeness Items N Mean S.D.
C2 I know students of this class. 362 4.65 0.59 C1 I like being friends with my classmates. 362 4.42 0.71 C3 I am fond of my classmates. 362 4.40 2.22 C4 My classmates are my friends. 362 4.33 0.83 C8 I always get help from my classmates. 362 4.26 0.78 C5 I can work well with my classmates. 362 4.20 0.79 C6 I always help my classmates who have
problems with their studies
362 3.95 2.28
C7 My classmates like me 362 3.93 0.78
Students’ Perception of the Element of Teacher Support
The findings show that the three items which have the highest mean are items C16, C12 and C10. Item C16 “teachers’ questions help with my understanding” has the highest mean value of 4.34. This is followed by item C12 “teachers help me when I have problems with my studies” with a mean value of 4.26 and item C10 “teachers try very hard to help me” with a mean value of 4.18. Two items with the lowest mean are items C11 and C14. Item C11 “teachers are sensitive to my feelings” has a mean value of 3.12. Item C14 “teachers are interested in my problems” has the lowest mean value of 3.10. Table 5 illustrates the mean of each item for the element of teacher support.
Table 5. Mean of teacher support items
Code Teacher support Items N Mean S.D.
C16 Teachers’ questions help with my understanding.
362 4.34 0.78
C12 Teachers help me when I have problems with my studies.
362 4.26 0.73
C10 Teachers try very hard to help me. 362 4.18 2.82
C13 Teachers discuss with me. 362 3.64 0.92
C15 Teachers go around the classroom to discuss with me.
362 3.25 1.16
C9 Teachers give personal attention to me. 362 3.18 0.85 C11 Teachers are sensitive to my feelings. 362 3.12 1.02 C14 Teachers are interested in my problems. 362 3.10 1.09
Students’ Perception of the Element of Involvement
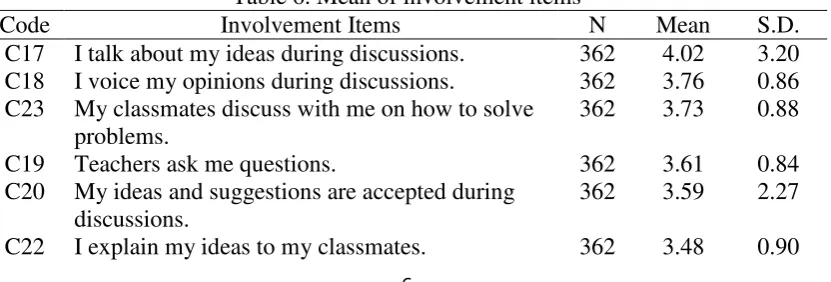
The findings show that the three items which have the highest mean are items C17, C18 and C23. Item C17 “I talk about my ideas during discussions” has the highest mean value of 4.02, followed by item C18 “I voice my opinions during discussions” with a mean value of 3.76 and item C23 “my classmates discuss with me on how to solve problems” with a mean value of 3.73. Meanwhile, two items with the lowest mean are items C24 and C21. Item C24 “I have been asked to explain on how to solve certain problems” has a mean value of 3.48. Item C21 “I ask the teachers questions” has the lowest mean value of 3.20. Table 6 illustrates the mean of each item for the element of involvement.
Table 6. Mean of involvement items
Code Involvement Items N Mean S.D.
C17 I talk about my ideas during discussions. 362 4.02 3.20 C18 I voice my opinions during discussions. 362 3.76 0.86 C23 My classmates discuss with me on how to solve
problems.
362 3.73 0.88
C19 Teachers ask me questions. 362 3.61 0.84
C20 My ideas and suggestions are accepted during discussions.
362 3.59 2.27
C22 I explain my ideas to my classmates. 362 3.48 0.90
C24 I have been asked to explain on how to solve certain problems.
362 3.48 0.97
C21 I ask the teachers questions. 362 3.20 0.98
Students’ Perception of the Element of Cooperation
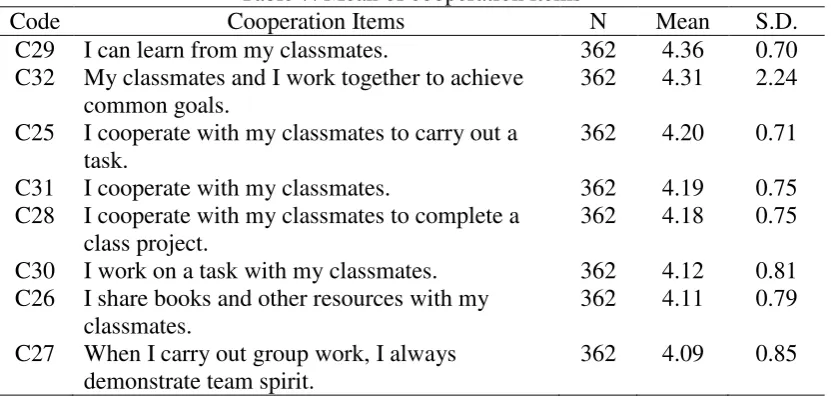
The findings show that the three items that have the highest mean are items C29, C32 and C25. Item C29 “I can learn from my classmates” has the highest mean value (4.36), followed by item C32 “my classmates and I work together to achieve common goals” has a mean value of 4.31, and item C25 “I cooperate with my classmates to carry out a task” has a mean value of 4.20.In contrast, the two items which have the lowest mean are items C26 and C27. Item C26 “I share books and other resources with my classmates” has a mean value of 4.11. Item C27 “when I carry out group work, I always demonstrate team spirit” has the lowest mean value of 4.09. Table 7 illustrates the mean of each item for the element of cooperation.
Table 7. Mean of cooperation items
Code Cooperation Items N Mean S.D.
C29 I can learn from my classmates. 362 4.36 0.70 C32 My classmates and I work together to achieve
common goals.
362 4.31 2.24
C25 I cooperate with my classmates to carry out a task.
362 4.20 0.71
C31 I cooperate with my classmates. 362 4.19 0.75 C28 I cooperate with my classmates to complete a
class project.
362 4.18 0.75
C30 I work on a task with my classmates. 362 4.12 0.81 C26 I share books and other resources with my
classmates.
362 4.11 0.79
C27 When I carry out group work, I always demonstrate team spirit.
362 4.09 0.85
Students’ Perception of the Element of Fairness
The findings show that there are three items with the highest mean; items C37, C36 and C35. Item C37 “I get encouragement from my teachers just like my classmates” has the highest mean value of 4.21, followed by item C36 “I am treated equally as my classmates” with a mean value of 4.20 and item C35 “I am given equal opportunity to express opinions just like my classmates” with a mean value of 4.17. In contrast, the two items with the lowest mean are items C38 and C39. Item C38 “I am given the same space and opportunity to contribute in classroom discussions” has the mean value of 3.92 and item C39 “my work gets the same compliment as my classmates” has a mean value of 3.71. Table 8 illustrates the mean of each item for the element of fairness.
Table 8. Mean of fairness items
Code Fairness Items N Mean S.D.
C37 I get encouragement from my teachers just like my classmates.
362 4.21 2.27
C36 I am treated equally as my classmates. 362 4.20 1.76 C35 I am given equal opportunity to express
opinions just like my classmates.
362 4.17 2.82
C33 Teachers pay equal attention to my questions as my classmates’ questions.
362 4.16 0.87
C34 I receive help just like my classmates. 362 4.13 0.86 C40 I have the same opportunity as my classmates
to answer questions in class.
362 4.01 0.90
C38 I am given the same space and opportunity to contribute in classroom discussions.
362 3.92 0.87
C39 My work gets the same compliment as my classmates.
362 3.71 0.94
The differences in students’ perception of the classroom learning environment between male and female students
The difference in students’ perception of the element of student closeness between male and female students
The analysis of T-test shows that the values of𝑡 =−0.89 and𝑝 = 0.38. This indicates
that there is no significant difference in the mean students’ perception of the element of student closeness between male and female students. The summary of the results is illustrated in Table 9.
Table 9. The difference in mean students’ perception of the element of student closeness between male and female students
Variable Gender N Mean S.D. t P
Student closeness
Male 203 4.22 0.57
-0.89 0.38 Female 159 4.27 0.53
*Significant at p < 0.05
The Difference in Students’ Perception of the Element of Teacher Support between Male and Female Students
The analysis of T-test shows that the values of 𝑡 =−0.81 and 𝑝= 0.42. This means
that there is no significant difference in the mean students’ perception of the element of teacher support between male and female students. The summary of the results is illustrated in Table 10.
Table 10. The difference in mean students’ perception of the element of teacher support between male and female students
Variable Gender N Mean S.D. t P
Teacher support
Male 203 3.59 0.64
-0.81 0.42 Female 159 3.65 0.68
*Significant at p < 0.05
The Difference in Students’ Perception of the Element of Involvement between Male and Female Students
The analysis of T-test shows that the values of 𝑡 =−3.05 and𝑝 = 0.00. This means
that there is a significant difference in the mean students’ perception of the element of involvement between male and female students. The summary of the results is illustrated in Table 11.
Table11. The difference in mean students’ perception of the element of involvement between male and female students
Variable Gender N Mean S.D. t P
Involvement
Male 203 3.48 0.59
-3.05* 0.00 Female 159 3.68 0.62
*Significant at p < 0.05
The Difference in Students’ Perception of the Element of Cooperation between Male and Female Students
The analysis of T-test show that the values of 𝑡= −2.48 and𝑝= 0.01. This indicates
that there is a significant difference in the mean students’ perception of the element of cooperation between male and female students. The summary of the results is illustrated in Table 12.
Table12. The difference in mean students’ perception of the element of cooperation between male and female students
Variable Gender N Mean S.D. t P
Cooperation
Male 203 4.11 0.62
-2.48* 0.01 Female 159 4.27 0.55
*Significant at p < 0.05
The Difference in Students’ Perception of the Element of Fairness between Male and Female Students
The analysis of T-test show that the values of 𝑡=−2.83 and 𝑝 = 0.01. This means that
there is a significant difference in the mean students’ perception of the element of
fairness between male and female students. The summary of the results is illustrated in Table 13.
Table13. The difference in mean students’ perception of the element of fairness between male and female students
Variable Gender N Mean S.D. T P
Fairness
Male 203 3.93 0.73
-2.83* 0.00 Female 159 4.14 0.64
*Significant at p < 0.05
The Relationship between Students’ Perception of the Classroom Learning Environment and Mathematics Achievement
The Relationship between Students’ Perception of the Element of Student Closeness and Mathematics Achievement
The analysis of the correlation test shows that the values of 𝑟= 0.02 and𝑝= 0.68.
This means that there is no relationship between students’ perception of the element of student closeness and mathematics achievement. The value of 𝑟= 0.02 is also at a
negligible correlation rate. The summary of the results is illustrated in Table 14.
Table 14. The relationship between students’ perception of the element of student closeness and mathematics achievement
Variables r r2 P
Student closeness
Mathematics achievement
0.02 0.0004 0.68
*Significant at p < 0.05
The Relationship between Students’ Perception of the Element of Teacher Support and Mathematics Achievement
The analysis of the correlation test shows that the values of 𝑟= 0.12 and𝑝= 0.02.
This indicates that there is a very weak relationship between students’ perception of the element of teacher support and mathematics achievement. The value of 𝑟= 0.12 is
also at a negligible correlation rate. The summary of the results is illustrated in Table 15.
Table 15. The relationship between students’ perception of the element of teacher supportand mathematics achievement
Variables r r2 P
Teacher support
Mathematics achievement
0.12* 0.0144 0.02
*Significant at p < 0.05
The Relationship between Students’ Perception of the Element of Involvement and Mathematics Achievement
The analysis of the correlation test shows that the values of𝑟= 0.10 and 𝑝= 0.05. This
indicates that there is no relationship between students’ perception of the element of involvement and mathematics achievement. The value of 𝑟= 0.10 is also at a
negligible correlation rate. The summary of the results is illustrated in Table 16.
Table 16. The relationship between students’ perception of the element of involvement and mathematics achievement
Variables r r2 P
Involvement
Mathematics achievement
0.10 0.01 0.05
*Significant at p < 0.05
The Relationship between Students’ Perception of the Element of Cooperation and Mathematics Achievement
The analysis of the correlation test shows that the values of 𝑟= 0.02 and𝑝= 0.67.
This indicates that there is no relationship between students’ perception of the element of cooperation and mathematics achievement. The value of 𝑟= 0.02 is also at a
negligible correlation rate. The summary of the results is illustrated in Table 17.
Table 17. The relationship between students’ perception of the element of cooperation and mathematics achievement
Variables R r2 P
Cooperation
Mathematics achievement
0.02 0.0004 0.67
*Significant at p < 0.05
The Relationship between Students’ Perception of the Element of Fairness and Mathematics Achievement
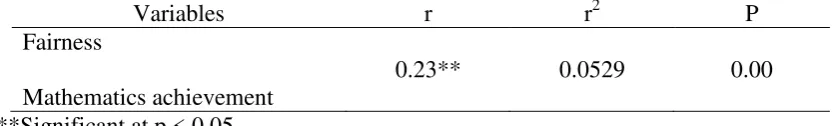
The analysis of the correlation test shows that the values of 𝑟= 0.23 and𝑝= 0.00.
This indicates that there is a weak relationship between students’ perception of the element of fairness and mathematics achievement. The value of 𝑟= 0.23 is also at a
low correlation rate. The summary of the results is illustrated in Table 18.
Table 18. The relationship between students’ perception of the element of fairness and mathematics achievement
Variables r r2 P
Fairness
Mathematics achievement
0.23** 0.0529 0.00
**Significant at p < 0.05
DISCUSSION
Students’ Perception of the Classroom Learning Environment
Data analysis shows that students have a positive perception of all the elements of the learning environment. The students have the best perception of student closeness element which has the highest mean, compared with other elements. This is followed by the element of cooperation, fairness, teacher support and involvement. Besides that, the findings also show the mean value of student closeness is almost the same as the mean value of cooperation. In addition, the mean value of teacher support is almost the same as the mean value of involvement.
The findings of the study correspond with findings by Brok et al. (2006) who found that students’ perception of the element of student closeness has the highest score, followed by task orientation, cooperation and fairness. The elements with lower scores are teacher support, involvement and investigation. Zandvliet and Straker (2001) also found that, in general, students have a positive perception of the element of student closeness, involvement, task orientation, cooperation and satisfaction. However, the study differs from Brok et al. (2008) who found that the element with the highest score is task orientation, followed by fairness and student closeness.
The Difference in Students’ Perception of the Learning Environment between Male and Female Students
The data was analyzed using T-test to determine whether there is a difference in mean students’ perception of the learning environment between male and female students. The results of the analysis show that there is no significant difference in mean students’ perception of the elements of student closeness and teacher support between male and female students. The findings support the findings by Shadreck (2012) who also found that there is no significant difference in students’ perception of the element of teacher support between male and female students. Additionally, Hoang (2008) found that there is no difference in students’ perception of the learning environment between male and female students. This shows that gender does not affect the learning environment. But, teachers should realize that their efforts may be perceived differently by different students (e.g. girls or boys).
However, data analysis shows that there is a significant difference in mean students’ perception of the elements of involvement, cooperation and fairness between male and female students. The finding is supported by Telli et al. (2009) who also found that there a significant difference in students’ perception of the element of fairness between male and female students. The finding also shows that female students have a better perception of the elements of involvement, cooperation and fairness than male students. This is evident when the mean score of both genders are compared with each other. Such findings correspond with findings by Brok et al. (2008) who also found that female students have more positive perception of their learning environment compared with male students. This means that female students tend to get involved in study groups, are more willing to cooperate, and interact with one another more easily than male students (Fraser, 1998).
The Relationship between Students’ Perception of the Classroom Learning Environment and Mathematics Achievement
Studies which associate the learning environment and mathematics achievement are still limited in numbers. Most researches so far have associated the learning environment with academic achievement. In contrast, this study looks at the relationship between students’ perception of the learning environment and their mathematics and academic achievements.
Pearson correlation statistical test is used to analyses data to determine whether there is a relationship between students’ perception of the classroom learning environment and mathematics achievement. The results show that there is no relationship between students’ perception of the elements of student closeness, involvement and cooperation, and mathematics achievement. However, the results also show that there is a very weak relationship between students’ perception of the elements of teacher support and fairness, and mathematics achievement.
The findings of this study support the findings by Rita and Martin (2011) who found that there is a relationship between students’ perception of the elements of teacher support and fairness, and students’ academic achievement. Ahmad (2007) also found that there is no relationship between the elements of student closeness and cooperation and students’ achievement. Similarly, Margianti et al. (2001) found that there is a significant relationship between the element of fairness and mathematics achievement. However, all of these findings do not show any significant relationship between the element of student closeness and mathematics achievement. On the contrary, Salina et al. (2007) found that there is a significant relationship between students’ perception of the elements of student closeness and involvement, and mathematics achievement. To make the mathematics achievement to a high level, efforts must be taken to strengthen the school environment. So that, the environment boosts up not only the mathematics achievement of students but their social ability, healthy status and moral values also.
CONCLUSION
The finding of this study has given insight on the HPS students’ learning environment. The study shows that HPS students have the best perception of the element of student closeness, followed by the elements of cooperation, fairness, teacher support and involvement. Furthermore, the results also show that there is a difference in students’ perception of the elements of involvement, cooperation and fairness between male and female students. Finally, the results show that there is a significant relationship between students’ perception of the elements of teacher support and fairness and mathematics achievement. The results are likely to be especially helpful for educators, educational policy-makers, parents and community members who will able to read the results and determine if the findings can assist them in advocating for funding at local, state and federal venues to increase educational reform that will help narrow the gap between gender in classroom environment perceptions.
REFERENCES
Ahmad, I. (2007). Persekitaran pembelajaran dalam bilik darjah serta pencapaian akademik: pelajar jurusan perakaunan program matrikulasi. Perak: Universiti Pendidikan Sultan Idris.
Azizi, Y., Asmah, S., Zurihanmi, Z., & Fawziah, Y. (2005). Aplikasi kognitif dalam pendidikan. Kuala Lumpur: PTS Professional Publishing.
Bandura, A. (1977). Social learning theory. Englewood Cliffs, NJ: Prentice-Hall. Brok, P., Fisher, D. L., Rickar, T., & Bull, E. (2006). Californian science student’s
perceptions of their classroom learning environment. Educational Research and Evaluation, 12(1), 3-25.
Brok, P., Telli, S., Cakiroglu, J., Taconis, R., & Tekkaya, C. (2008). Learning environment profiles of Turkish secondary biology classroom. Learning Environment Research Journal, 13(1), 187-204.
Fraser, B. (1991). Two decades of classroom environment research. In B. Fraser & H. Walberg (Eds.), Educational environments. Evaluation, antecedents and consequences (pp. 3-27). Oxford: Pergamon Press.
Fraser, B. J., & Walberg, H. J. (1991). Education environment: Evaluation, antecedents and consequences. Oxford, England: Pergamon Press.
Fraser, B. J. (1998). Classroom environment instruments: Development, validity and applications. Journal of Learning Environment Research, 1(2), 7-34.
Hoang, T. N. (2008). The effects of grade level, gender and ethnicity on attitude and learning environment in mathematics in high school. International Electric Journal of Mathematics Education, 3(1), 20-38.
Margianti, E. S., Fraser, B. J., & Aldridge, J. M. (2001). Investigating the learning environment and students’ outcomes in university level Indonesia. Seattle, WA: American Educational Research Association.
Mizan, A. A. I. (2001). Pengurusan personaliti murid. Shah Alam, Selangor: Cerdik Publication.
Nidzam, C. A., Kamsiah, O., & Lilia, H. (2010). Hubungan ramalan persekitaran pembelajaran makmal sains dengan tahap kepuasan pelajar. Jurnal Pendidikan Malaysia, 35(2), 19-30.
Piaget, J. (1973). Main Trends in Psychology. London: George Allen & Unwin.
Quilter, D., & Harper, E. (1988). Why we didn’t like mathematics and why we can’t do it. Journal of Educational Research, 30(2), 121-134.
Rahman, M. K. (2007). Guru sebagai penyelidik. Kuala Lumpur: PTS Professional Rita, R. D., & Martin-Dunlop, C. S. (2011). Perceptions of the learning environment
and associations with cognitive achievement among gifted biology students. Learning Environments Research, 14, 25-38.Publishing.
Rohaila, Y., Norasmah, O., & Faridah, K. (2005). Strategi pembelajaran pengalaman berasaskan Model Kolb dalam pendidikan perakaunan. Jurnal Pendidikan Malaysia, 30(1), 113-128.
Salhah, A. (2009). Kecerdasan pelbagai: Aplikasi dalam pengajaran dan pembelajaran. Kuala Lumpur: PTS Professional Publishing Sdn. Bhd.
Salina H., Peridah, B., & Ghani, K. A. (2007). Korelasi antara persekitaran pembelajaran matematik, sikap pelajar terhadap matematik dan pencapaian pelajar dalam matematik: Satu kajian kes. ESTEE Academic Journal UITM
Pulau Pinang, 4(2), 91-103.
Salina, H., Peridah, B., & Ghani, K. A. (2009). Persekitaran pembelajaran matematik dan hubungan dengan pencapaian pelajar. Melaka: Conference On Science & Social Research.
Shadreck, M. (2012). Zimbabwean science students’ perceptions of their classroom learning environments and attitude towards science. Mediterranean Journal of Social Science, 3(11), 415-425.
Shahabudin, H., Rohizani, Y., & Zohir, A. (2007). Pedagogi: Strategi dan teknik mengajar dengan berkesan. Kuala Lumpur: PTS Profesional Publishing.
Telli, S., Brok, P., Tekkaya, C., & Cakiroglu, J. (2009). Turkish students’ perceptions of their biology learning environments: The effect of gender and grade level. Asian Journal of Educational Research and Synergy, 1(1), 200-219.
Vygotsky, L. S. (1981). The instrumental method in psychology. In J. V. Wertsch (Ed.), The concept of activity in Soviet psychology (pp.134-144). Armonk, NY: M.E. Sharpe.
Yahya, D. (2006). Psikologi sosial dalam pendidikan. Kuala Lumpur: PTS Professional Publishing.
Zandvliet, D. B. & Straker, L. (2001). Physical and psychological aspects of the learning environment in information technology rich classrooms. Ergonomics, 44(9), 838-857.
Corresponding Author: Dr. Mazlini Adnan
Faculty of Science and Mathematics Universiti Pendidikan Sultan Idris, Tanjong Malim, Perak Darul Ridzuan E-mail: [email protected]