Individual muscle contributions to push and recovery subtasks during
wheelchair propulsion
Jeffery W. Rankin
a, W. Mark Richter
b, Richard R. Neptune
a,n aDepartment of Mechanical Engineering, The University of Texas at Austin, 1 University Station C2200, Austin, TX 78712, USA bMAX Mobility, LLC, Antioch, TN, USA
a r t i c l e
i n f o
Article history:
Accepted 18 February 2011
Keywords:
Segment power analysis Musculoskeletal model Upper extremity Biomechanics Muscle function
a b s t r a c t
Manual wheelchair propulsion places considerable physical demand on the upper extremity and is one of the primary activities associated with the high prevalence of upper extremity overuse injuries and pain among wheelchair users. As a result, recent effort has focused on determining how various propulsion techniques influence upper extremity demand during wheelchair propulsion. However, an important prerequisite for identifying the relationships between propulsion techniques and upper extremity demand is to understand how individual muscles contribute to the mechanical energetics of wheelchair propulsion. The purpose of this study was to use a forward dynamics simulation of wheelchair propulsion to quantify how individual muscles deliver, absorb and/or transfer mechanical power during propulsion. The analysis showed that muscles contribute to either push (i.e., deliver mechanical power to the handrim) or recovery (i.e., reposition the arm) subtasks, with the shoulder flexors being the primary contributors to the push and the shoulder extensors being the primary contributors to the recovery. In addition, significant activity from the shoulder muscles was required during the transition between push and recovery, which resulted in increased co-contraction and upper extremity demand. Thus, strengthening the shoulder flexors and promoting propulsion techniques that improve transition mechanics have much potential to reduce upper extremity demand and improve rehabilitation outcomes.
&2011 Elsevier Ltd. All rights reserved.
1. Introduction
Nearly 70% of manual wheelchair users will likely experience
upper extremity (UE) pain or overuse injury at some point in their
lifetime (
Finley and Rodgers, 2004
). One of the main activities
that contribute to the development of UE pathology is wheelchair
propulsion. Specifically, the rate and magnitude of the propulsive
force has been associated with symptoms of UE pathology
(
Boninger et al., 1999
;
Gellman et al., 1988
;
Mercer et al., 2006
).
To help alleviate the detrimental effects of propulsive force on UE
health, recent efforts have been devoted to investigating how
different propulsion techniques influence UE demand during
propulsion (e.g.,
de Groot et al., 2008
,
2002
;
Lenton et al., 2009
).
However, an important prerequisite for understanding the
rela-tionships between propulsion technique and UE demand is to
identify how individual muscles contribute to the flow of
mechanical power throughout the stroke.
Previous studies have analyzed excitation timing from
UE electromyography (EMG) throughout the stroke to broadly
classify muscles as having either a push phase (i.e., region of
hand–handrim contact) or recovery phase (i.e., region without
hand–handrim contact) function (
Mulroy et al., 2004
;
Tries,
1989
). Others have used inverse dynamics to determine the flow
of joint power between the trunk, arm and hand/handrim during
propulsion (
Guo et al., 2006
,
2003
). They showed that mechanical
power generated at the shoulder and trunk was delivered to the
arm and handrim during the push phase and then absorbed from
the arm during the recovery phase as a result of trunk and
shoulder extension. These results suggest that shoulder muscles
play an important role in both mechanical power generation and
arm recovery. However, no study has identified individual muscle
contributions to the mechanical energetics of wheelchair
propul-sion, which would provide insight into how individual muscles
work in synergy to satisfy the mechanical demands of wheelchair
propulsion.
The purpose of this study was to use a representative forward
dynamics simulation of wheelchair propulsion that emulates
group-averaged wheelchair mechanics to determine how
indivi-dual muscles deliver, absorb and/or transfer mechanical power
during the task. This understanding has important implications
for designing training techniques that help reduce UE muscle
demand during propulsion and improve rehabilitation outcomes.
Contents lists available at
ScienceDirect
journal homepage:
www.elsevier.com/locate/jbiomech
www.JBiomech.com
Journal of Biomechanics
0021-9290/$ - see front matter&2011 Elsevier Ltd. All rights reserved. doi:10.1016/j.jbiomech.2011.02.073
n
2. Methods
2.1. Experimental data
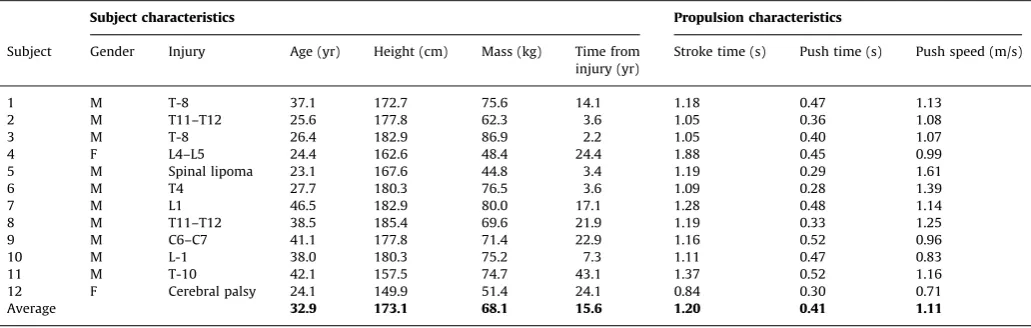
Experimental data were collected from 12 experienced wheelchair users who had full UE function without pain and were capable of continuous wheelchair propulsion for 5 min (Table 1). After providing informed consent, data were collected using previously described procedures (Rankin et al., 2010). Briefly, participants propelled their wheelchair on a motor-driven treadmill at their self-selected overground speed for 30 s, during which trunk and right side UE kinematics, 3D handrim kinetics, and shoulder and elbow EMG data were collected. Ten consecutive strokes were analyzed from each subject, with each stroke beginning when a discernable tangential force was applied to the handrim. Push and recovery phase data for each stroke were normalized using cubic spline interpolation and averaged for each subject. Mean subject data were then averaged across subjects to create representative biomecha-nical and muscle excitation profiles.
2.2. Musculoskeletal model
An UE musculoskeletal model based on the work ofHolzbaur et al. (2005)was developed using SIMM (Musculographics, Inc., Santa Rosa, CA, USA) and used to create a wheelchair propulsion simulation. The model is described in detail
inRankin et al. (2010). Briefly, the model consisted of segments representing
the trunk and right side upper arm, forearm and hand. Shoulder movement was defined using a set of Euler rotations (Y,X,Y0) based on International Society of Biomechanics recommendations (Wu et al., 2005), representing plane of elevation, elevation angle (thoracohumeral angle) and internal–external (axial) rotation. In addition, a scapulohumeral rhythm was defined using regression equations based on cadaver data (de Groot and Brand, 2001). Elbow flexion–extension and forearm pronation–supination were represented by two additional rotations. Trunk lean was prescribed to match the experimental data and hand translation was constrained to follow the circular handrim path during the push phase. The wrist joint was fixed in the anatomical position. Non-sagittal trunk motion was not modeled. Model equations-of-motion were generated using SD/FAST (PTC., Need-ham, MA, USA).
Twenty-six Hill-type musculotendon actuators, governed by intrinsic muscle force–length–velocity relationships (Zajac, 1989), were used to represent the major muscles crossing the shoulder and elbow joints (Table 2). Polynomial regression equations based on original model definitions (Holzbaur et al., 2005) were used to describe musculotendon length and moment arm paths, with maximum differences less than 10% (Rankin et al., 2010). Each actuator received a distinct excitation signal except the three actuators representing the latissimus dorsi, the two actuators representing the sternal pectoralis major and the two actuators representing the anconeus and lateral triceps brachii. Muscles in each of these groups received the same excitation signal. Excitation–activation dynamics were modeled using a first-order differential equation (Raasch et al., 1997) with muscle-specific time constants (Happee and Van der Helm, 1995;Winters and
Stark, 1988). Muscle force was calculated based on the current muscle state
(length, velocity, activation) at each time step (Zajac, 1989).
2.3. Dynamic optimization
A global optimization algorithm (simulated annealing,Goffe et al., 1994) was used to identify muscle excitation patterns that minimized differences between
the simulation and group-averaged experimental propulsion data using an optimal tracking cost function (Neptune et al., 2001). Quantities included in the cost function were the three shoulder angles, elbow flexion–extension and forearm rotation angles, and the 3D handrim forces. The simulation handrim forces were determined using SD/FAST.
Table 1
Individual and group average subject characteristics and propulsion data.
Subject characteristics Propulsion characteristics
Subject Gender Injury Age (yr) Height (cm) Mass (kg) Time from injury (yr)
Stroke time (s) Push time (s) Push speed (m/s)
1 M T-8 37.1 172.7 75.6 14.1 1.18 0.47 1.13
2 M T11–T12 25.6 177.8 62.3 3.6 1.05 0.36 1.08
3 M T-8 26.4 182.9 86.9 2.2 1.05 0.40 1.07
4 F L4–L5 24.4 162.6 48.4 24.4 1.88 0.45 0.99
5 M Spinal lipoma 23.1 167.6 44.8 3.4 1.19 0.29 1.61
6 M T4 27.7 180.3 76.5 3.6 1.09 0.28 1.39
7 M L1 46.5 182.9 80.0 17.1 1.28 0.48 1.14
8 M T11–T12 38.5 185.4 69.6 21.9 1.19 0.33 1.25
9 M C6–C7 41.1 177.8 71.4 22.9 1.16 0.52 0.96
10 M L-1 38.0 180.3 75.2 7.3 1.11 0.47 0.83
11 M T-10 42.1 157.5 74.7 43.1 1.37 0.52 1.16
12 F Cerebral palsy 24.1 149.9 51.4 24.1 0.84 0.30 0.71
Average 32.9 173.1 68.1 15.6 1.20 0.41 1.11
Table 2
Upper extremity muscle definitions and group abbreviations. Muscles were grouped based on a combination of anatomical location and muscle function (identified from the segment power analysis).
Muscle Origin Insertion
Pectoralis major, clavicular head Clavicle Humerus Pectoralis major, sternal head 1 Thorax Humerus Pectoralis major, sternal head 2 Thorax Humerus
Corachobrachialis Scapula Humerus
LAT
Teres major Scapula Humerus
Lattissimus dorsi 1 Thorax Humerus
Lattissimus dorsi 2 Thorax Humerus
Lattissimus dorsi 3 Thorax Humerus
SUBSC
Biceps brachii, short head Scapula Radius Biceps brachii, long head Scapula Radius TRIlat
Anconeus Humerus Ulna
Triceps brachii, lateral Humerus Ulna Triceps brachii, medial Humerus Ulna TRIlong
Triceps brachii, long head Scapula Ulna SUP
Supinator Ulna Radius
PT
Pronator quadratus Ulna Radius
Neural excitation patterns were defined using a linear sum of four para-meterized Henning patterns, defined by twelve parameters and given by the equation:
X4
i¼1 uiðtÞ ¼
mi
2 1cos 2 pðtaiÞ biai
h i
, airtrbi 0 Otherwise
( )
whereuiis the excitation value of Henning patterniat timetandmi,aiandbi
represent the magnitude, onset parameters and offset parameters, respectively. The twenty-two excitation signals resulted in 264 total parameters to be optimized. To assure that the solution produced excitation patterns similar to the experimental data, the average EMG data were used to constrain muscle excitation onset and offset timing. Muscles without available EMG data had unconstrained excitation timing.
2.4. Segment power analysis
A segment power analysis (Fregly and Zajac, 1996) was performed to identify individual muscle contributions to body segment mechanical energetics over the entire stroke, which uses individual muscle power data to quantify how a muscle generates (absorbs) instantaneous mechanical power to (from) each body segment at every time-step over the stroke. Positive (negative) segment power indicates that the muscle accelerates (decelerates) the segment in the direction of its motion. Individual muscle contributions to net trunk rotation and handrim push power were also determined. Since muscle power is a scalar, this allowed individual contributions to the upper arm, forearm and hand segments to be combined into a single arm power value. Then each muscle’s biomechanical function was determined by its power contribution to the push (handrim power generation) and recovery (arm relocation) subtasks.
3. Results
The dynamic optimization produced a simulation that closely
emulated the group-averaged experimental data with average
joint kinematic and handrim force differences of 2.0
1
and 2.4 N,
respectively, which were well within one standard deviation of
the experimental data (12.3
1
and 8.3 N,
Table 3
,
Fig. 1
). Net
positive power was delivered to the handrim over the entire push
phase (
Fig. 2
; dotted line positive). The majority of the power was
delivered directly to the handrim (
Fig. 2
; dotted and solid lines
similar), although some power was transferred from the arm to
the handrim during the second half of the push phase (
Fig. 2
;
dashed line negative, dotted line
4
solid line at
21–34% stroke).
During the recovery phase, muscle contributions to arm power
alternated between absorption and delivery (
Fig. 2
; sign of dashed
line alternates) in order to reposition the arm for the subsequent
push. Overall, the trunk did not provide or remove much power
from the system (
Fig. 2
; dash–dot line
0).
3.1. Push phase subtask
Of the shoulder muscles, the middle deltoid (
Table 2
, MDELT)
was the primary contributor to total mechanical power during the
initial third (0–11% stroke) of the push phase (
Fig. 3
; positive solid
line), primarily by transferring energy from the arm (
Fig. 3
; dashed
line negative, dotted line
4
solid line). Subsequently, the pectoralis
major group (
Table 2
, PECM), anterior deltoid (ADELT) and
infra-spinatus (INFSP) generated the majority of total mechanical power
but varied in their relative contributions to arm and handrim power.
While PECM delivered power primarily to the handrim, ADELT
delivered power to both the handrim and the arm (
Fig. 3
; dotted
and dashed lines). INFSP transferred power from the arm to the
handrim in addition to generating power directly to the handrim
(
Fig. 3
; dotted
4
solid line, dashed line negative). Teres minor
(TMIN) also transferred power in a similar manner to the INFSP
during early push; however, power contributions were small (
Fig. 3
).
At the end of the push phase (30–34% stroke), the middle deltoid
(MDELT), SUBSC and latissimus dorsii group (
Table 2
, LAT) absorbed
power (
Fig. 3
; negative solid lines).
The biceps brachii (
Table 2
; BIC) delivered power to the
handrim over the initial two-thirds of the push phase, with power
Table 3
Average differences between experimental and simulated kinematics and handrim forces. The simulation differences were within one standard deviation (1SD) of the experimental data.
Simulation difference
Experimental variability (1SD)
Shoulder elevation angle (deg) 0.3 14.4 Shoulder plane of elevation (deg) 1.7 6.0 Shoulder internal–external rotation (deg) 5.5 15.4 Elbow flexion–extension (deg) 1.0 12.5 Forearm pronation–supination (deg) 1.4 13.1 All joints (deg) 2.0 12.3 Tangential handrim force (N) 2.27 7.74 Radial handrim force (N) 3.75 9.42 Lateral handrim force (N) 1.14 7.82 All forces (N) 2.39 8.33
contributions similar in magnitude to the shoulder muscles (
Fig. 4
;
dotted line). At the end of the push phase, both BIC and the
uniarticular elbow flexors (
Table 2
; BRD) absorbed power (
Fig. 4
;
solid lines negative). Conversely, the long head of the triceps
(TRIlong) first absorbed and then delivered power (
Fig. 4
; solid
line). The uniarticular elbow extensors (
Table 2
; TRIlat) absorbed
handrim power during the initial third of the push phase (
Fig. 4
).
The pronator teres group (
Table 2
; PT) primarily transferred power
between the handrim and arm (
Fig. 4
; dotted and dashed lines
have opposite signs) instead of directly generating or absorbing
power during the push phase (
Fig. 4
; solid line near 0).
3.2. Recovery phase subtask
During the recovery phase, muscles systematically alternated
between delivering and absorbing arm power to retract the arm
(
Fig. 5
; dotted line), with most muscles falling into one of two
groups. The first group, consisting of the shoulder extensors
(
Table 2
; MDELT, PDELT, LAT), elbow flexors (BIC, BRD) and SUBSC
absorbed power from the arm at the beginning of the recovery
phase (
Figs. 3 and 4
; dashed line at
35–44% stroke). BRD, PDELT
and SUBSC then acted to deliver arm power during the middle of
recovery (45–78% stroke). Towards the end of recovery (
4
78%
stroke), MDELT and BIC acted to first absorb and then deliver arm
power (
Figs. 3 and 4
; dashed line). The second group, consisting of
the shoulder flexors (
Table 2
; ADELT, PECM), INFSP and elbow
extensors (TRIlat, TRIlong) initially delivered a small amount of
power to the arm and then absorbed power during most of the
recovery phase (
Figs. 3 and 4
; dashed line). Towards the end of
recovery, TRIlat absorbed and ADELT generated arm power. The
most distal arm muscles (PT, SUP) generated little power during
recovery, except for PT delivering marginal power to the arm near
the end of recovery (
Fig. 4
). If active, muscles switched from (to)
power absorption to (from) generation when hand movement
direction changed (
Fig. 5
).
4. Discussion
The goal of this study was to identify the functional roles of
individual muscles by determining how each muscle delivers,
absorbs and/or transfers mechanical power to achieve wheelchair
propulsion. Consistent with previous studies that found a division
of labor between push and recovery phases, muscles generally
functioned to either deliver power to the handrim or reposition
the arm (
Gutierrez et al., 2005
;
Lin et al., 2004
;
Mulroy et al.,
1996
;
Veeger et al., 2002
).
Fig. 2.Net contributions to segment power during the push and recovery phases. Individual segment powers were combined into four groups for analysis: arm (upper arm, forearm and hand segments, dashed line), trunk (trunk, scapula and clavicle, dash–dot line), handrim (external handrim power, dotted line) and total (sum of all segments, solid line). A positive (negative) value indicates power was delivered to (absorbed from) the corresponding body segments.
4.1. Push phase energetics
Net push phase arm power was consistent with the results
of
Guo et al. (2003
,
2006)
, who performed a joint-level power flow
analysis using an inverse dynamics model, with upper limb power
systematically decreasing to a peak negative value (i.e., power
absorption) near the transition point between push and recovery
phases (
Fig. 2
; dotted line). Similarly, the simulation agreed with
previous studies in which net handrim power was found to be
positive throughout the push phase (
Dallmeijer et al., 1998
;
Guo
et al., 2006
,
2003
;
Kwarciak et al., 2009
), indicating that power is
provided to the handrim throughout the push to propel the
wheelchair forward (
Fig. 2
; dotted line). Unlike the findings
of
Guo et al. (2003
,
2006)
, net power contributions from trunk
lean were minor (
Fig. 2
; dash–dot line near 0), which may be
attributed to the different study populations.
Guo et al. (2003
,
2006)
used healthy subjects that generally have greater trunk
excursions than individuals with spinal cord injury, which would
result in the body providing more power during the push
(
Rodgers et al., 2003
).
ADELT, PECM and INFSP were the primary contributors to
mechanical power during the push phase, which was consistent
with the large shoulder flexion moments and powers found by
others (
Koontz et al., 2002
;
Kulig et al., 1998
;
Morrow et al., 2010
;
Rodgers et al., 2003
;
Sabick et al., 2004
) and suggests that
wheelchair users likely select arm configurations that allow the
shoulder flexors to function as the primary actuators during the
push phase. All three muscle groups had similar trends in power
generation, with peak power output occurring near the middle to
end of the push phase (
Fig. 3
), consistent with muscle power
estimates from quasi-static analyses during two different
wheel-chair propulsion conditions (
Bregman et al., 2009
). Most notable
was INFSP, which contributed more handrim power than any
other muscle during the push phase. However, as a rotator cuff
muscle, INFSP is also responsible for helping stabilize the
gleno-humeral joint. Because of its dual roles of handrim power
generation and joint stabilization, INFSP generates large forces
and shoulder flexion moments (
Lin et al., 2004
;
Veeger et al.,
2002
) during propulsion and may be highly susceptible to fatigue.
At the end of the push phase, both shoulder flexors and
extensor were active (
Fig. 3
). This muscle co-contraction is
necessary to reverse the direction of arm movement once the
hand releases the handrim. At this time, the wheelchair user must
transition between the push and recovery subtasks, which require
activity from muscles with antagonistic functions. Muscles that
deliver handrim power during the push phase (PECM, INFSP) also
accelerate the arm forward after release (see Recovery phase
energetics, below), a function counterproductive to the need to
reduce the kinetic energy of the arm (i.e., to retract and elevate
the hand during recovery,
Guo et al., 2003
). However, these
muscles continue to deliver power for a short time after handrim
release during muscle deactivation. Similarly, LAT and MDELT,
which assist in recovery, are excited during the transition region
to have sufficient activation time for generating force to absorb
arm power and slow down forward hand movement. Combined
with the force acting on the arm from the handrim, MDELT will
act to elevate the humerus within the glenohumeral joint and
create a condition requiring increased joint stabilization from
antagonistic muscles to prevent humeral subluxation. Both PECM
and INFSP help stabilize this joint, but these groups also provide
much of the handrim power and are susceptible to fatigue.
Therefore, demand for other muscles (e.g., TMIN, SUBSC) to
provide joint stabilization may increase, which could explain
the high prevalence of shoulder injuries in wheelchair users (up
to 70%,
Curtis et al., 1999
;
Gellman et al., 1988
). Thus, propulsion
Fig. 4.Elbow and forearm muscle contributions to segment power during the propulsion and recovery subtasks. Individual segment powers were combined into four groups for analysis: arm (upper arm, forearm and hand segments, dashed line), trunk (trunk, scapula and clavicle, dash–dot line), handrim (external handrim power, dotted line) and total (sum of all segments, solid line). A positive (negative) value indicates power was delivered to (absorbed from) the corresponding body segments. Note the change in vertical scale for BIC.
techniques that improve transition mechanics may have a
sig-nificant influence on UE demand and improve rehabilitation
outcomes.
Both BIC and TRIlong were active during the majority of the
push phase, with BIC delivering power directly to the handrim
during the first half and TRIlong delivering power during the
second half of the push (
Fig. 4
). Previous modeling studies have
found the elbow joint moment to systematically switch from
flexion to extension during the push (
Price et al., 2007
;
Richter,
2001
;
Veeger et al., 1991
), which is likely due to a transition from
elbow flexor to elbow extensor muscle power generation
(
Bregman et al., 2009
). The observed functions of BIC and TRIlong
as providers of handrim power support the need for a flexor–
extensor pattern, as BIC and TRIlong are best suited to generate
handrim power at the beginning and end of the push phase,
respectively. Although both groups had major roles in handrim
power generation, the prevalence of elbow injuries in wheelchair
users is much lower (
16%,
Sie et al., 1992
). This may be the
result of lower co-contraction, a shorter duration of elbow muscle
activity and/or the greater inherent stability of the elbow joint.
PT, a distal muscle, did not directly deliver or absorb power but
acted to transfer energy between the arm and handrim (
Fig. 3
).
This function is similar to that performed by the distal ankle
muscles during bicycle pedaling, which act to transfer power from
the leg to the crank (
Neptune et al., 2000
;
Raasch et al., 1997
).
4.2. Recovery phase energetics
Repositioning the arm in preparation for the subsequent push
is a complex task, with muscles required to (1) absorb power to
decelerate the forward movement of the arm, (2) deliver power to
accelerate the arm posteriorly, (3) again absorb power to
decele-rate the arm and (4) again deliver power to acceledecele-rate the arm
anteriorly in preparation for handrim contact during the
subse-quent push (
Figs. 2 and 5
). In addition, the arm must achieve
sufficient clearance from the handrim during recovery.
Both LAT and SUBSC helped reposition the hand during the
initial recovery phase by absorbing power (i.e., decelerate the
arm). SUBSC and PDELT then delivered power to accelerate the
arm posterior (
Fig. 3
). In contrast, PECM and INFSP functioned to
accelerate the arm forward during the initial recovery phase
(
Fig. 3
; dotted lines). With the exception of ADELT, which
functioned to provide power to the arm at the end of recovery
(
4
90% stroke), the shoulder muscles were less active at the end
of recovery. Low shoulder activity during this region was
con-sistent with
Price et al. (2007)
who found that shoulder joint
power during recovery was near zero during the end of the
recovery phase (
Fig. 3
). Instead, most of the arm power was
delivered by PT and BIC (
Fig. 4
). Some co-contraction also
occurred at the elbow during the end of recovery (
Fig. 4
; BIC,
TRIlong) suggesting that this period requires a large amount of
elbow stabilization in preparation for contact with the handrim.
Overall, the reduced roles of the shoulder muscles suggest that
the recovery phase places less demand on the shoulder and
rehabilitation outcomes may be improved by focusing on the
push phase.
There are some potential limitations to this study. First, trunk
movement outside the sagittal plane was not included and only
the right arm was used in the simulation, which was based on the
assumption that wheelchair propulsion is a symmetric
move-ment. Although previous work has shown that wheelchair
mechanics may be asymmetric (
Hurd et al., 2008
), the majority
of wheelchair users have kinematic symmetry (
Goosey-Tolfrey
and Kirk, 2003
) and differences in muscle function are likely to be
small. Trunk contributions to propulsion energetics were small in
this study, suggesting that out-of-plane trunk movement may
have little influence on the study results. However, users do
incorporate a wide range of propulsion techniques (
Boninger
et al., 2002
;
Dubowsky et al., 2009
) and future studies
investigat-ing the influence of different propulsion techniques on muscle
function should be performed. Also, to reduce simulation
com-plexity, the wrist was fixed in the anatomical position and fingers
were not modeled. Because a closed loop exists between the trunk
and handrim, wrist movement can influence elbow and shoulder
kinematics and may play a role in distal muscle function.
How-ever, the simulation in this study replicated well actual
experi-mental shoulder and elbow joint kinematics, which limits the
influence a fixed wrist would have on other joints. Previous
studies have also shown wrist moments to be much lower than
those at other joints, with a primary function of power transfer
instead of generation or absorption (
Guo et al., 2006
,
2003
;
Robertson et al., 1996
;
Sabick et al., 2004
). Last, a treadmill was
used to collect the experimental data, which may not replicate
normal propulsion. However, recent work has shown that the
major characteristics of treadmill propulsion are similar to those
observed overground (
Kwarciak et al., in press
).
5. Conclusion
During wheelchair propulsion, muscles generally contribute to
either push or recovery subtasks, with muscle co-contraction
occurring during the transitions. The shoulder muscles (PECM,
INFSP) appear to be particularly susceptible to fatigue and injury
due to their dual roles of handrim power generation and
gleno-humeral joint stability; therefore, strength training focused on
these muscles may improve rehabilitation outcomes. However,
care should be taken to maintain muscle balance to avoid the
development of additional musculoskeletal injuries. During the
transition, elevated shoulder activity will create additional
demand for glenohumeral joint stability, which may contribute
to the shoulder pain and injuries experienced by wheelchair
users. Thus, the transition region may also be an important focus
area when developing rehabilitation and propulsion techniques
aimed at reducing shoulder injuries. The modeling and simulation
framework used in this study provided insight into how
indivi-dual muscles contribute to the mechanical energetics of
wheel-chair propulsion and should prove useful in future studies
that seek to understand how these contributions change when
specific muscles lose their ability to generate force due to lack of
neural drive (e.g., from spinal cord injuries) or muscle weakness
(e.g., due to aging effects).
Conflict of interest statement
None declared.
Acknowledgments
The authors would like to thank Andrew Kwarciak and
Liyun Guo, who collected and processed the experimental
data used in this study, as well as the anonymous reviewers for
their valuable comments. This work was supported by NIH Grant
R01 HD053732.
References
Boninger, M.L., Souza, A.L., Cooper, R.A., Fitzgerald, S.G., Koontz, A.M., Fay, B.T., 2002. Propulsion patterns and pushrim biomechanics in manual wheelchair propulsion. Archives of Physical Medicine and Rehabilitation 83 (5), 718–723. Bregman, D.J., Drongelen, S.V., Veeger, H.E., 2009. Is effective force application in handrim wheelchair propulsion also efficient? Clinical Biomechanics 24 (1), 13–19.
Curtis, K.A., Drysdale, G.A., Lanza, R.D., Kolber, M., Vitolo, R.S., West, R., 1999. Shoulder pain in wheelchair users with tetraplegia and paraplegia. Archives of Physical Medicine and Rehabilitation 80 (4), 453–457.
Dallmeijer, A.J., van der Woude, L.H., Veeger, H.E., Hollander, A.P., 1998. Effective-ness of force application in manual wheelchair propulsion in persons with spinal cord injuries. American Journal of Physical Medicine and Rehabilitation 77 (3), 213–221.
de Groot, J.H., Brand, R., 2001. A three-dimensional regression model of the shoulder rhythm. Clinical Biomechanics 16 (9), 735–743.
de Groot, S., de Bruin, M., Noomen, S.P., van der Woude, L.H., 2008. Mechanical efficiency and propulsion technique after 7 weeks of low-intensity wheelchair training. Clinical Biomechanics.
de Groot, S., Veeger, H.E., Hollander, A.P., van der Woude, L.H., 2002. Consequence of feedback-based learning of an effective hand rim wheelchair force produc-tion on mechanical efficiency. Clinical Biomechanics 17 (3), 219–226. Dubowsky, S.R., Sisto, S.A., Langrana, N.A., 2009. Comparison of kinematics,
kinetics, and EMG throughout wheelchair propulsion in able-bodied and persons with paraplegia: an integrative approach. Journal of Biomechanical Engineering 131 (2), 021015.
Finley, M.A., Rodgers, M.M., 2004. Prevalence and identification of shoulder pathology in athletic and nonathletic wheelchair users with shoulder pain: a pilot study. Journal of Rehabilitation Research and Development 41 (3B), 395–402.
Fregly, B.J., Zajac, F.E., 1996. A state-space analysis of mechanical energy genera-tion, absorpgenera-tion, and transfer during pedaling. Journal of Biomechanics 29 (1), 81–90.
Gellman, H., Sie, I., Waters, R.L., 1988. Late complications of the weight-bearing upper extremity in the paraplegic patient. Clinical Orthopaedics and Related Research 233, 132–135.
Goffe, W.L., Ferrier, G.D., Rogers, J., 1994. Global optimization of statistical functions with simulated annealing. Journal of Econometrics 60, 65–99. Goosey-Tolfrey, V.L., Kirk, J.H., 2003. Effect of push frequency and strategy
variations on economy and perceived exertion during wheelchair propulsion. European Journal of Applied Physiology 90 (1–2), 154–158.
Guo, L.Y., Su, F.C., An, K.N., 2006. Effect of handrim diameter on manual wheelchair propulsion: mechanical energy and power flow analysis. Clinical Biomechanics 21 (2), 107–115.
Guo, L.Y., Su, F.C., Wu, H.W., An, K.N., 2003. Mechanical energy and power flow of the upper extremity in manual wheelchair propulsion. Clinical Biomechanics 18 (2), 106–114.
Gutierrez, D.D., Mulroy, S.J., Newsam, C.J., Gronley, J.K., Perry, J., 2005. Effect of fore-aft seat position on shoulder demands during wheelchair propulsion: part 2. An electromyographic analysis. The Journal of Spinal Cord Medicine 28 (3), 222–229.
Happee, R., Van der Helm, F.C., 1995. The control of shoulder muscles during goal directed movements, an inverse dynamic analysis. Journal of Biomechanics 28 (10), 1179–1191.
Holzbaur, K.R., Murray, W.M., Delp, S.L., 2005. A model of the upper extremity for simulating musculoskeletal surgery and analyzing neuromuscular control. Annals of Biomedical Engineering 33 (6), 829–840.
Hurd, W.J., Morrow, M.M., Kaufman, K.R., An, K.N., 2008. Biomechanic evaluation of upper-extremity symmetry during manual wheelchair propulsion over varied terrain. Archives of Physical Medicine and Rehabilitation 89 (10), 1996–2002.
Koontz, A.M., Cooper, R.A., Boninger, M.L., Souza, A.L., Fay, B.T., 2002. Shoulder kinematics and kinetics during two speeds of wheelchair propulsion. Journal of Rehabilitation Research and Development 39 (6), 635–649.
Kulig, K., Rao, S.S., Mulroy, S.J., Newsam, C.J., Gronley, J.K., Bontrager, E.L., Perry, J., 1998. Shoulder joint kinetics during the push phase of wheelchair propulsion. Clinical Orthopaedics and Related Research 354, 132–143.
Kwarciak, A.M., Sisto, S.A., Yarossi, M., Price, R., Komaroff, E., Boninger, M.L., 2009. Redefining the manual wheelchair stroke cycle: identification and impact of nonpropulsive pushrim contact. Archives of Physical Medicine and Rehabilita-tion 90 (1), 20–26.
Kwarciak, A.M., Turner, J.T., Guo, L. and Richter, W.M. Comparing handrim biomechanics for treadmill and overground wheelchair propulsion. Spinal Cord, in press, doi:10.1038/sc.2010.149.
Lenton, J.P., van der Woude, L., Fowler, N., Goosey-Tolfrey, V., 2009. Effects of arm frequency during synchronous and asynchronous wheelchair propulsion on efficiency. International Journal of Sports Medicine 30 (4), 233–239. Lin, H.T., Su, F.C., Wu, H.W., An, K.N., 2004. Muscle forces analysis in the shoulder
mechanism during wheelchair propulsion. Proceedings of the Institution of Mechanical Engineers Part H-Journal of Engineering in Medicine 218 (H4), 213–221.
Mercer, J.L., Boninger, M., Koontz, A., Ren, D., Dyson-Hudson, T., Cooper, R., 2006. Shoulder joint kinetics and pathology in manual wheelchair users. Clinical Biomechanics 21 (8), 781–789.
Morrow, M.M., Hurd, W.J., Kaufman, K.R., An, K.N., 2010. Shoulder demands in manual wheelchair users across a spectrum of activities. Journal of Electro-myography and Kinesiology 20 (1), 61–67.
Mulroy, S.J., Farrokhi, S., Newsam, C.J., Perry, J., 2004. Effects of spinal cord injury level on the activity of shoulder muscles during wheelchair propulsion: an electromyographic study. Archives of Physical Medicine and Rehabilitation 85 (6), 925–934.
Mulroy, S.J., Gronley, J.K., Newsam, C.J., Perry, J., 1996. Electromyographic activity of shoulder muscles during wheelchair propulsion by paraplegic persons. Archives of Physical Medicine and Rehabilitation 77 (2), 187–193.
Neptune, R.R., Kautz, S.A., Zajac, F.E., 2000. Muscle contributions to specific biomechanical functions do not change in forward versus backward pedaling. Journal of Biomechanics 33 (2), 155–164.
Neptune, R.R., Kautz, S.A., Zajac, F.E., 2001. Contributions of the individual ankle plantar flexors to support, forward progression and swing initiation during walking. Journal of Biomechanics 34 (11), 1387–1398.
Price, R., Ashwell, Z.R., Chang, M.W., Boninger, M.L., Koontz, A.M., Sisto, S.A., 2007. Upper-limb joint power and its distribution in spinal cord injured wheelchair users: steady-state self-selected speed versus maximal acceleration trials. Archives of Physical Medicine and Rehabilitation 88 (4), 456–463.
Raasch, C.C., Zajac, F.E., Ma, B., Levine, W.S., 1997. Muscle coordination of maximum-speed pedaling. Journal of Biomechanics 30 (6), 595–602. Rankin, J.W., Kwarciak, A.M., Richter, W.M., Neptune, R.R., 2010. The influence of
altering push force effectiveness on upper extremity demand during wheel-chair propulsion. Journal of Biomechanics 43 (14), 2771–2779.
Richter, W.M., 2001. The effect of seat position on manual wheelchair propulsion biomechanics: a quasi-static model-based approach. Medical Engineering and Physics 23 (10), 707–712.
Robertson, R.N., Boninger, M.L., Cooper, R.A., Shimada, S.D., 1996. Pushrim forces and joint kinetics during wheelchair propulsion. Archives of Physical Medicine and Rehabilitation 77 (9), 856–864.
Rodgers, M.M., McQuade, K.J., Rasch, E.K., Keyser, R.E., Finley, M.A., 2003. Upper-limb fatigue-related joint power shifts in experienced wheelchair users and nonwheelchair users. Journal of Rehabilitation Research and Development 40 (1), 27–37.
Sabick, M.B., Kotajarvi, B.R., An, K.N., 2004. A new method to quantify demand on the upper extremity during manual wheelchair propulsion. Archives of Physical Medicine and Rehabilitation 85 (7), 1151–1159.
Sie, I.H., Waters, R.L., Adkins, R.H., Gellman, H., 1992. Upper extremity pain in the postrehabilitation spinal cord injured patient. Archives of Physical Medicine and Rehabilitation 73, 44–48.
Tries, J., 1989. EMG feedback for the treatment of upper-extremity dysfunction: can it be effective? Biofeedback and Self-Regulation 14 (1), 21–53.
Veeger, H.E., Rozendaal, L.A., van der Helm, F.C., 2002. Load on the shoulder in low intensity wheelchair propulsion. Clinical Biomechanics 17 (3), 211–218. Veeger, H.E.J., Vanderwoude, L.H.V., Rozendal, R.H., 1991. Load on the upper
extremity in manual wheelchair propulsion. Journal of Electromyography and Kinesiology 1 (4), 270–280.
Winters, J.M., Stark, L., 1988. Estimated mechanical properties of synergistic muscles involved in movements of a variety of human joints. Journal of Biomechanics 21 (12), 1027–1041.
Wu, G., van der Helm, F.C., Veeger, H.E., Makhsous, M., Van Roy, P., Anglin, C., Nagels, J., Karduna, A.R., McQuade, K., Wang, X., Werner, F.W., Buchholz, B., 2005. ISB recommendation on definitions of joint coordinate systems of various joints for the reporting of human joint motion—Part II: Shoulder, elbow, wrist and hand. Journal of Biomechanics 38 (5), 981–992.