Introduction
Knowledge of genetic variation and genetic relationship among genotypes is an important consideration for classification, utilization of germplasm resources and breeding. Without determining the diversity reliably, it would not be possible to identify molecular markers or qualitative trait associations. Moreover the viability and purity of rootstocks can be analyzed through the utilization of fingerprints based on molecular markers. This process can increase both quantity and quality of fruit production.
Citrus is an economically important fruit crop, ranking almost as high as apples in world production and trade. The phylogeny and taxonomy of citrus fruit are complex, confusing and controversial due to the genetic heterogeneity of the genus, as well as its polyembryonic nature and the long generation time needed to carry out selection and recombination (Swingle, 1946; Nicolosi et al., 2000). Therefore, analysis of the genetic diversity of citrus fruit is crucial. To this end, DNA markers are being widely used in studying polymorphism between species or in populations. The application largely depends on the
Research Article
doi:10.3906/tar-0804-27Molecular characterization and genetic diversity analysis of
citrus cultivars by RAPD markers
M.N.R. BAIG1, Sapna GREWAL2, Santosh DHILLON3,*
1National Key Laboratory of Crop Genetic Improvement, Huazhong Agricultural University,
Wuhan, 430070, P. R. CHINA
2National Research Center on Plant Biotechnology, Indian Agricultural Research Institute, 110012, New Delhi, INDIA 3Department of Molecular Biology and Biotechnology, Department of Biochemistry
CCS Haryana Agricultural University, Hisar, Haryana 125004, INDIA
Received: 25.04.2008
Abstract:Random Amplified Polymorphic DNA (RAPD) markers were used to evaluate genetic similarity and inter-relationship among 18 citrus cultivars, including 13 species and 5 hybrids. Out of 40 decamer primers screened, 25 were selected which produced 250 markers; of which 231 were polymorphic and some species or cultivar specific RAPD markers. The Jaccard coefficient was used to calculate the genetic similarity. UPGMA was used to generate the dendrogram which clearly separated Jatti-Khatti from all major clusters at a similarity coefficient of 0.61. The average genetic similarity value observed across all the genotypes was 0.63, with the 2 sweet orange cultivars, Jaffa and Blood red, showing maximum similarity (82%). The Jatti-Khatti and King Mandarin were found to be genetically most diverse. The genetic variation between cultivars was quite high and revealed their different origins.
Key words:Citrus, RAPD, UPGMA, Dendrogram, Genetic diversity, PCR
type of markers employed, distribution of markers in the genome, type of loci they amplify, level of polymorphism and reproducibility of products (Virk et al., 2001; Fernandez et al., 2002). Techniques using Random Amplified Polymorphic DNA (RAPD) markers are simple, fast, and sensitive. They require no prior knowledge of the DNA sequence and can amplify a large number of DNA fragments for reaction. The introduction of DNA markers based on the polymerase chain reaction (PCR) technology has led to the development of several novel genetic assays that can be used for many purposes in plant genetic analysis such as cultivar identification and gene mapping. RAPD markers that result from the PCR amplification of genomic DNA fragments using short oligonucleotide (usually 10-mers) of arbitrary sequence as primers (William et al., 1990) provide a fast and easy approach for taxonomic classification and cultivar-typing of fruit trees. This assay has the advantage of being readily employed, requiring very small amounts of genomic DNA, and eliminating the need for blotting and radio-active detection (Cipriani et al., 1996). For these reasons many fruit tree crops have been successfully fingerprinted using RAPD markers, e.g. grape (Huseyin and Sabitagaoglu, 2008), strawberry (Sugimoto et al., 2005), olive (Sanz-Cortes et al., 2001) and pineapple (Sripaoraya et al., 2001). This technique, regardless of its sensitivity to reaction conditions, problems with repeatability, and amplifying of non-homologous sequences, has been successfully used for the assessment of genetic diversity in plants (Maria et al., 2008). Factors such as speed, efficiency and amenability to automation make it one of the most suitable methods for germplasm management with respect to estimating diversity, monitoring genetic erosion and removing duplicates from germplasm collections (Khadari et al., 2003).
In citrus, RAPD markers have been used for genetic diversity analysis (Abkenar and Ishhiki, 2003; Mariniello et al., 2004; Campos et al., 2005; Novelli et al., 2006; Shaaban et al., 2006; Shahsavar et al., 2007; Hvarleva et al., 2008), chimeras (Sugawara et al., 2002) and phylogenetic analysis (Nicolosi et al., 2000). DNA fingerprinting using PCR-based markers is very important for breeding and taxonomy of citrus. No DNA-based markers approach to the study of citrus
has been attempted even with a large area under cultivation in India. In this study we used RAPD markers to characterize the citrus genotypes. The objectives of the study were to achieve a better understanding of genetic variation and to investigate their inter-relationship.
Materials and methods Plant material
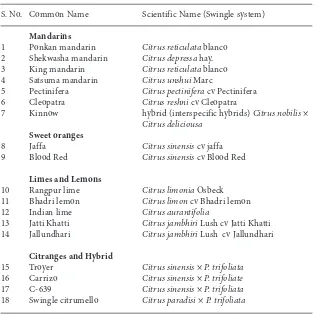
A total of 18 citrus genotypes (Table 1) used in this study were collected from the citrus orchard of Chaudhary Charan Singh Haryana Agricultural University, Hisar, Haryana, India.
DNA isolation
Total genomic DNA was isolated from fully expanded leaves using the CTAB (hexadecyltrimethylammonium-bromide) method (Murray and Thompson, 1980) with few modifications. Briefly, 2 g of leaves were ground in liquid nitrogen to a fine powder. The powder was added to 6 mL of extraction buffer (100 mM Tris–HCl pH 8.0, 20 mM EDTA, 1.4 M NaCl, 2% (wv-1) CTAB, 2–mercaptoethanol 2% and 1% (wv-1) PVP and incubated at 65 °C for 30 min. The DNA was extracted with chloroform – octanol (24: 1). The DNA was washed with 70% ethanol and dissolved in 100-400 μL of TE (10 mM Tris–HCl pH 8.0, 1 mM EDTA and 0.2 mg mL-1 RNase). The DNA concentration was determined spectrophotometrically at 260 nm. Stock DNA samples were stored at –20 °C and diluted to 20 ng uL-1when in use.
PCR procedure
The RAPD primers were purchased from Operon Technologies Alameda, CA, USA. A total of 40 decamer oligonucleotides of arbitrary sequence were tested for PCR amplification. The basic protocol reported by William et al. (1990) for PCR was performed in a total volume of 12.5 μL, containing 25 ng of template DNA, 0.4 μM of single primer, 0.6 U Taq DNA polymerase (Bangalore Genei, India), 0.20 μM of each dNTP, 1.5 mM MgCl2, 10 mM Tris–HCl, and 50 mM KCl.
an initial denaturation cycle of 1 min and 30 s at 94 °C was followed by 45 cycles comprising 1 min at 94 °C, 1 min at 36 °C and 2 min at 72 °C. An additional cycle of 7 min at 72 °C was used for final extension. Amplification products were separated by electrophoresis (8.3 V cm-1) in 1.5% agarose gels and stained in ethidium bromide. A photographic record was taken under UV illumination.
Data analysis
Only clear and repeatable amplification products were scored as 1 for present bands and 0 for absent ones. The specific bands useful for identifying species and cultivars were named with a primer number followed by the approximate size of the amplified fragment in base pairs. Polymorphism was calculated based on the presence or absence of bands. The 0 or 1 data matrix was created and used to calculate the genetic distance and similarity using ‘Simqual’, a sub-program of the NTSYS-PC sub-program (numerical taxonomy and multivariate analysis system program)
(Rohlf, 1993). The dendrogram was constructed by using a distance matrix using the unweighed pair-group method with arithmetic average (UPGMA) sub-program of NTSYS-PC.
Results
Genetic polymorphism among citrus cultivars
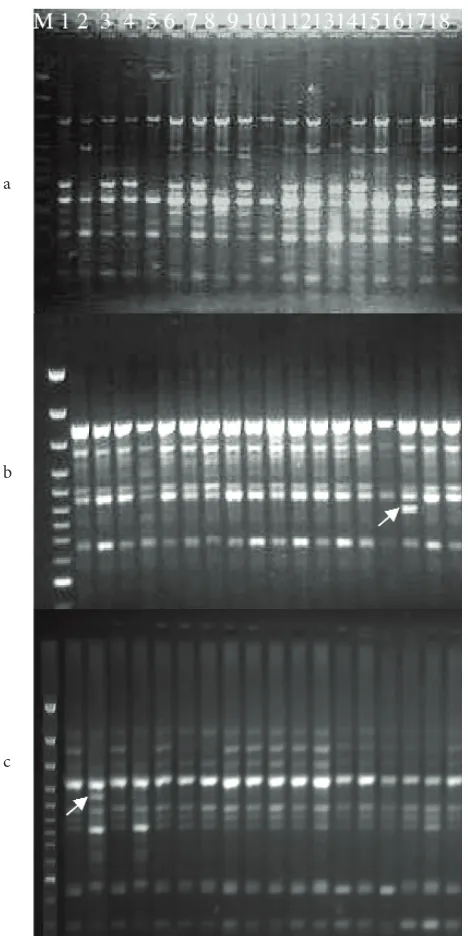
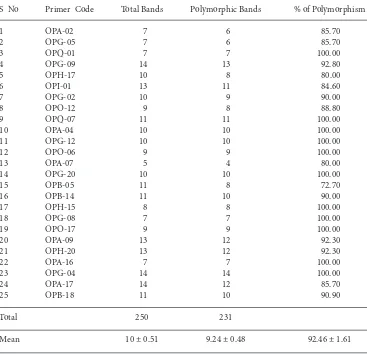
After screening 40 primers, 25 primers produced polymorphic and repeatable products. The banding profile and polymorphism generated using one of the primers OPH-17 (Figure 1a) are shown. PCR amplification of the DNA isolated from 18 selected citrus cultivars yielded a total of 250 amplified products, of which 231 were polymorphic and 19 were monomorphic (Table 2). The total number of amplified DNA bands varied between 5 (primer OPA-07) and 14 (primer OPA-17 and OPG-09) with the average of 10 ± 0.51 bands per primer. The maximum number of polymorphic bands (13) was obtained with Table 1. List of plant material used in this experiment.
S. No. Common Name Scientific Name (Swingle system)
Mandarins
1 Ponkan mandarin Citrus reticulatablanco
2 Shekwasha mandarin Citrus depressa hay.
3 King mandarin Citrus reticulatablanco
4 Satsuma mandarin Citrus unshui Marc
5 Pectinifera Citrus pectiniferacv Pectinifera
6 Cleopatra Citrus reshnicv Cleopatra
7 Kinnow hybrid (interspecific hybrids) Citrus nobilis×
Citrus deliciousa Sweet oranges
8 Jaffa Citrus sinensiscv jaffa
9 Blood Red Citrus sinensiscv Blood Red
Limes and Lemons
10 Rangpur lime Citrus limoniaOsbeck
11 Bhadri lemon Citrus limoncv Bhadri lemon
12 Indian lime Citrus aurantifolia
13 Jatti Khatti Citrus jambhiriLush cv Jatti Khatti 14 Jallundhari Citrus jambhiriLush cv Jallundhari
Citranges and Hybrid
15 Troyer Citrus sinensis×P. trifoliata
16 Carrizo Citrus sinensis× P. trifoliate
17 C-639 Citrus sinensis ×P. trifoliata
primer OPG-09 and the minimum number (4) was obtained with primer OPA-07. The polymorphism percentage ranged from 72.7% (primer OPB-05) to as high as 100% for 11 primers (OPQ-01, OPQ-07, OPA-04, OPG-12, OPG-06, OPG-20, OPH-15, OPG-08, OPA-17, OPA-16 and OPG-04). Average polymorphism across all the 18 citrus cultivars was found to be 92.4%. A significant co-relation (0.945, P < 0.01) was observed between the total number of bands and the number of polymorphic bands amplified by the 25 primer pairs. Overall size of the PCR amplified product bands ranged from 280 bp to 2800 bp. Polymorphism analysis was done for 7 mandarin cultivars and RAPD amplification within these genotypes resulted in the total of 208 amplified products of which 67 were monomorphic and 141 were polymorphic. Primer OPG–12 generated the maximum number (10) of polymorphic alleles while primer OPA–02 produced the minimum number (1) of polymorphic alleles among these mandarin genotypes. On average, 5.5 polymorphic bands were produced per primer. The highest level of polymorphism (100%) was detected by primers OPG-12 and OPG-08, whereas primer OPA-02 detected the lowest level of polymorphism (33.3%) among mandarins.
A total of 112 amplified products were obtained with DNA amplified from Jaffa and Blood Red. Out of these, 71 were monomorphic and only 41 were polymorphic. Primer OPG-04 generated the maximum number of polymorphic bands and showed no polymorphism between these 2 genotypes. Two primers OPG-01 and OPO-17 failed to amplify the DNA. Polymorphism analysis was done for 5 genotypes belonging to the lime and lemon group (Rangpur lime, Bhadri lemon, Indian lime, Jatti Khatti and Jallundhari), resulting in a total of 190 amplified products, of which 52 were monomorphic and 138 were polymorphic. Primer OPG-09 generated the maximum number of polymorphic alleles (9) and primer OPA-09 and OPQ-01 produced the minimum number of polymorphic alleles (2) among lemon genotypes. The highest level of polymorphism was detected with primer OPG-12 (100%) whereas primer OPA-09 detected the least polymorphism (25%).
A total of 189 amplified products were obtained with DNA amplified from 4 citrange genotypes a
b
c
(Troyer, Citrumello, C-639 and Carrizo) and Swingle Citrumello. Out of these, 136 were polymorphic and 53 were monomorphic. Primer OPH-20 generated the maximum number of polymorphic bands (11) whereas each of the primers OPA-02, OPQ-01, OPG-09, OPG-02, OPG-12, OPO-06, OPA-07, OPG-20, OPH-15, OPG-08, OPH-20 and OPA-16 generated only one monomorphic band. Primer OPQ-07 generated 100% polymorphism.
Primers capable of differentiating genotypes
After analyzing all the data, 5 primers OPA-09, OPQ-01, OPG-09, OPB-05 and OPG-08 were found useful in differentiating between mandarin and sweet oranges. It was observed that 2 primers, OPA-09 and OPG-08 gave 2 unique alleles for mandarins which
were absent in sweet oranges. Primer OPQ-01 and OPB-05 amplified 1 allele unique to mandarins. Primer OPA-09 generated 1 specific allele for sweet oranges which was absent in mandarins. These primers thus were able to distinguish between mandarin and sweet orange genotypes. Each of the primers OPB-05, OPB-18 and OPB-14 generated 1 allele unique to mandarins, which was absent in lime and lemon genotypes. Primer OPA-17 generated a specific allele which was present in lime and lemon and absent in mandarin. Thus these 4 primers were able to differentiate between citrus types. Primer OPI-01 resulted in the amplification of 1 allele for citranges which was absent in mandarins. Two primers, OPA-09 and OPO-06, gave 1 allele each for mandarin whereas primer OPG-05 amplified 2 alleles, one Table 2. DNA bands amplified and polymorphism generated in 18 citrus genotypes using 25 RAPD
markers.
S No Primer Code Total Bands Polymorphic Bands % of Polymorphism
1 OPA-02 7 6 85.70
2 OPG-05 7 6 85.70
3 OPQ-01 7 7 100.00
4 OPG-09 14 13 92.80
5 OPH-17 10 8 80.00
6 OPI-01 13 11 84.60
7 OPG-02 10 9 90.00
8 OPO-12 9 8 88.80
9 OPQ-07 11 11 100.00
10 OPA-04 10 10 100.00
11 OPG-12 10 10 100.00
12 OPO-06 9 9 100.00
13 OPA-07 5 4 80.00
14 OPG-20 10 10 100.00
15 OPB-05 11 8 72.70
16 OPB-14 11 10 90.00
17 OPH-15 8 8 100.00
18 OPG-08 7 7 100.00
19 OPO-17 9 9 100.00
20 OPA-09 13 12 92.30
21 OPH-20 13 12 92.30
22 OPA-16 7 7 100.00
23 OPG-04 14 14 100.00
24 OPA-17 14 12 85.70
25 OPB-18 11 10 90.90
Total 250 231
unique to citranges and other to mandarins. Thus these primers were found to differentiate between mandarins and citranges. Five primers were found to be useful for distinguishing sweet oranges from lemons. Each of the primers OPB-14, OPI-01, OPG-12 and OPQ-07 generated 1 specific allele which was present in sweet oranges and absent in lemons. Each of the primers OPQ-07 and OPO-06 gave 1 specific allele which was absent in sweet oranges and present in lemons. Therefore, these primers were able to distinguish between sweet oranges and lemons. Four primers OPB-14, OPB-05, OPA-17 and OPA-04 were found to distinguish between citranges and sweet oranges. Three alleles, each generated by primers OPB-14, OPA-17 and OPA-04 were present in sweet orange and absent in any genotypes belonging to citranges, while primer OPB-05 amplified one allele present in citranges only. Primer OPG-20 generated a unique allele for Troyer; Primer OPA-17 generated a unique allele for C-639, whereas primer OPG-09 generated it for kinnow. Primers OPO-17 and OPB-14 gave 2 and 3 specific bands respectively for Jatti Khatti which were absent in citranges, while primer OPB-05 gave 1 allele specific for citranges which was absent in sweet oranges. After analyzing the data generated by 25 primers, it was concluded that 7 primers differentiated citranges from lemon. Primer OPO-17 generated 3 specific alleles which were present in citranges and absent in lemon. Each of the primers OPH-20, OPG-04, OPA-09 and OPI-01 generated 1 specific allele for citranges, which was absent in lemon. Primer OPB-14 generated 2 alleles which were presents in lemon but absent in citranges as well as Swingle citrumello.
Unique bands in 18 citrus genotypes
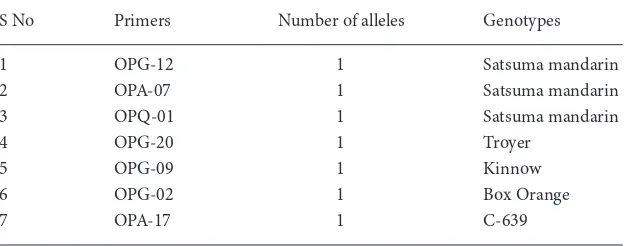
Some primers gave unique bands in a specific citrus genotype as shown in (Table 3). These primers produced a specific DNA band which distinguished one genotype from the rest. Primer OPA-17 generated a unique allele for C-639 (Figure 1b). Primers OPG-12, OPA-07 and OPQ-01 generated a unique band for the Satsuma mandarin (Figure 1c). Primer OPG-20 generated a unique allele for Troyer, whereas primer OPG-09 gave it for kinnow. Primer OPO-17 and OPB-14 generated respectively 2 and 3 specific bands for Jatti Khatti.
Genetic relationship between citrus genotypes
Data of RAPD markers scanned from the 18 genotypes with 25 reproducible primers was used to generate similarity coefficients. A maximum similarity value of 0.82 was observed between 2 cultivars of sweet orange Jaffa and Blood Red, whereas Jatti Khatti and King Mandarin were found to be genetically most diverse (0.44). Average similarity value observed across all genotypes was 0.63. The 2 lemon genotypes followed by the Jatti Khatti were diverse having similarity value of 0.50. Troyer, a Citrange showed its similarity with Cleopatra (0.72) a genotype of mandarin group. Rangpur lime showed closeness with the sweet orange having similarity value of 0.74.
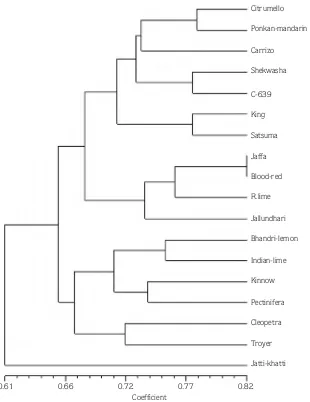
The cluster tree analysis (Figure 2) showed that the citrus genotypes were broadly divided into 3 main groups representing mandarins, sweet oranges and lemon. However, Jatti Khatti was found to be quite divergent and did not fall in any of the major clusters. It separated from the above groups at a similarity coefficient of 0.61; 3 groups were further divided into
Table 3. List of RAPD primers producing unique alleles for specific citrus genotype.
S No Primers Number of alleles Genotypes
1 OPG-12 1 Satsuma mandarin
2 OPA-07 1 Satsuma mandarin
3 OPQ-01 1 Satsuma mandarin
4 OPG-20 1 Troyer
5 OPG-09 1 Kinnow
6 OPG-02 1 Box Orange
various sub-groups according to similarity between them. Three main groups branched at similarity value of 0.65 into 2 major clusters. First major cluster consisted of 2 sub-clusters, in which a high genetic similarity was observed between Citrumello and Ponkan mandarin (78%). Carrizo merged into this sub-group at different similarity coefficient value of 0.73. Shekwasha mandarin and C-639 had similarity coefficient of 0.78 which merged with the above cluster at similarity value of 0.72. Two mandarin genotypes Ponkan mandarin and Satsuma mandarin showed 77% closeness and merged with the above major sub-group at similarity coefficient of 0.71. Jaffa and Blood Red, 2 sweet orange cultivars showed
maximum similarity (0.82), Rangpur lime merged with these at a similarity coefficient of 0.75. Jallundhari entered the above sub-group at similarity value of 0.71.The second major cluster consisted of 2 sub-groups. Two genotypes namely, Bhadri lemon and Indian lime which were close to each other and showed similarity coefficient of 0.76 represented one subgroup the other subgroup included Kinnow and Pectinifera, 2 genotypes of mandarin which showed similarity coefficient of 0.73 and merged with Bhadri lemon sub-group at similarity value of 0.71. Cleopatra and Troyer showed similarity coefficient of 0.72 and merged with the above main sub-cluster at similarity coefficient of 0.67.
0.61 0.66 0.72 0.77 0.82
Citrumello
Ponkan-mandarin
Carrizo
Shekwasha
C-639
King
Satsuma
Jaffa
Blood-red
R.lime
Jallundhari
Bhandri-lemon
Indian-lime
Kinnow
Pectinifera
Cleopetra
Troyer
Jatti-khatti
Coefficient
Discussion
Experiments with Citrus cultivars have demonstrated the potential of RAPD markers as a rapid, reproducible and useful method for distinguishing among different cultivars and clustering genotypes in the Citrus species. A total of 250 amplified products were obtained using 25 RAPD primers which is quite consistent with that 212 RAPDs generated by using 23 primers reported by Coletta Filho et al. (1998) among 25 mandarin accessions. Average polymorphism across all 18 citrus genotypes was 86.35%. The high level of polymorphism obtained in this study indicates greater genetic diversity between the genotypes selected which includes genotypes that belong to 4 major categories- Mandarins, Sweet oranges, Limes and lemons and Citranges including 1 hybrid. A significant correlation (0.945, P < 0.01) was obtained between the total number of bands and number of polymorphic bands amplified by 25 RAPD primers. The RAPD amplification within 7 genotypes of mandarins resulted in 208 amplified products. Machado et al. (1996) obtained 111 amplification products using 21 random primers among 39 Mediterranean genotypes. Out of 208, 131 were polymorphic and 77 were monomorphic with polymorphic percentage 66.65%.
The number of DNA fragments amplified ranged from 5 to 14 depending upon the primer and the DNA sample, which is quite consistent with 3-15 amplified fragments, reported by Nicolosi et al. (2000) among 36 accessions belonging to Pummelo, Citron and mandarin genotypes. High similarity coefficient value of 0.82 was found between two cultivars of sweet oranges, similar to the result obtained by previous studies (0.82-0.88) done by Gulsen and Roose (2001), among 95 citrus accessions and for ISSR, SSR and isozymes analysis. Nine of 25 primers used were not able to differentiate and gave monomorphic bands. The high similarity (0.82) between the 2 cultivars of sweet oranges is probably due to their common origin by mutation (Elisiario et al., 1999).
The polymorphic RAPD markers present only in 1 genotype were considered as unique allele for that genotype. Primer OPG-12, OPA-07, OPQ-01 gave one unique allele each for Satsuma mandarin. Nicolosi et
al. (2000) also found few unique fragments for C. indica (7) and C. succosa (1) of mandarin group.
Twenty-five primers produced 219 alleles among 5 genotypes of lime and lemon group, of which 138 were polymorphic. Between 4 and 10 clear and repeatable bands were obtained for each of these primers, which is similar to the results (1 to 9 alleles) obtained by Abkenar and Isshiki (2003) in 31 acid citrus species and cultivars. A search for unique bands was made for all the species tested and it was found that primers OPO-17 and OPB-14 gave 2 and 3 unique bands respectively for Jatti-Khatti genotype. Nicolosi et al. (2000) also reported 2 unique bands in C. limonia and 1 unique band in C. aurantium in a study on phylogeny and genetic origin of Citrus. Likewise, Abkenar and Isshiki (2003) also reported some unique RAPD fragments among acid citrus species and cultivars, primers A12, A18, A20, B08, B11, E01 gave 1 unique band for ‘Myrtle-leaf orange, primer A12 gave 1 unique band for ‘China daidai’.
In this study we confirmed that RAPD markers, as a fast and simple technique, can detect enough polymorphism to differentiate between citrus cultivars and to understand their inter-relationships, However, if a finer molecular analysis of Jatti Khatti
accessions is required, the use of other molecular marker techniques such as Amplification fragment length polymorphisms (AFLPs) (Campos et al., 2005) or inter-simple sequence repeat markers (ISSRs) (Shahsavar et al., 2007) should be considered.
Abkenar, A. and S. Isshiki. 2003. Molecular characterization and genetic diversity among Japanese acid citrus (Citrus spp.) based on RAPD markers. Journal of Horticultural Sciences and Biotechnology. 78: 553-556.
Campos, E.T., M.A.G. Espinosa, M.L. Warburton, A.S. Varela and A.V. Monter. 2005. Characterization of mandarin (Citrus spp.) using morphological and AFLP markers. Interciencia. 30: 687-693.
Cipriani, G., R. Di Bella and R. Testolin. 1996. Screening RAPD primers for molecular taxonomy and cultivar fingerprinting in the genus Actinidia. Euphytica. 90: 169-74.
Coletta Filho, H.D., M.A. Machado, M.L.P.N. Targon, M.C.P.Q.D.G. Moreira and J. Pompeu. 1998. Analysis of the genetic diversity among mandarins (citrus spp.) using RAPD markers. Euphytica. 102: 133-139.
Elisiario, P.J., E.M. Justo and J.M. Leitao. 1999. Identification of mandarin hybrids by isozyme and RAPD analysis. Scientia Horticutlurae, 81: 287-99.
Fang, D.R., R. Krueger and M.L. Roose. 1998. Phylogenetic relationships among selected citrus germplasm accessions revealed by inter-simple sequence repeat (ISSR) markers. Journal of the American Society for Horticultural Science. 123: 612-617.
Fernandez, M.E., A.M. Figueiras and C. Benito. 2002. The use of ISSR and RAPD markers for detecting DNA polymorphisms, genotype identification and genetic diversity among barley cultivars with known origin. Theoretical and Applied Genetics. 104: 845-851.
Gulsen, O. and M.L. Roose. 2001. Lemons diversity and relationship with selected citrus genotypes as measured with nuclear genome marker. Journal of the American Society for Horticultural Science.126: 309-317.
Huseyin, K and Y. Sabitagaoglu. 2008. Genetic diversity among Turkish local grape accessions (Vitis vinifera L.) using RAPD markers. Hereditas. 145: 58-63.
Hvarleva, T., T. Kapari-Isaia, I. Papayiannis, A. Atanassov, A. Hadjinicoli and A. Kyriakou.2008. Characterization of Citrus Cultivars and Clones in Cyprus through Microsatellite and RAPD Analysis. Biotechnology & Biotechnolological Equipment.22: 787-794.
Khadari, B., C. Breton, N. Moutier, J. P. Roger, G. Besnard, A. Bervillé and F. Dosba. 2003. The use of molecular markers for germplasm management in a French olive collection. Theoretical Applied Genetetics. 106: 521-529.
Machado, M. A., H. D. Coletta Filho., M.L.P.N. Targon and J. Pompeu Jr. 1996. Genetic relationship of Mediterranean mandarins (citrus deliciosa tenore) using RAPD markers. Euphytica. 92: 321-326.
Maria D., P. Angela and L. Chialexei. 2008. Characteristics of RAPD markers inbreeding of Cucumis sativus L. Roumanian Biotechnological Letters. 13: 3843-3850.
Mariniello. L., M.G. Sommella, A. Cozzolino, P. Di Pierro, D. Ercolini and R. Porta. 2004. Identification of Campania Citrus limon L. by Random Amplified Polymorphic DNA Markers. Food Biotechnology. 18: 289-297.
Murray, M.G. and W.F. Thompson, 1980. Rapid isolation of high molecular weight plant DNA. Nucleic Acid Research. 8: 4321-4325.
Nicolosi, E., Z.N. Deng, A.C.A. Gentile, S. Malfa, G. Continella and E. Tribulato. 2000. Citrus phylogeny and genetic origin of important species as investigated by molecular markers. Theoretical Applied Genetics.100: 1155-66.
Novelli, V.M., M. Cristofani, A.A. Souza, M.A. Machado.. 2006. Development and characterization of polymorphic microsatellite markers for the sweet orange (Citrus sinensis L. Osbeck). Genetics and Molecular Biology. 29: 90-96.
Rohlf, F.J. 1993. NTSYS-PC numerical taxonomy and multivariate analysis system Version 1-80. Exeter Software. Setauket. NY, USA.
Shaaban, E.A., S. KH. Abd-EL-Aal, N.S. Zaied and A.A. Rizkalla. 2006. Assessment of Genetic Variability on Some Orange Accessions Using RAPD-DNA Markers. Research Journal of Agriculture and Biological Sciences, 2: 564-570.
Sanz-Cortes, F., M.L. Badenes, S. Paz, A. Iniguez and G. Llacer. 2001. Molecular characterization of olive cultivars using RAPD markers. Journal of the American Society for Horticultural Science.126: 7-12.
Shahsavar A.R., K. Izadpanah,, E. Tafazoli and B.E. Sayed Tabatabaei. 2007. Characterization of citrus germplasm including unknown variants by inter-simple sequence repeat (ISSR) markers. Scientia Horticulturae. 112: 310-314.
Sripaoraya, S., N.W. Blackhall, R. Marchant, J.B. Power, K.C. Lowe and M.R. Davey. 2001. Relationships in pineapple by random amplified polymorphic DNA (RAPD) analysis. 120: 265-267. Sugawara, K., T. Wakizuka, A. Oowada, T. Moriguchi and M. Omura.
2002. Histogenic identification by RAPD analysis of leaves and fruit of newly synthesized chimeric Citrus. Journal of the American Society for Horticultural Science. 127: 104-107. Sugimoto T., K. Tamaki, J. Matsumoto, Y. Yamamoto, K. Shiwaku and
K. Watanbe. 2005. Detection of RAPD markers linked to the everbearing gene in Japanese cultivated strawberry. Plant Breeding. 124: 498-501.
Swingle, W.T. 1946. The botany of citrus and its wild relatives in the orange subfamily. In: Webber H.S. and D.L. Batchelor (Eds.). The Citrus Industry, Vol. 1, University of California, Berkeley, pp. 128-474.
Virk, P.S., J. Zhu, H.J. Newburg, G.J. Bryan, M.T. Jeckson and B.V. Ford-Lloyd. 2001. Effectiveness of different classes of molecular markers for classifying and revealing variation in rice germplasm. Euphytica. 112: 275-284.