MAPPING GLAUCONITE UNITES WITH USING REMOTE SENSING TECHNIQUES IN
NORTH EAST OF IRAN
R. Ahmadirouhani a, b *, S.Samiee b
a GSINET, Geomatic group, Geological Survey of Iran, North East Territory, Mashhad, Iran - [email protected] b Department of Geology, Ferdowsi University of Mashhad, Iran, [email protected]
KEY WORDS: Glauconite, NE of Iran, Koppeh-dagh Structure zone, Spectral Angel Mapper (SAM) classification, image processing techniques
ABSTRACT:
Glauconite is a greenish ferric-iron silicate mineral with micaceous structure, characteristically formed in shallow marine environments. Glauconite has been used as a pigmentation agent for oil paint, contaminants remover in environmental studies and a source of potassium in plant fertilizers, and other industries. Koppeh-dagh basin is extended in Iran, Afghanistan and Turkmenistan countries and Glauconite units exist in this basin. In this research for enhancing and mapping glauconitic units in Koppeh-dagh structural zone in north east of Iran, remote sensing techniques such as Spectral Angle Mapper classification (SAM), band ratio and band composition methods on SPOT, ASTER and Landsat data in 3 steps were applied.
* Corresponding author. R.Ahmadirouhani, Email: [email protected]
1.1 Introduction
Glauconite is a greenish ferric-iron silicate mineral with micaceous structure, The chemical formula of this mineral is:[(K,Na)(Fe3+,Al,Mg)2(Si, Al)4O10(ΟH)2], Glauconite characteristically is formed on submarine elevations ranging in depth from 30 to 1,000 metres below sea level. Glauconite is abundant only in sea-floor areas that are isolated from large supplies of land-derived sediment. It forms by three principal processes: alteration of the fecal pellets of bottom-dwelling organisms; modification of particles of illitic and biotitic clays by seawater; and direct precipitation from seawater. Particles of Glauconite are generally sand-sized or finer (Encyclopaedia Britannica, 2008).
Because of its potash and phosphate content, greensand was mined and marketed as a natural fertilizer and soil conditioner for more than 100 years (Spoljaric, 1994). In the early 1900s the Base Exchange properties of Glauconite were recognized for water treatment and the mineral gained acceptance as a water softener(Spoljaric,1994).By filtration through glauconitic greensands can remove contaminants from landfill leachates (Spoljaric,1974). Also this mineral has used as a pigmentation for paint industry and modern poetry.
Consider in economic and environmental cleaner importance of this mineral, Investigation of it is important in industrial development.
This research was done in 3 steps: 1- select suitable area with Landsat data; 2- detailed studies and SAM analysis with ASTER data and 3- processing multispectral SPOT image with 2.5 meter resolution for separating units with high anomaly of Glauconite.
In order to identify Glauconite in Koppeh-dagh range, four study areas include: 1- Abgram, 2- Sanganeh; 3- Hamam ghalee; and 4- Zavin were selected based on geology maps, field sampling and processing Landsat ETM+ images.
Because of the same results in the four study area, only the result of Abgarm area will be discussed here.
The results of this study should have considerable potential to evaluate the use of multispectral remote sensing for geological purposes (mapping Glauconite) in Koppeh-dagh.
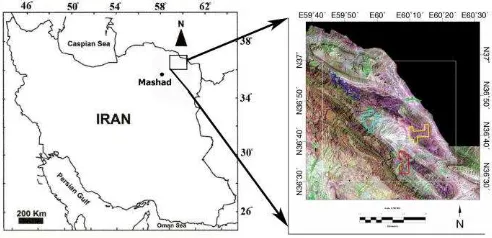
1.2 Geological setting
The investigated area is located in North east of Razavi Khorasan province, north east of Iran, in Koppeh-dagh region (FIG.1). The Koppeh-dagh zone elongate SE- NW direction and tectonic activity is low in this area. Therefore all formation in these area located conform that comprise Jurassic to Paleocene- Eocene age include Kashafrud, Chamanbid, Muzduran, Shurijeh, Tirgan, Sanganeh, Itamir, Ab- deraz, Ab-talkh, Kalat, Pesteh ligh, Chehel Kaman and Khangiran ( Afshar harb, 1995). The case study is located in 1:100.000 geological map of Chahchahe (FIG.2) and Glauconitic sandstone are more abundance in Neyzar and Itamier formations.
Since that abundance of Glauconite is not the same in all these formations, remote sensing techniques are used for determination of sections that are more abundant in Glauconite.
1.3 Remote sensing method
Remote sensing techniques are low-cost and short term method for reconnaissance minerals in widespread areas.
One of the key idea of remote sensing techniques in exploration geology is that it is applied to rocks, minerals, and structures associated with a particular ore, and not the ore itself. There are very logical reasons for this procedure (Vincent 1997).
Advancement in the interpretation and analysis of satellite images enable experts at mineral exploration to increasingly use image processing techniques for identifying, mapping and assessing the different types of mineral deposits.
ASTER and Landsat are two important commercial satellite that were launched to study by remote sensing different aspect of the earth surface, especially mineral resources (Abrams and Hook, 2000).
In this study, ASTER, Landsat and SPOT satellite images were used, and efficient method were being used for mineral mapping such as: Band ratio, Spectral Angle Mapper (SAM).
Processing satellite data in this research were done by ENVI 4.7version, ER Mapper7.01 version and Geomathica10
software’s.
Landsat ETM+ scene with p160r034_7p19990805_z40 ID was acquired on 05/08/1999, ASTER scene level -1b_080302_364.hdf that was acquired in 02/11/2001, and multi spectral SPOT-5 data with SPOTCOV_IRC_N36E060-A ID and dataset_production_date: 2007-10-16 were used. The result of the mineral mapping was checked on the ground to verify the result of image processing.
Figure 2. Location of the study area (red polygon) on Chahchahe geological map with 100.000 scale (geological survey of Iran 2010). Mapper (TM) sensor family that was flown on Landsat’s 4 and 5. The sensor improved with several evolutionary refinements
including the addition of a 15-m resolution panchromatic band and a higher resolution (60 m) thermal band (Markham et al. 2008). Lithological mapping using Landsat(TM) and remote sensing techniques like band ratio has been used increasingly by several authors (e.g. Abrams, 1983; Kaufmann, 1988; Abdelsalam and Stern, 1999;).
At the first stage of this research, Landsat, ETM+ data were applied, besides geological map and field information, color composition RGB: 371 (Fig. 3) was used and Glauconite units enhanced in green color. Band ratio transformation was also useful for qualitative detection of Glauconite. In the RGB: 5/7, -3/2, 3/1, the area in dark green to brown colors show Glauconitic area.
SAM method didn't have acceptable result for determining Glauconite. According to this fact that Glauconite is a hydroxyl mineral, and considering the spectral reflectance of Glauconite (see FIG.5), we need more range of VNIR and SWIR spectrum and bands, therefore ASTER data processing was used for determining this mineral by SAM method in the next step.
Figure 3. Landsat ETM+ color image RGB: 371, Glauconite units are in green color and check points are red.
1.4.2-ASTER image processing and SAM method
Since 2000, Advanced Spaceborne Thermal Emission and Reflection Radiometer (ASTER) multispectral data have been used in mineralogical and lithological studies (Ninomiya, 2002, 2004; Rowan et al., 2003; Rowan and Mars, 2003; Di Tommaso and Rubinstein, 2006).
SWIR color composition in RGB: 468 was used, Glauconite zones are shown in greenish blue color (FIG.4).
Also the Spectral Angel Mapper (SAM) technique (Kruse et al., 1993) was applied to enhancing Glauconitic mineral in study area.
The reference spectra were extracted from the United States Geological Survey (USGS) mineral spectral library (Fig.5), and were resampled to the same ASTER bands width. Similarities between image spectra and reference spectra were calculated. After selecting minimum threshold Small SAM indicates better similarities between pixel spectra and references, final results were showed by specification of threshold for Glauconite on band 1 of ASTER with 15 meter spatial resolution (Fig.6),
Figure 4. ASTER colour image RGB: 468, Glauconite units are in greenish blue color (check points are red).
Figure 5. Spectral Library Plot for Glauconite mineral (ENVI spectral library)
The results of Spectral angle mapper (SAM) classification method determined Glauconitic zones in Abgarm area (Fig.6), these zones are coincidence with the some parts of Glauconite units in geological map, and also some area that have Glauconite and not specified in the map, Field sampling confirm SAM processing information.
1.4.3- SPOT imagery processing
The SPOT system has been operational since 1986 when SPOT1 was launched. SPOT 2 was placed in orbit in January 1990, followed by SPOT 3 in September 1993, SPOT 4 in March 1998 and SPOT 5 in May 2002 (Table .1).System
continuity will be assured by the SPOT 6 (2013) and SPOT 7 (2014) constellation.
SPOT-5 satellite that was used in this research (table 1) offers greatly enhanced capabilities, which provide additional cost-effective imaging solutions. The coverage offered by SPOT-5 is a key asset for applications such as medium-scale mapping (at 1:25000 and 1:10,000 locally), urban and rural planning, oil and gas exploration, and natural disaster management.
SPOT-5's other key feature is the unprecedented acquisition capability of the on-board HRS stereo viewing instrument, which cover vast areas in a single can pass. Stereo satellite imagery is vital for applications that call for 3D terrain modelling and computer environments, such as flight simulator databases, pipeline corridors, and mobile phone network planning. 2.5-metre colour products are derived from images acquired by SPOT 5.
Figure 6. Spectral angle mapper (SAM) classification result for Glauconite mineral with checking point (red).
Table 1. SPOT satellites information (from spotimage.com)
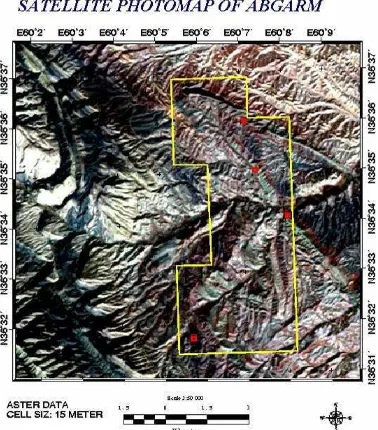
of studied area in 10.000 scale were prepared. This satellite photomap was used for Identifying potential areas for final sampling and final checking.
With this method and doing these 3 steps, actual locations of Glaconite were determined. results show Glauconite areas with the high accuracy.
CONCLUSION
Remote sensing techniques were done in study area for mapping the areas with highest purity of Glauconite mineral. Landsat images processing with areal geological map caused to primary identification of high anomaly areas that were conducted as a base for ASTER images processing. Glauconotic zones were distinguished by SAM classification method on ASTER data, then the raster data convert to vector format and overlapped on SPOT image, and actual locations of Glaconite mineral were known.
Figure7. SPOT image with Glauconite vectors that derived from SAM method on ASTER data
Acknowledgment
The authors would like to thank Geological survey of Iran (GSI) and Geological survey of Mashhad (GSINET) for cooperation in giving information and checking data.
REFERENCES
Abdelsalam M G, Stern R J and Berhane W G, 2000 Mapping gossans in arid regions with Landsat TM and SIR-C images: The Beddaho alteration zone in northern Eritrea; J. African Earth Sci. 30(4) 903–916
Abrams J. Michael, 1983. Remote Sensing for Porphyry Copper Deposits in Southern Arizona. Economic Geology vol. 78, pp. 591-604.
Abrams, A., Hook, S., 2000, ASTER users handbook, version 2, jet propulsion laboratory, 4800 oak grove Dr. Pasadena, C A 91109, bhaskar Ramachandran, EROS data center Sioux falls, SD 57198.
Afshar harb, A., 1995, Geology of Kopeh dagh, 275p.
Di Tommaso,I.M., Rubinstein,N., 2006, Hydrothermal alteration mapping using ASTER data in the Infiernillo porphyry deposit, Argentina, Journal of Ore Geology Reviews, volume 29, pp. 1-16.
Encyclopedia Britannica, 2008, Encyclopedia Britannica Online. Britannica.com
Fujisada, H., Iwasaki, A., Hara, S., 2001. ASTER stereo system Optical Engineering 4540, 39–49.
Haunt,G.R., 1997, Specteral signature particulate mineral in visible and near infrared, Geophysics, 42(3), p:501-513.
Hunt, G.L., Salisbury, J.W., 1970. Visible and near infrared spectra of minerals and rocks: I. Silicateminerals.Modern Geology 1, 283–300.
Kaufmann, H., 1988. Mineral Exploration along the Auaba-Levant Structure by Use of TM-data. Concepts, Processing and Results. Int. J. Remote Sensing, vol. 9, No. 10 and 11, 1639-1658.
Kruse, F. A., Lefkoff, A. B., Boardman, J. W., Heidebrecht, K. B., Shapiro, A. T., Barloon, P. J., Goetz, A. F. H., 1993. The Spectral Image Processing System (SIPS)- Interactive visualization and analysis of imaging spectromerer data. Remote Sensing of Environment: 44, 145–163.
Markham B L, Dabney P W, Storey J C, Morfitt R, Knight E J, Kvaran G and Lee K, 2008, Landsat Data Continuity Mission Calibration and Validation; ASPRS Publications, Colorado, USA.
Ninomiya, Y., 2004. Lithologic mapping with multispectral ASTER TIR and SWIR data. Proceedings of SPIE, the International Society for Optical Engineering 5234, 180–190.
Ninomiya, Y., Fu, B., Cudahy, T.J., 2005. Detecting lithology with radiance at the sensor data of ASTER multispectral TIR. Remote Sensing of Environment 99, 127–139.
Roshan ravan,J, 2010, Chahchahe geological map,geological survey of Iran.
Rowan, L.C., Hook, S.J., Abrams, M.J., Mars, J.C., 2003. Mapping hydrothermally altered rocks at Cuprite, Nevada using the Advanced Spaceborne Thermal Emissivity and Reflection.
Rowan, L.C., Mars, J.C., 2003. Lithologic mapping in the Mountain Pass, California area using Advanced Spaceborne Thermal Emissivity and Reflection Radiometer ASTER data. Remote Sensing of Environment 84, 350–366.
Rowan, L.C., Schmidt, R.G. and Mars, J.C., 2006. Distribution of hydrothermally altered rocks in the Reko Diq, Pakistan mineralized area based on spectral analysis of ASTER data. Remote sensing of Environment, 104(1), pp. 74-87.
Spoljaric, N., 1994. Glauconite. In Industrial minerals and Rocks (6th Edition) EdCarr, DD.
Spoljaric, N and Crawford, W A ,1979, Removal of contaminants from landfill leachates by filtration through glauconitic greensands. Environmental Geology, Vol 2, 359-363.