Hyperactivity Disorder: Event-Related Potentials
Identify the Processing Component and Timing of an
Impaired Right-Frontal Response-Inhibition Mechanism
Steven R. Pliszka, Mario Liotti, and Marty G. Woldorff
Background: A core deficit in inhibitory control may account for a wide range of dysfunctional behaviors in attention-deficit/hyperactivity disorder (ADHD).
Methods:Event-related potentials were measured in 10 children with ADHD and 10 healthy children during a task specifically involving response inhibition (Stop signal task).
Results:In response to all Stop signals, control partici-pants produced a large negative wave at 200 msec (N200) over right inferior frontal cortex, which was markedly reduced in ADHD children. The N200 amplitude was significantly correlated across subjects with response– inhibition performance. In response to the Go stimuli, ADHD children showed a reduced slow positive wave (250 –500 msec) in anticipation of failed inhibitions over right frontal scalp regions.
Conclusions:ADHD children appear to have an abnor-mality in an early-latency, right inferior frontal processing component critical to the initiation of normal response-inhibition operations. They also appear to have a right frontal abnormality associated to the covert processing of Go stimuli preceding failed inhibitions. By providing timing and processing component specificity, these results extend the findings of recent functional MRI studies of inhibitory control reporting right frontal abnormalities in ADHD. Biol Psychiatry 2000;48:238 –246 ©2000 So-ciety of Biological Psychiatry
Key Words: Event-related potentials, attention-deficit/ hyperactivity disorder, response inhibition, N200, stop signal task
Introduction
A
great deal of research over the last two decades has attempted to define a set of core cognitive deficits shared by individuals with attention-deficit/hyperactivity disorder (ADHD) (Barkley 1997; Douglas 1983). In the laboratory, children with ADHD often perform more poorly than do control subjects and children with other psychiatric disorders on tasks that specifically measure inhibitory control (Logan et al 1984; Schachar and Logan 1990; van der Meere et al 1989, 1992). In contrast, it has proved difficult to show any deficits in task performance attributable to impaired sustained or selective attention (Sergeant and van der Meere 1989). It may be the case that a core deficit in inhibitory control underlies the develop-ment of broader deficits in executive function, accounting for the wide range of dysfunctional behaviors in ADHD (Barkley 1997).Tasks that specifically measure inhibitory control would be expected to be associated with findings obtained with functional neuroimaging. A classic task involving re-sponse inhibition is the Go–NoGo paradigm, where sub-jects are instructed to respond to a certain category of stimuli but not respond to another. In one study, event-related potentials (ERPs) were recorded while ADHD children and control subjects performed the Continuous Performance Test (CPT). On the “A-not-X” (NoGo) trials, the ADHD group as a whole did not differ from the control group, although a subset of ADHD children with opposi-tional defiant disorder (ODD) had smaller amplitudes of a frontal N200 wave than did control children (Overtoom et al 1998). A functional magnetic resonance imaging (fMRI) study using the Go–NoGo paradigm in normal children and adults found that activity in orbitofrontal and anterior cingulate cortices correlated with the number of false alarms committed during the task (Casey et al 1997b). In another recent fMRI study, ADHD children had increased bilateral frontal lobe activity relative to control subjects when performing a very slow version of the From the Department of Psychiatry (SRP, ML), Research Imaging Center (ML,
MGW), and the Department of Radiology (ML, MGW), The University of Texas Health Science Center at San Antonio, San Antonio.
Address reprint requests to Steven R. Pliszka, M.D., The University of Texas Health Science Center at San Antonio, Department of Psychiatry, 7703 Floyd Curl Drive, San Antonio TX 78284-7792.
Received September 30, 1999; revised March 21, 2000; accepted March 23, 2000.
© 2000 Society of Biological Psychiatry 0006-3223/00/$20.00
Go–NoGo task, interpreted as increased inhibitory effort on the part of the ADHD children (Vaidya et al 1998). Anterior cingulate and inferior prefrontal cortex dysfunc-tion in ADHD compared with control adults was also found in a fMRI study during the counting stroop (Bush et al 1999).
A more specific behavioral task to address inhibitory control is the Stop signal task (Logan et al 1984; Pliszka et al 1997; Schachar and Logan 1990). In this task, subjects press a button to perform a discrimination response to stimuli on a screen, but on certain trials a stop signal appears at unpredictable intervals after the stimulus and subjects must inhibit their response. The Stop signal task assumes there is a “race” between the Go process and a Stop process; if the latter is fast enough, subjects can successfully inhibit their response to the Go signal. Pre-vious studies have shown that, relative to control subjects, children with ADHD have a flatter slope of the inhibition function (percent failed inhibitions as a function of Go-Stop delay interval), as well as longer stop signal reaction time (SSRT; Schachar and Logan 1990), a measure derived from this function. A higher SSRT was found to correlate strongly with higher ratings of hyperactivity during a classroom task (Pliszka et al 1997).
One ERP study employed the Stop signal task in ADHD and control children (Brandeis et al 1998). Using a version of the Stop signal task with mainly one Go–Stop signal interval (250 msec), this study reported an early ERP group effect (immediately preceding the Stop signal) confined to failed inhibitions, which were therefore attrib-uted to group differences in covert orienting to the Go stimuli and were interpreted as a failure in orienting preparatory mechanisms in ADHD children. In this study, patients did not meet criteria for ADHD, and no behavioral differences with control subjects were present. Impor-tantly, an ERP analysis time-locked to the onset of the Stop signal was not carried out.
In addition, a very recent fMRI study in seven ADHD and nine control adolescents reported lower than normal activation of right prefrontal areas in the ADHD group, using a block-design paradigm and contrasting a simpli-fied version of the Stop signal task and a Go-response control task (Rubia et al 1999). Consistent with these results are MRI morphometry data in ADHD children, suggesting reduced white matter volumes in the right frontal lobe of ADHD children (Castellanos et al 1996; Filipek et al 1997).
Although available research suggests a role of the right prefrontal cortex in inhibitory control in healthy children and a deficit of such function in ADHD children, the specific processing component affected and the time course of its activation are unknown. Event-related poten-tials possess extremely high temporal resolution (msec
level) and have the potential to identify the timing, order of activation, and dynamic orchestration of brain regions during the unfolding of the Stop signal task. In addition, whereas positron emission tomography and conventional fMRI only allow block paradigm design, ERPs capitalize on selective averaging of different stimulus types within the same experimental block, allowing mixed-trials anal-ysis of Go and Stop signal (NoGo) trials, and of successful and failed inhibitions following such Stop signals. Be-cause of their high temporal resolution, the selectively averaged ERP responses can reveal the exact timing of any differential processing components.
Our study aimed at clarifying these aspects of normal and abnormal functional organization of inhibitory control in children with ADHD and healthy children using high density ERPs during the classic version of the Stop signal task.
Methods and Materials
Our study included 10 boys with ADHD, combined type, and 10 control boys. Diagnosis of ADHD was established by the Diagnostic Interview Schedule for Children—Parent Version (DISC; Shaffer et al 1996). The ADHD subjects were at least 1.5 standard deviations above the mean on the Iowa Conners Teacher Rating Scale inattention/overactivity factor. This scale is a 10-item rating scale, containing five items relating to ADHD (Inattention/Overactivity factor) and five items related to aggres-sion. Each item is rating on a scale of 0 (not at all), 1 (just a little), 2 (pretty much) and 3 (very much). The items from each factor are averaged to yield factor scores ranging from 0 to 3 (Loney and Milich 1982). ADHD subjects were obtained from a university private practice setting and were middle class in terms of socioeconomic and parents’ occupational status. Control subjects were children of both professional and clerical staff at the medical school. Although no formal assessment of socioeco-nomic status was performed, the two groups appeared similar in this regard.
IQ and achievement testing were not obtained, but none of the subjects were in special education. All of the ADHD subjects were positive responders to stimulant treatment but were off medication for at least 24 hours before testing. The control subjects did not meet criteria for any other psychiatric disorder on the DISC and were in regular education classes. Written informed consent was obtained from all parents and all children assented to the study.
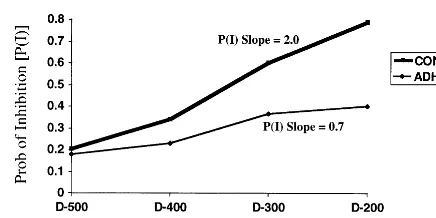
response, and the percentage of failed inhibitions is relatively low. In contrast, when the Stop signal occurs after a long interval following the Go signal, the subject more often fails to inhibit (Schachar and Logan 1990). Probabilities of inhibition [P(I)], slopes, and SSRT (which provides a measure of speed of the inhibitory process) can then be calculated for each of the four 100 –msec SOA subranges (200 –300, 300 – 400, etc.). Full de-tails of the SSRT calculation can be found elsewhere (Pliszka et al 1997; Schachar and Logan 1990). There were a total of 10 runs, separated by short rest periods. Each run lasted about 3 min and contained 144 Go signals and 48 Stop signal trials (12 at each of the 4 stop signal delays). Probabilities of inhibition were calculated for each of the four delays as follows. At the short delay (200 msec), a child may have successfully inhibited at 110 of the 120 presentations, for a P(I) of .92. In contrast, at the long delay (500 msec), a child may have successfully inhibited at only 20 of the 120 presentations, making the P(I) of .16. The four P(I) are plotted as shown in Figure 1, and the slope of the ADHD and control groups are plotted. The x-axis values of the Stop signal delays are arbitrarily set to 0.1, 0.2, 0.3, and 0.4 for 500, 400, 300, and 200 msec, respectively. This yields a P slope value for each subject between 0 and 4.0. If the SSRT is short (i.e., inhibitory processes are fast), the inhibitory process can “catch” the Go process and interrupt it. The subject’s reaction time (RTs) on the Go trials are normally disturbed. The SSRT starts with the appearance of the Stop Signal, for instance, at 200 msec. If a subjects inhibits 80% of the time on that Stop signal, it assumed that the Stop process is fast enough to catch all the Go responses between the onset of the Stop signal and the Go RT that is 80% of the distance from the longest RT. The RTs are ranked from the longest to shortest, and the RT that is 80% down the list is selected. Assume that particular RT is 520 msec. The SSRT for the 200-msec delay is therefore 52022005320. Four SSRTs are derived using each of the P(I)s calculated above; then the four SSRTs are averaged to yield the grand SSRT.
In our study, the level of difficulty of the inhibition process for each run was adjusted according to the global mean reaction time (GMRT) to the Go stimuli in the preceding block. For instance, if the GMRT to the Go stimuli in the first block was 725 msec, then 125 msec (7252600) was added to each of the Stop signal SOAs in the second block. This prevented the child from “beating the S” by slowing down his RT until he was sure were was no Stop signal. Paired t tests were employed for the
following behavioral parameters: GMRT, RT variability and discrimination accuracy in the Go task, SSRT, and percent failed inhibitions for each SOA. There were a total of 10 runs, separated by short periods. Each run lasted about 3 min and included 144 Go signals along with 48 Stop signal trials.
Brain electrical activity was recorded using a 64-channel cap (Electrocap, Eaton, OH) referenced to the right mastoid. Ampli-fier settings were: bandpass 5 0.01–100 Hz, gain 5 104,
sampling rate5 400 Hz, impedances , 5 k. Trials with eye movements artifacts were rejected off-line. ERPs were selec-tively averaged for the following trial types: Go, successful inhibitions (SI), and failed inhibitions (FI). ERPs were averaged 2000 msec poststimulus, with a 200-msec prestimulus baseline and smoothed. ERPs to the SI and FI trials were analyzed twice, time-locked to the onset of the Go signal and to the onset of the Stop signal. For the latter analysis, FIs preceding the Stop signal were excluded. Individual subjects’ ERPs were then grand averaged for each trial type for the ADHD group and the control group. Topographic maps of the ERP scalp distributions for the different trial types and difference waves were created using the spherical spline method (Perrin et al 1989).
Two effects were evident from the inspection of the group grand averages and topographic maps (control and ADHD groups) and difference waves of the ADHD group minus the control group. First, the ERP to the Stop signal in control children showed a sharp negative wave peaking at 210 msec for both SI and FI (N200), which was markedly reduced in ADHD children (Figure 2). A latency window centered over the grand-average N200 (190 –230 msec) was chosen to study this effect. Second, the ERPs to the Go signals preceding SI trials and FI trials showed different amplitude of a slow positive wave, with different scalp topography in ADHD and control children (PrW or preparatory wave, Figure 3). A latency window was chosen between 250 and 500 msec. For both measures, global repeated-measure ANOVAs were performed first as an omnibus signifi-cance test. Upon signifisignifi-cance of the group3 scalp region(s) interaction(s), local analyses on individual regions (sets of electrodes) followed to help the interpretation of the former interaction(s). We setpvalue at .05 and corrected degrees of freedom for deviations from sphericity with the Greenhouse– Geisser epsilon method. Analyses involving scalp topography group changes were repeated after applying a normalization procedure aimed at correcting for global voltage amplitude differences between groups (square root of means of squares method (McCarthy et al 1985). To assess anterior–posterior, superior–inferior, and left–right differences for both ERP analy-ses, in this activity, eight regions of interest (ROIs) were selected (two per hemisphere) by collapsing together mean voltage amplitudes over sets of three adjacent electrode sites. These ROIs included identical left and right superior frontal, inferior frontal, superior temporo–parietal and inferior temporo–parieto– occipi-tal sites. A mixed-design repeated measures ANOVA was carried out with factors being group (ADHD vs. control groups), trial type (SI vs. FI), anterior–posterior topography (ant vs. post ROI), superior-inferior topography (sup vs. inf ROI), and hemisphere (left vs. right).
Because of the short interval between the Go and Stop stimuli, the elicited ERP responses overlapped in time, distorting the final
Figure 2. The N200 to the Stop signal (190 –230 msec).Left: Grand average event-related potentials (ERPs) for con-trol (red) and attention-deficit/hyperac-tivity (ADHD; blue) for successful in-hibition (top) and failed inhibition (bottom) trials for anterior–inferior frontal and temporo-occipital regions. L, left; R, right. Zero point is the Stop signal onset.Right: Topographic maps of the controls minus ADHD ERP dif-ference wave for successful inhibition (top) and failed inhibition trials (bottom).
Figure 3. Preparatory wave (PrW; 250 –500 msec).
Left: Event-related potentials for successful inhibi-tion (SI), failed inhibiinhibi-tion (FI), and NonStop trials for Control children (top) and attention-deficit/hyperac-tivity disorder (ADHD) children (bottom) at the superior frontal and superior parietal regions. L, left; R, Right. Zero point is the Go stimulus onset.
ERP averages (Woldorff 1993). As predicted by previous behav-ioral studies, control children had steeper response inhibition functions (more SIs for shorter delay intervals and more FIs for longer intervals) than did the ADHD children. Thus, for the control children, if all the SI Stop-signal trials were averaged together, the SI ERP average would be dominated by more recent Go-stimulus events (200 –300 and 300 – 400 msec subranges), whereas the FI ERP average would be dominated by trials in which the Go-stimulus events occurred after longer intervals (400 –500 and 500 – 600 msec subranges). As a result, the total averaged overlap from the preceding Go-event ERPs would be different for the SI and FI ERP averages for the control children, as well as different from the corresponding ERPs for the ADHD group, confounding valid analyses of these data (Woldorff 1993). To correct for this differential overlap distortion problem, sub-averages of the SI and FI Stop-signal ERPs were obtained for each of the four time-delay subranges for each subject. These four subaverages were then collapsed together in an equally weighted way (i.e., 25% weighting for each subaverage), thereby equalizing the overlap from the Go-event ERPs, both between group and between trial type. Prestimulus baselines for the SI and FI Stop-signal ERP averages for the two groups were similar and flatter after this correction.
Results
Behavioral Results
Characteristics of the subjects and the performance of the groups on the Stop signal task are shown in Table 1. The ADHD group was rated as much more inattentive and overactive [t(18) 5 7.5, p , .001] and oppositional [t(18) 5 2.4, p, .001] on the Iowa Conners Teacher Rating Scale. The ADHD group was less accurate on the Go Task [t(18) 5 4.1, p , .01] and committed more omission errors, [F(1,18) 5 5.8, p , .03], and although the groups were not different in the GMRT, the ADHD subjects were more variable in reaction time [t(18) 5 3.1, p , .01]. There was a nonsignificant
trend toward a slower SSRT in the ADHD groups. As expected, however, the ADHD subjects had a flatter response inhibition slope than did the control subjects [t(18)5 4.5,p,.01] and a smaller overall percentage of SI [t(18) 5 4.9, p , .04; Figure 1].
ERP Results
N200 WAVE TO THE STOP SIGNAL. Both SI and FI trials in the control children showed a temporally sharp negative wave peaking at 200 msec post–Stop signal that was dramatically reduced in the ADHD children. The group difference had a focal distribution over right ante-rior infeante-rior scalp (Figure 2).
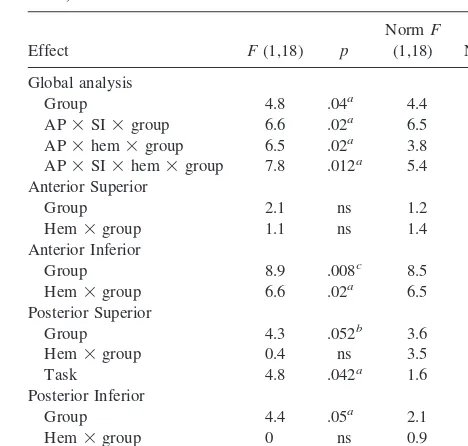
In the global analysis, a regional group difference in N200 amplitude was corroborated by significant interac-tions involving group, anterior–posterior topography, su-perior–inferior topography, and hemisphere. The interpre-tation of these interactions was clarified by the breakdown in the local analyses on each ROI, as shown in Table 2. Regional group differences were exclusively present over the right anterior inferior scalp region. The N200 ampli-tudes were significantly smaller over this scalp area in the ADHD children relative to control children, whereas they were of similar amplitude over all other regions (Table 2 and Figure 2). Regional group effects on this Stop-signal– evoked response were similar for both SI and FI inhibi-Table 1. Subject Characteristics and Performance on Stop
Signal Task (Attention-Deficit/Hyperactivity Disorder [ADHD] Subjects vs. Control Subjects)
ADHD Control p
n 10 10
Age (years) 11.0 (1.2) 11.3 (0.9) .53 Iowa CTRS inattention 2.0 (0.7) 0.3 (0.2) .001
Aggression 0.6 (0.6) 0.1 (0.3) .001
Accuracy on Go task (%) 85.7 (7.1) 96.0 (3.5) .001 Grand mean RT (msec) 625 (140) 679 (114) .352 Mean SD of RT 197 (43) 152 (17) .009 Mean adjustment after
each block
78.3 (90.6) 103.3 (93.7) .55
SSRT (msec) 428 (155) 337 (73) .12
Slope 0.70 (.84) 2.0 (.40) .001
CTRS, Conners Teacher Rating Scale; RT, response time; SSRT, stop signal reaction time.
Table 2. Analysis of Variance Results for N200 (190 –230 msec)
Norm, normalized values; AP, anterior–posterior; SI, superior–inferior; hem, hemisphere; ns, nonsignificant (p..10).
tions. Note, however, that although inferior frontal N200s were of similar size in both groups for the two trial types, FIs produced significantly larger N200s than SIs over bilateral posterior inferior regions (Table 2).
To test the hypothesis that the right frontal N200 amplitude reduction was related to a failure in response inhibition, simple correlations were performed between individual behavioral parameters in the Stop signal task and each child’s mean amplitude of the right frontal N200 for all Stop signal trials. The N200 amplitudes showed a highly significant negative correlation with both percent of SI and slope of the inhibitory function, particularly strong in the ADHD group (Table 3).
PREPARATORY WAVE TO THE GO STIMULUS. A slow positive wave (preparatory wave, or PrW), clearly preceding the onset of the Stop signal, displayed different amplitude for FI than SI trials, and was more positive over posterior than anterior scalp regions. Of greater interest here, the scalp topography of these PrW trial-specific effects varied significantly among groups, as confirmed by the significant interactions involving group, trial type and anterior–posterior topography. A breakdown of this inter-action revealed two apparently distinct topographic effects (Figure 3 and Table 4).
Over right frontal scalp, the ERP to FI trials in the control group was significantly more positive than the ERP to SI trials in the control group. In addition, the ERP to FI trials in the control group was significantly more positive than the ERP to FI trials in the ADHD group. Such FI-specific group effect was more diffused than the N200 group difference, extending to both inferior and superior frontal areas, being more significant inferiorly (Table 2). No difference between FI and SI trials was present in the ADHD group (Figure 3).
A second effect, localized over superior–posterior scalp, particularly on the left, was restricted to the ADHD group, where the PrW to FI trials was significantly more positive than the PrW to SI trials (Figure 3). No group differences approached significance level at this location.
To clarify the functional meaning of the PrW effects and the relationship to the following N200 group differ-ences, simple correlations were performed between PrW mean amplitude at right anterior and left posterior sites, as well as both behavioral parameters and the amplitude of the right inferior frontal N200 wave (Table 3). Of partic-ular interest is the lack of correlation between left poste-rior PrW for the SI trials and performance in the Stop signal task in the ADHD group, whereas the control group showed a very significant positive correlation with slope of the inhibitory function (r 5 .10 and r 5 .81, respectively).
Discussion
Our study identifies a novel ERP finding in ADHD children during the Stop signal task. The ERP to the Stop signal in the ADHD children showed a markedly reduced Table 3. Simple Correlations between Event-Related Potential
and Performance Effects
Slope % SI N200-SI N200-FI Control subjects
SI, successful inhibitions; FI, failed inhibitions; PrW, preparatory wave; ai, right anterior inferior; ps, left posterior superior.
ap
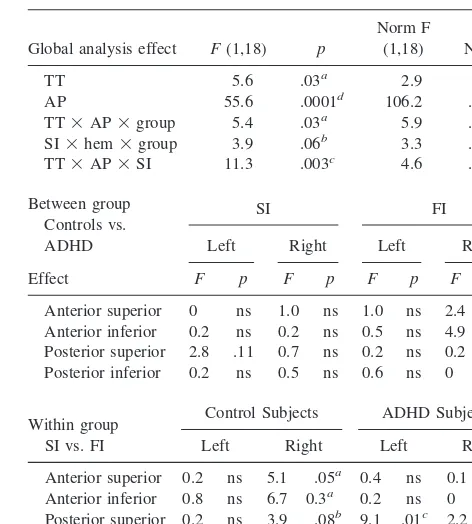
Table 4. Analysis of Variance Results for Preparatory Wave (250 –500 msec)
Global analysis effect F(1,18) p
Norm F
Anterior superior 0 ns 1.0 ns 1.0 ns 2.4 .14 Anterior inferior 0.2 ns 0.2 ns 0.5 ns 4.9 .04a Posterior superior 2.8 .11 0.7 ns 0.2 ns 0.2 ns Posterior inferior 0.2 ns 0.5 ns 0.6 ns 0 ns
Within group SI vs. FI
Control Subjects ADHD Subjects
Left Right Left Right
Anterior superior 0.2 ns 5.1 .05a 0.4 ns 0.1 ns Anterior inferior 0.8 ns 6.7 0.3a 0.2 ns 0 ns Posterior superior 0.2 ns 3.9 .08b 9.1 .01c 2.2 .17 Posterior inferior 3.9 .08b 0.4 ns 1.6 ns 3.3 .10b
N200 wave over right inferior frontal scalp. The presence of this N200 wave in control children appears to reflect the more efficient onset and implementation of the process of response inhibition. The marked reduction of the N200 wave in ADHD children likely represents a deficit in the inhibitory process as indexed by the abnormal slope function in the Stop signal task, as suggested by the strong correlation between N200 amplitude and behavioral indi-ces of response inhibition in the ADHD group. A second and less novel finding in our study is the reduced ampli-tude in ADHD children of a slow positive wave preceding failed inhibitions in anticipation of the Stop signals over a more widespread region of right frontal cortex (Brandeis et al 1998). These combined ERP findings strongly implicate a right, particularly inferior prefrontal cortex mechanism asso-ciated with response inhibition, which is impaired in ADHD children, and confirm similar findings obtained with fMRI during the Stop signal task in ADHD children (Rubia et al 1999), as well as in healthy children and adults during Go-NoGo tasks (Casey et al 1997a; Garavan et al 1999).
The N200 Effect
Several ERP studies of Go–NoGo tasks in healthy adults have identified greater amplitude, frontal N200 compo-nents to NoGo relative to Go trials (Eimer 1993; Jodo and Kayama 1992; Kok 1986). The amplitude did not vary with the probability of the NoGo stimulus, discounting interpretations based on arousal or salience (Eimer 1993), but was affected by speed-accuracy trade-offs, showing greater amplitude when the emphasis was on speed rather than accuracy. A fast response rate makes inhibiting more difficult, hence requiring a greater activation of the inhib-itory process represented by the N200 (Jodo and Kayama 1992). Based on these findings and on similar intracrani-ally recorded waves (peaking at 150 msec) observed in monkeys from electrodes implanted in the prefrontal cortex during performance of the Go–NoGo task (Gemba and Sasaki 1990), it was proposed that the N200 indexes a process of response inhibition for the NoGo trials that is a reflection of a “red flag” signal or an “inhibitory process likely generated in prefrontal cortex” (Kok 1986), consis-tent with the role of prefrontal cortex in inhibiting re-sponses to irrelevant stimuli (Stuss and Benson 1986).
A recent ERP study in ADHD children and control children during the CPT-AX version of the Go–NoGo task reported greater frontal N200 amplitudes to A-not-X than A-X trials in control children (Overtoom et al 1998), replicating the adults’ findings in the Go–NoGo task (Eimer 1993; Jodo and Kayama 1992; Kok 1986). The ADHD group as a whole did not differ from the controls in the N200, but a small group of six ADHD children with associated ODD had reduced N200 amplitudes relative to
the control group (Overtoom et al 1998). Comorbidity in several of the ADHD children, as well as the lesser specificity of the CPT-AX task compared with the Stop signal task for the response inhibition process, may in part explain the discrepancy with our findings.
A second ERP study in ADHD and control children employed a simplified version of the Stop signal task with a main Go–Stop interval (250 msec). This study did not find differences in the N200 to the Stop signals, although they reported other effects preceding the Stop signal (Brandeis et al 1998; see below for a more detailed report of the results).
In our study, N200 waves in control children were similar in size for SI and FI, and both were equally reduced in ADHD children. This is consistent with the notion of the N200 as a “red flag” signaling the need for response inhibition (Kok 1986). Under this view, the red flag would be produced regardless of whether successful response inhibition is accomplished. A simple analogy that could apply here is that of using brakes to avoid a sudden obstacle. Whereas control children appear to try to “hit the brakes” whether or not they can come to a complete stop before “impact,” ADHD children appear to lack the triggering response to try to apply their brakes.
Localization of the N200 Effect
The localization of the N200 effect to right inferior frontal scalp is consistent with similar changes in activation recently reported in right inferior prefrontal cortex with fMRI in ADHD and healthy adolescents during the Stop signal task (Rubia et al 1999) and with similar activations found in healthy children and adults during the execution of a Go–NoGo task with high target frequency (Casey et al 1997b; Garavan et al 1999). This localization is also consistent with MRI morphometric data indicating smaller right anterior frontal lobes in ADHD children relative to control children (Castellanos et al 1996; Filipek et al 1997) and with significant correlations between right frontal and caudate volumes and correct performance on inhibitory tasks (Casey et al 1997a).
mecha-nisms as a core deficit in ADHD children (Barkley 1997; Castellanos 1997; Heilman et al 1991).
Preparatory Wave to the Go Stimulus
A secondary finding of our study concerns the smaller amplitude in ADHD children of a slow wave in anticipa-tion to FI in the ERP to the onset of the Go stimulus.
Control children’s FI trials displayed greater positivity of the PrW over right prefrontal cortex relative to the same FI trials in ADHD children and to SI trials in control children. The spatial distribution of this effect was more widespread than the N200 effect, extending to right inferior and superior frontal scalp. A similar FI-specific result has been reported in the only ERP study using the Stop signal task (Brandeis et al 1998) with an earlier timing (180 –265 msec). Because the response was too early to reflect processing of the Stop signal (chiefly at 250 msec), the finding was interpreted as impaired covert orienting to the first (Go) stimulus in ADHD children. The Stop-failure specificity in control children was explained by fast primary task processes due to efficient engagement of attention, an interpretation consistent with the race model predicting fastest primary task responses resulting in Stop failures (Brandeis et al 1998). We interpret our findings in line with such authors. We attribute the greater temporal spread of the effect (200 –500 msec) to the fact that our Go–Stop time intervals were equally distributed in the 200 – 600 range. Interestingly, the amplitude of the right frontal PrW was also correlated (but positively) with performance in the Stop signal task, although in a less consistent way than the N200.
An increased positivity of PrW for Stop failures relative to Stop successes was also found within the ADHD group, but the topographic distribution was different than in control children, with a left superior parietal focus. A first interpre-tation of this difference is in terms of greater relative negativity for SI trials, suggesting greater attentional process-ing in anticipation of successful Stops. Such interpretation is discounted by the evidence that ADHD children displayed significantly more omissions to the primary Go task than did control children and that the left parietal PrW to SI trials in ADHD children showed no correlation with Stop signal performance, whereas a very high correlation was present in the control group (Table 4). A more plausible interpretation of this left superior parietal effect is that of a more positive PrW to failed than successful Stops trials. This would be the result of fastest primary task responses resulting in Stop failures (Brandeis et al 1998) and possible presence of omissions among the SI trials in the ADHD group.
Relationship of N200 and PrW
It may be remarked (compare Figures 2 and 3) that the topography of the PrW in the controls (time-locked to the
Go stimuli) is similar to that of the N200 group difference (time-locked to the Stop signals). Because of the possible effects of overlap between the ERPs to the Go and Stop stimuli, it is important to examine more closely the possibility that one of these effects was actually just the latency-shifted version of the other. For example, assume that there was only a pre–Stop-signal PrW difference. Could this have produced the N200 difference when time-locking to the Stop signal? This possibility is easily ruled out. First, we took the precaution of equally weight-ing the subaverages at the different delay subranges. Second, we employed a wide delay interval “jitter” (ran-dom variation: 200 – 600 msec), which tends to smear out all but the lowest frequencies of adjacent responses (Woldorff 1993). Moreover, the pre–Stop-signal PrW was of low frequency content to begin with, making it virtually impossible to be transformed after wide jittering to a response as sharp and transient as the N2 wave when time-locked to the the Stop signals. And, finally, PrW effects are different for SI and FI trails, whereas the N200 does not differentiate SI and FI.
On the other hand, could the PrW time-locked to the Go stimulus be a latency-shifted, smeared-out version of the N200 group difference? Again, we can easily rule that out. First, the PrW starts too early (;150 msec post-Go) to be produced by the N200s, which occur 200 sec after the Stop signal (which is itself 200 – 600 msec after the GO). Second, ERPs to Go stimuli and FI Stop signal trials (which were also followed by N200 in the control children) virtually over-lapped in this time latency, reflecting the attenuation of the N200 by the wide delay jitter. And, once again, the PrW is trial specific, whereas the N200 is not.
Finally, PrW and N200 correlate inversely, suggesting that PrW has an opposite, positive polarity compared with the N200 wave. If PrW would be a smeared version of the N200, the polarity would be the same, and the correlation would have a positive sign. It is more likely that the right frontal N200 and PrW abnormalities are different mecha-nisms, both affected by a common anatomic abnormality in circuits involving the right prefrontal region.
Conclusions
course of treatment will be able to address whether the N200 abnormality is a “state” marker (normalization with treatment) or a disease or “trait” marker present also in medicated, asymptomatic children, or even in first-degree relatives of ADHD children. Finally, future studies should investigate the relationship between the right frontal N200 abnormality and MRI morphometric changes. Such fol-low-up studies seem likely to greatly further our under-standing of the pathophysiology of ADHD.
This study was funded by Morrison Trust and Friends for Psychiatric Research, The University of Texas Health Science Center at San Antonio.
References
Barkley RA (1997):ADHD and the Nature of Self-Control.New York: Guilford.
Brandeis D, van Leeuwen TH, Rubia K, Vitacco D, Steger J, Pascual-Marqui RD, et al (1998): Neuroelectric mapping reveals precursor of stop failures in children with attention deficits.Behav Brain Res94:111–125.
Bush G, Frazier JA, Rauch SL, Seidman LJ, Whalen PJ, Jenike MA, et al (1999): Anterior cingulate cortex dysfunction in attention-deficit/hyperactivity disorder revealed by fMRI and the Counting Stroop.Biol Psychiatry45:1542–1552. Casey BJ, Castellanos FX, Giedd JN, Marsh WL, Hamburger SD,
Schubert AB, et al (1997a): Implication of right frontostriatal circuitry in response inhibition and attention-deficit/hyperactiv-ity disorder.J Am Acad Child Adolesc Psychiatry36:374 –383. Casey BJ, Trainor RJ, Orendi JL, Schubert AB, Nystrom LE, Giedd JN, et al (1997b): A developmental functional MRI study of prefrontal activation during performance of a go-no-go task.J Cogn Neurosci9:835– 847.
Castellanos FX (1997): Toward a pathophysiology of attention-deficit/hyperactivity disorder.Clin Pediatr36:381–393. Castellanos FX, Giedd JN, Marsh WL, Hamburger SD, Vaituzis
AC, Dickstein DP, et al (1996): Quantitative brain magnetic resonance imaging in attention-deficit hyperactivity disorder. Arch Gen Psychiatry53:607– 616.
Douglas VI (1983): Attentional and cognitive problems. In: Rutter M, editor.Developmental NeuropsychiatryNew York: Guilford, 280 –329.
Eimer M (1993): Effects of attention and stimulus probability on ERPs in a Go/Nogo task.Biol Psychol35:123–138. Filipek PA, Semrud-Clikeman M, Steingard RJ, Renshaw PF,
Kennedy DN, Biederman J (1997): Volumetric MRI analysis comparing subjects having attention-deficit hyperactivity dis-order with normal controls.Neurology48:589 – 601. Garavan H, Ross TJ, Stein EA (1999): Right hemispheric
dominance of inhibitory control: An event-related functional MRI study.Proc Natl Acad Sci U S A96:8301– 8306. Gemba H, Sasaki K (1990): Potential related to no-go hand
movement with discrimination between tone stimuli of dif-ferent frequencies in the monkey.Brain Res537:340 –344. Heilman KM, Voeller KK, Nadeau SE (1991): A possible
pathophysiologic substrate of attention deficit hyperactivity disorder.J Child Neurol6(suppl):S76 –S81.
Jodo E, Kayama Y (1992): Relation of a negative ERP compo-nent to response inhibition in a Go/No Go task. Electroen-cephalogr Clin Neurophysiol82:477– 482.
Kok A (1986): Effects of degradation of visual stimuli on components of the event-related potential (ERP) in go/nogo reaction tasks.Biol Psychol23:21–38.
Logan GD, Cowan WB, Davis KA (1984): On the ability of inhibit simple and choice reaction time responses: A model and a method.J Exp Psychol Human Percept Perform10:276 –291. Loney J, Milich M (1982): Hyperactivity, inattention, and
aggression in clinical practice. In: Wolraich M, Routh DK, editors.Advances in Behavioral and Developmental Pediat-rics, Vol. 3.Greenwich, CT: JAI, 113–147.
McCarthy G, Wood CC (1985): Scalp distributions of event-related potentials: An ambiguity associated with analysis of variance models.Electroencephalogr Clin Neurophysiol62:203–208. Overtoom CCE, Verbaten MN, Kemner C, Kenemans JL, van
Engeland H, Buitelaar JK, et al (1998): Associations between event related potentials and measures of attention and inhibi-tion in the continous performance task in children with ADHD and normal controls. J Am Acad Child Adolesc Psychiatry37:977–985.
Perrin F, Pernier J, Bertrand D, Echallier JF (1989): Spherical splines for scalp potential and current density mapping. Electroencephalogr Clin Neurophysiol72:184 –187. Pliszka SR, Borcherding SH, Spratley K, Leon S, Irick S (1997):
Measuring inhibitory control in children.J Dev Behav Pediatr 18:254 –259.
Rubia K, Overmeyer S, Taylor E, Brammer M, Williams SCR, Simmons A, et al (1999): Hypofrontality in attention deficit hyperactivity disorder during higher-order motor control: A study with functional MRI.Am J Psychiatry156:891– 896. Schachar R, Logan GD (1990): Impulsivity and inhibitory
control in normal development and childhood psychopathol-ogy.Dev Psychol26:710 –720.
Sergeant JA, van der Meere J (1989):Attention Deficit Disorder: Clinical and Basic Research.Hillsdale, NJ: Erlbaum. Shaffer D, Fisher P, Dulcan MK, Davies M, Piacentini J,
Schwab-Stone ME, et al (1996): The NIMH Diagnostic Interview Schedule for Children Version 2.3 (DISC 2.3): Description, acceptability, prevalence rates, and performance in the MECA study. Methods for the Epidemiology of Child and Adolescent Mental Disorders Study.J Am Acad Child Adolesc Psychiatry35:865– 877.
Stuss DT, Benson DF (1986): The Frontal Lobes. New York: Raven.
Vaidya CJ, Austin G, Kirkorian G, Ridlehuber HW, Desmond JE, Glover GH, et al (1998): Selective effects of methylpheni-date in attention deficit hyperactivity disorder: A functional magnetic resonance study.Neurobiology95:14494 –14499. van der Meere J, van Baal M, Sergeant JA (1989): The additive
factor method: A differential diagnostic tool in hyperactivity and learning disability.J Abnorm Child Psychol17:409 – 422. van der Meere J, Vreeling HJ, Sergeant J (1992): A motor presetting study in hyperactive, learning disabled and control children.J Child Psychol Psychiatry33:1347–1354. Woldorff MG (1993): Distortion of ERP averages due to overlap