www.elsevier.comrlocateratmos
Review
ž
Role of organic acids formic, acetic, pyruvic and
/
oxalic in the formation of cloud condensation
ž
/
nuclei CCN : a review
Shaocai Yu
)Nicholas School of the EnÕironment, Duke UniÕersity, Durham, NC 27708, USA
Received 14 September 1999; accepted 23 December 1999
Abstract
Although it is believed that organic aerosols play a key role in cloud nucleation and make an
Ž .
important contribution to the cloud condensation nuclei CCN population, their specific species
Ž
remain poorly characterized. This paper reviews the current knowledge of organic acids mainly
.
formic, acetic, pyruvic and oxalic acids . Without specification, organic acids in this paper refer to these four organic acids in the gas and aerosol phases. This paper analyzes the extent to which organic acids act as CCN and compares the physical and chemical properties of organic acids with those of CCN. The results show that aerosol formate and acetate concentrations range from 0.02 to 5.3 nmol my3
and from 0.03 to 12.4 nmol my3
, respectively, and that between 34 to 77% of formate and between 21 to 66% of acetate are present in the fine fraction of aerosols. It was found
Ž .
that although most 98–99% of these volatile organic acids are present in the gas phase, their concentrations in the aerosol particles are sufficient to make them a good candidate for CCN. The results also show that organic acids may make an important contribution to the formation of CCN in some special sources such as vegetation emissions and biomass-burning. Organic acids are
Ž .
expected to contribute significantly to the estimates of indirect cloud-mediated forcing due to aerosols.q2000 Elsevier Science B.V. All rights reserved.
Keywords: Organic acids; Cloud condensation nuclei; Sources; Indirect aerosol forcing
1. Introduction
Aerosol nucleation properties, i.e., the propensity of particles to form water droplets at atmospheric supersaturation levels, are determined by the particle size, chemical
)Tel.:q1-919-613-8027; fax:q1-919-684-8741.
Ž .
E-mail address: [email protected] S. Yu .
0169-8095r00r$ - see front matterq2000 Elsevier Science B.V. All rights reserved.
Ž .
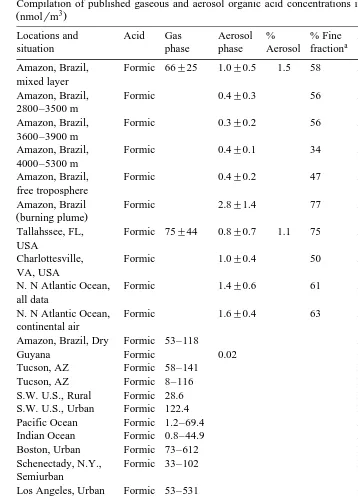
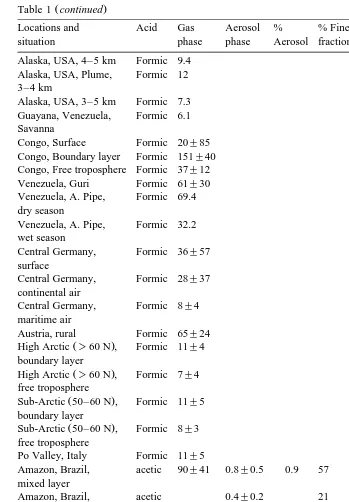
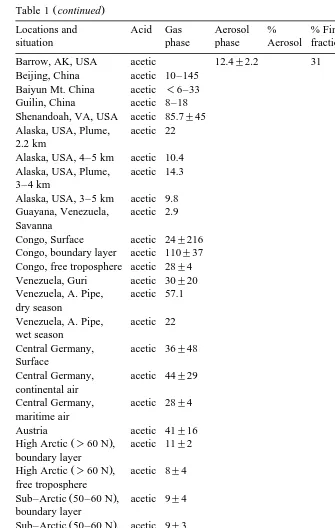
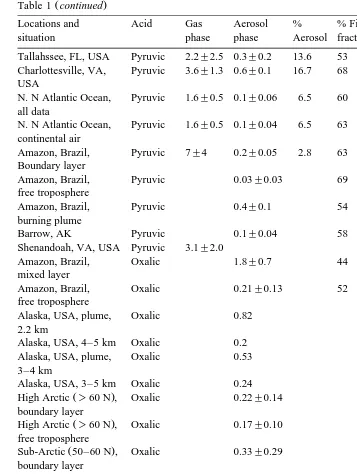
Table 1
Compilation of published gaseous and aerosol organic acid concentrations in the different parts of the world
Ž 3.
nmolrm
Locations and Acid Gas Aerosol % % Fine Authors
a
situation phase phase Aerosol fraction
Ž .
Amazon, Brazil, Formic 66"25 1.0"0.5 1.5 58 Andreae et al. 1988a mixed layer
Ž .
Amazon, Brazil, Formic 0.4"0.3 56 Andreae et al. 1988a
2800–3500 m
Ž .
Amazon, Brazil, Formic 0.3"0.2 56 Andreae et al. 1988a
3600–3900 m
Ž .
Amazon, Brazil, Formic 0.4"0.1 34 Andreae et al. 1988a
4000–5300 m
Ž .
Amazon, Brazil, Formic 0.4"0.2 47 Andreae et al. 1988a
free troposphere
Ž .
Amazon, Brazil Formic 2.8"1.4 77 Andreae et al. 1988a
Žburning plume.
Ž .
Tallahssee, FL, Formic 75"44 0.8"0.7 1.1 75 Andreae et al. 1987 USA
Ž .
Charlottesville, Formic 1.0"0.4 50 Andreae et al. 1987
VA, USA
Ž .
N. N Atlantic Ocean, Formic 1.4"0.6 61 Andreae et al. 1987 all data
Ž .
N. N Atlantic Ocean, Formic 1.6"0.4 63 Andreae et al. 1987 continental air
Ž .
Amazon, Brazil, Dry Formic 53–118 Andreae et al. 1988a
Ž .
Guyana Formic 0.02 Gregory et al. 1986
Ž .
Tucson, AZ Formic 58–141 Dawson et al. 1980
Ž .
Tucson, AZ Formic 8–116 Farmer and Dawson 1982
Ž .
S.W. U.S., Rural Formic 28.6 Dawson and Farmer 1988
Ž .
S.W. U.S., Urban Formic 122.4 Dawson and Farmer 1988
Ž .
Pacific Ocean Formic 1.2–69.4 Arlander et al. 1990
Ž .
Indian Ocean Formic 0.8–44.9 Arlander et al. 1990
Ž .
Boston, Urban Formic 73–612 Lawrence and Koutrakis 1994
Ž .
Schenectady, N.Y., Formic 33–102 Khwaja 1995
Semiurban
Ž .
Los Angeles, Urban Formic 53–531 Grosjean 1989
Ž .
Los Angeles, Urban Formic 33"36 3.0"3 9.1 Kawamura et al. 1985
Ž .
Hampton, VA, USA, Formic 28 Talbot et al. 1988a
Nongrowing
Ž .
Hampton, VA, USA, Formic 78 0.5"0.3 -1.0 Talbot et al. 1988a Growing
Ž .
Barbados Formic 1.0"1 Talbot et al. 1986
Ž .
Barrow, AK, USA Formic 5.3"0.7 45 Li and Winchester 1989
Ž .
Beijing, China Formic 10–43 Yu et al. 1990
Ž .
Baiyun Mt. China Formic 4–22 Yu et al. 1990
Ž .
Guilin, China Formic 8–9 Yu et al. 1990
Ž .
Hawaii, Rural Formic 20 Norton 1992
Ž .
Shenandoah, VA, Formic 228"139 Talbot et al. 1995
USA
Ž .
Alaska, USA, Plume, Formic 14.3 Wofsy et al. 1992
Ž .
Table 1 continued
Locations and Acid Gas Aerosol % % Fine Authors
a
situation phase phase Aerosol fraction
Ž .
Alaska, USA, 4–5 km Formic 9.4 Wofsy et al. 1992
Ž .
Alaska, USA, Plume, Formic 12 Wofsy et al. 1992
3–4 km
Ž .
Alaska, USA, 3–5 km Formic 7.3 Wofsy et al. 1992
Ž .
Guayana, Venezuela, Formic 6.1 Sanhueza and Andreae 1991
Savanna
Ž .
Congo, Surface Formic 20"85 Helas et al. 1992
Ž .
Congo, Boundary layer Formic 151"40 Helas et al. 1992
Ž .
Congo, Free troposphere Formic 37"12 Helas et al. 1992
Ž .
Venezuela, Guri Formic 61"30 Hartmann 1990
Ž .
Venezuela, A. Pipe, Formic 69.4 Sanhueza et al. 1992
dry season
Ž .
Venezuela, A. Pipe, Formic 32.2 Sanhueza et al. 1992
wet season
Ž .
Central Germany, Formic 36"57 Hartmann et al. 1989
surface
Ž .
Central Germany, Formic 28"37 Hartmann et al. 1989
continental air
Ž .
Central Germany, Formic 8"4 Hartmann et al. 1989
maritime air
Ž .
Austria, rural Formic 65"24 Puxbaum et al. 1988
Ž . Ž .
High Arctic )60 N , Formic 11"4 Talbot et al. 1992
boundary layer
Ž . Ž .
High Arctic )60 N , Formic 7"4 Talbot et al. 1992
free troposphere
Ž . Ž .
Sub-Arctic 50–60 N , Formic 11"5 Talbot et al. 1992
boundary layer
Ž . Ž .
Sub-Arctic 50–60 N , Formic 8"3 Talbot et al. 1992
free troposphere
Ž .
Po Valley, Italy Formic 11"5 Winiwarter et al. 1988
Ž .
Amazon, Brazil, acetic 90"41 0.8"0.5 0.9 57 Andreae et al. 1988a mixed layer
Ž .
Amazon, Brazil, acetic 0.4"0.2 21 Andreae et al. 1988a
2800–3500 m
Ž .
Amazon, Brazil, acetic 0.3"0.2 65 Andreae et al. 1988a
3600–3900 m
Ž .
Amazon, Brazil, acetic 0.3"0.2 56 Andreae et al. 1988a
4000–5300 m
Ž .
Amazon, Brazil, acetic 0.3"0.2 50 Andreae et al. 1988a
free troposphere
Ž .
Amazon, Brazil, acetic 2.0"0.6 66 Andreae et al. 1987
burning plume
Ž .
Guyana acetic 0.03 Gregory et al. 1986
Ž .
Tucson, AZ acetic 46–257 Dawson et al. 1980
Ž .
Tucson, AZ acetic 10–133 Farmer and Dawson 1982
Ž .
Los Angeles, USA acetic 50"45 2.0"3 6.9 Kawamura et al. 1985
Ž .
Hampton, VA, USA acetic 5–166 0.3"0.1 -1.0 Talbot et al. 1988a
Ž .
Barbados acetic 0.7"1.0 Talbot et al. 1986
Ž .
Table 1 continued
Locations and Acid Gas Aerosol % % Fine Authors
a
situation phase phase Aerosol fraction
Ž .
Barrow, AK, USA acetic 12.4"2.2 31 Li and Winchester 1989
Ž .
Beijing, China acetic 10–145 Yu et al. 1990
Ž .
Baiyun Mt. China acetic -6–33 Yu et al. 1990
Ž .
Guilin, China acetic 8–18 Yu et al. 1990
Ž .
Shenandoah, VA, USA acetic 85.7"45 Talbot et al. 1995
Ž .
Alaska, USA, Plume, acetic 22 Wofsy et al. 1992
2.2 km
Ž .
Alaska, USA, 4–5 km acetic 10.4 Wofsy et al. 1992
Ž .
Alaska, USA, Plume, acetic 14.3 Wofsy et al. 1992
3–4 km
Ž .
Alaska, USA, 3–5 km acetic 9.8 Wofsy et al. 1992
Ž .
Guayana, Venezuela, acetic 2.9 Sanhueza and Andreae 1991
Savanna
Ž .
Congo, Surface acetic 24"216 Helas et al. 1992
Ž .
Congo, boundary layer acetic 110"37 Helas et al. 1992
Ž .
Congo, free troposphere acetic 28"4 Helas et al. 1992
Ž .
Venezuela, Guri acetic 30"20 Hartmann 1990
Ž .
Venezuela, A. Pipe, acetic 57.1 Sanhueza et al. 1992
dry season
Ž .
Venezuela, A. Pipe, acetic 22 Sanhueza et al. 1992
wet season
Ž .
Central Germany, acetic 36"48 Hartmann et al. 1989
Surface
Ž .
Central Germany, acetic 44"29 Hartmann et al. 1989
continental air
Ž .
Central Germany, acetic 28"4 Hartmann et al. 1989
maritime air
Ž .
Austria acetic 41"16 Puxbaum et al. 1988
Ž . Ž .
High Arctic )60 N , acetic 11"2 Talbot et al. 1992
boundary layer
Ž . Ž .
High Arctic )60 N , acetic 8"4 Talbot et al. 1992
free troposphere
Ž . Ž .
Sub–Arctic 50–60 N , acetic 9"4 Talbot et al. 1992
boundary layer
Ž . Ž .
Sub–Arctic 50–60 N , acetic 9"3 Talbot et al. 1992
free troposphere
Ž .
Po Valley, Italy acetic 21"5 Winiwarter et al. 1988
Ž .
S.W. U.S., Rural acetic 24.4 Dawson and Farmer 1988
Ž .
S.W. U.S., Urban acetic 163 Dawson and Farmer 1988
Ž .
Pacific Ocean acetic 2–78 Arlander et al. 1990
Ž .
Indian Ocean acetic 4.1–48 Arlander et al. 1990
Ž .
Boston, Urban acetic 33–220 Lawrence and Koutrakis 1994
Ž .
Schenectady, N. Y., acetic 24–139 Khwaja 1995
Semiurban
Ž .
Los Angeles, urban acetic 1.2–160 Grosjean 1989
Ž .
Los Angeles, urban acetic 78–653 Kawamura et al. 1985
Ž .
Hampton, VA, USA, acetic 28.5 Talbot et al. 1988a
nongrowing
Ž .
Hampton, VA, USA, acetic 53.1 Talbot et al. 1988a
Ž .
Table 1 continued
Locations and Acid Gas Aerosol % % Fine Authors
a
situation phase phase Aerosol fraction
Ž .
Tallahssee, FL, USA Pyruvic 2.2"2.5 0.3"0.2 13.6 53 Andreae et al. 1987
Ž .
Charlottesville, VA, Pyruvic 3.6"1.3 0.6"0.1 16.7 68 Andreae et al. 1987 USA
Ž .
N. N Atlantic Ocean, Pyruvic 1.6"0.5 0.1"0.06 6.5 60 Andreae et al. 1987 all data
Ž .
N. N Atlantic Ocean, Pyruvic 1.6"0.5 0.1"0.04 6.5 63 Andreae et al. 1987 continental air
Ž .
Amazon, Brazil, Pyruvic 7"4 0.2"0.05 2.8 63 Andreae et al. 1987 Boundary layer
Ž .
Amazon, Brazil, Pyruvic 0.03"0.03 69 Andreae et al. 1987
free troposphere
Ž .
Amazon, Brazil, Pyruvic 0.4"0.1 54 Andreae et al. 1987
burning plume
Ž .
Barrow, AK Pyruvic 0.1"0.04 58 Li and Winchester 1989
Ž .
Shenandoah, VA, USA Pyruvic 3.1"2.0 Talbot et al. 1995
Ž .
Amazon, Brazil, Oxalic 1.8"0.7 44 Talbot et al. 1988a
mixed layer
Ž .
Amazon, Brazil, Oxalic 0.21"0.13 52 Talbot et al. 1988a
free troposphere
Ž .
Alaska, USA, plume, Oxalic 0.82 Wofsy et al. 1992
2.2 km
Ž .
Alaska, USA, 4–5 km Oxalic 0.2 Wofsy et al. 1992
Ž .
Alaska, USA, plume, Oxalic 0.53 Wofsy et al. 1992
3–4 km
Ž .
Alaska, USA, 3–5 km Oxalic 0.24 Wofsy et al. 1992
Ž . Ž .
High Arctic )60 N , Oxalic 0.22"0.14 Talbot et al. 1992
boundary layer
Ž . Ž .
High Arctic )60 N , Oxalic 0.17"0.10 Talbot et al. 1992
free troposphere
Ž . Ž .
Sub-Arctic 50–60 N , Oxalic 0.33"0.29 Talbot et al. 1992
boundary layer
Ž . Ž .
Sub–Arctic 50–60 N , Oxalic 0.21"0.12 Talbot et al. 1992
free troposphere
Ž .
Los Angeles, USA Propanoic 4"3 0.3"0.06 7.5 Kawamura et al. 1985
Ž .
Barrow, AK Propanoic 0.3"0.1 32 Li and Winchester 1989
Ž .
Alaska, USA, plume, MSA 0.45 Wofsy et al. 1992
2.2 km
Ž .
Alaska, USA, 4–5 km MSA -0.04 Wofsy et al. 1992
Ž .
Alaska, USA, plume, MSA -0.04 Wofsy et al. 1992
3–4 km
Ž .
Alaska, USA, 3–5 km MSA -0.04 Wofsy et al. 1992
Ž .
Amazon, Brazil, boun- MSA 0.25"0.07 84 Andreae et al. 1988b
dary layer
Ž .
Amazon, Brazil, MSA 0.08"0.03 75 Andreae et al. 1988b
free troposphere
a Ž .
Ž
composition, and surface characteristics Mason, 1971; Twomey, 1977; Andreae et al.,
.
1995 . The nucleation properties of water-soluble inorganic aerosols, such as sulfate and chloride, are well documented. However, until recently, the nucleation properties of organic aerosols have not received much attention. This is partly because chemical composition of particulate organic matter itself is poorly understood. In the continental
Ž .
US, White 1990 reported that organic compounds typically accounted for 20–50% of
Ž .
total fine particle mass concentration. Cadle and Groblicki 1982 found that on average about 40% of total organic mass was water soluble for samples collected at Denver, CO.
Ž .
The recent study of Zappoli et al. 1999 shows that organic compounds account for ca.
Ž
50% of the total water soluble fraction of the fine aerosol -1.5 mm, aerodynamic
.
diameter and that ca. 80% of the total organic compounds is water soluble at a
Ž . Ž .
background site Aspvreten, Central Sweden . Zappoli et al. 1999 also found that over 70% of the organic compounds in the fine aerosol are of polar nature. Among the organic compounds, identified in urban environments using gas chromatographyrmass
Ž .
spectroscopy GCrMS , are low-molecular weight aliphatic dicarboxylic acids, and
Ž .
high-molecular-weight alkanes Rogge et al., 1993 . Typically, however, only about 10% of total organic mass was identified, and approximately 50% of organic mass either did not extract in organic solvents or did not elute in the GC column used, and the remaining 40% could not be resolved into specific molecular entities by GCrMS
ŽRogge et al., 1993 . On the other hand, ion chromatography IC analysis shows that. Ž .
the most frequently observed organic species in the condensed phase in the atmosphere are low molecular weight monocarboxylic and dicarboxylic acids, with monocarboxylic acids much more abundant than dicarboxylic acids. Of monocarboxylic acids, formic and acetic acids are the dominant species, which have most frequently been observed in
Ž .
precipitation Keene and Galloway, 1988; Yu et al., 1991a,b, 1992, 1998 , cloudwater
Ž . Ž
and fogwater Weathers et al., 1986; Yu et al., 1991a,b , gaseous phase Dawson et al.,
. Ž .
1980; Yu et al., 1990 , and in aerosols Andreae et al., 1988a,b .
Ž .
The origin and nature of cloud condensation nuclei CCN recently have become one of the central issues in climate change because CCN strongly modulate cloud
mi-Ž
crostructure and hence the radiative properties of clouds Charlson et al., 1987; Yu,
. Ž .
1996 . Observations by Desalmand et al. 1982 showed that vegetation could produce
Ž .
CCN. Novakov and Penner 1993 indicated that ;37% of CCN number concentration measured at a marine site could be accounted for by total sulfates and the remaining
Ž .
63% by organic aerosols. Measurements by Hegg et al. 1995b also showed that most CCN over the northeastern Atlantic coast of the United States were not sulfates. Saxena
Ž .
et al. 1995 found that organics could enhance water absorption by inorganics at a
Ž .
nonurburn location Grand Canyon . It is in order here to ask: what are the chemical components of CCN produced by vegetation and the chemical components of organic aerosols that act as CCN and alter hygroscopic behavior of atmospheric particles? Presently this question cannot be answered.
The purposes of this study are to review the current state of knowledge of water-solu-ble organic acids in the atmosphere, analyze the extent to which organic acids actually act as CCN, and identify the major unknowns in this field. We will focus principally on formic and acetic acids for two reasons. First, formic and acetic acids are found to be
Ž .
Ž
are usually more than one order of magnitude higher than others such as propionic,
. Ž
butyric, pyruvic and lactic acids Andreae et al., 1987; Keene and Galloway, 1988; Yu
.
et al., 1991a,b . Second, there are a lot of available experimental results regarding the occurrence, sources and sinks of formic and acetic acids in the gas, aerosol and liquid
Ž .
phases precipitation, cloud and fog . The role of pyruvic and oxalic acids in the formation of organic CCN is analyzed as well.
2. Current state of knowledge of water-soluble organic acids in the troposphere
The role of organic acids as chemical constituents in the troposphere has become an issue of growing interest in the past two decades. An excellent review and discussion of the occurrence, sources and sinks of organic acids in the troposphere has been presented
Ž .
by Chebbi and Carlier 1996 . Organic acids can be directly emitted by vegetation
ŽKeene and Galloway, 1988; Yu et al., 1988; Talbot et al., 1990; Kavouras et al., 1998 ..
Ž .
Natural biomass-burning Andreae et al., 1988b; Talbot et al., 1988a,b , atmospheric
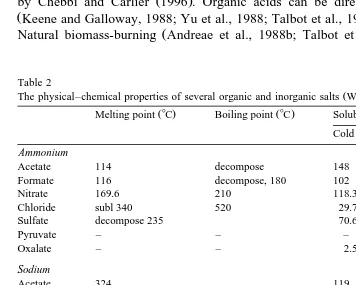
Table 2
Ž .
The physical–chemical properties of several organic and inorganic salts Weast, 1978 3
Ž . Ž .
Melting point 8C Boiling point 8C Solubility in gr100 cm Cold water Hot water
Ammonium
Acetate 114 decompose 148 decompose
Formate 116 decompose, 180 102 531
Nitrate 169.6 210 118.3 871
Chloride subl 340 520 29.7 75.8
Sulfate decompose 235 70.6 103.8
Pyruvate – – – –
Oxalate – – 2.5 11.8
Sodium
Acetate 324 119 170.15
Formate 253 decompose 97.2 160
Nitrate 306.8 decompose, 380 92.1 180
Chloride 801 1413 35.7 39.12
Sulfate 884 s 42.5
Pyruvate – – – –
Oxalate 3.7 6.33
Potassium
Acetate 292 – 253 492
Formate 167.5 decompose 331 657
Nitrate 334 decompose, 400 13.3 247
Chloride 770 subl, 1500 34.4 56.7
Sulfate 558 1689 12 24.1
Pyruvate – – – –
Oxalate – – 28.7 83.2
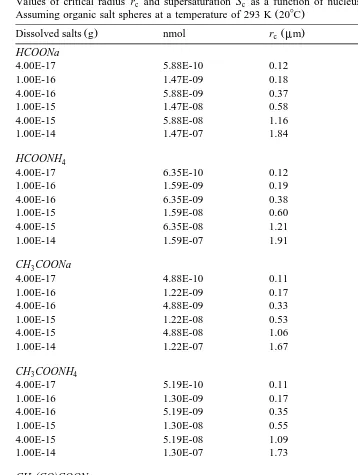
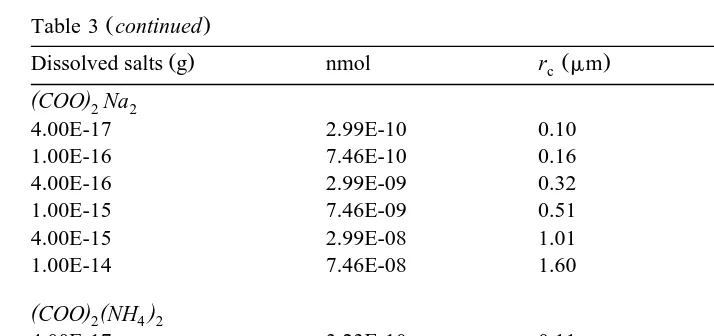
Table 3
Values of critical radius r and supersaturation S as a function of nucleus mass of different organic salts.c c Ž .
Assuming organic salt spheres at a temperature of 293 K 208C
U
Ž . Ž . Ž . Ž .
Dissolved salts g nmol rc mm Sc S y1 %
HCOONa
4.00E-17 5.88E-10 0.12 0.65
1.00E-16 1.47E-09 0.18 0.41
4.00E-16 5.88E-09 0.37 0.20
1.00E-15 1.47E-08 0.58 0.13
4.00E-15 5.88E-08 1.16 0.06
1.00E-14 1.47E-07 1.84 0.04
HCOONH4
4.00E-17 6.35E-10 0.12 0.62
1.00E-16 1.59E-09 0.19 0.39
4.00E-16 6.35E-09 0.38 0.20
1.00E-15 1.59E-08 0.60 0.12
4.00E-15 6.35E-08 1.21 0.06
1.00E-14 1.59E-07 1.91 0.04
CH COONa3
4.00E-17 4.88E-10 0.11 0.71
1.00E-16 1.22E-09 0.17 0.45
4.00E-16 4.88E-09 0.33 0.22
1.00E-15 1.22E-08 0.53 0.14
4.00E-15 4.88E-08 1.06 0.07
1.00E-14 1.22E-07 1.67 0.04
CH COONH3 4
4.00E-17 5.19E-10 0.11 0.69
1.00E-16 1.30E-09 0.17 0.44
4.00E-16 5.19E-09 0.35 0.22
1.00E-15 1.30E-08 0.55 0.14
4.00E-15 5.19E-08 1.09 0.07
1.00E-14 1.30E-07 1.73 0.04
( )
CH CO COONa3
4.00E-17 3.64E-10 0.09 0.82
1.00E-16 9.09E-10 0.14 0.52
4.00E-16 3.64E-09 0.29 0.26
1.00E-15 9.09E-09 0.46 0.16
4.00E-15 3.64E-08 0.91 0.08
1.00E-14 9.09E-08 1.44 0.05
( )
CH CO COONH3 4
4.00E-17 4.00E-10 0.09 0.80
1.00E-16 1.00E-09 0.15 0.51
4.00E-16 4.00E-09 0.30 0.25
1.00E-15 1.00E-08 0.47 0.16
4.00E-15 4.00E-08 0.93 0.08
Ž .
Table 3 continued
U
Ž . Ž . Ž . Ž .
Dissolved salts g nmol rc mm Sc S y1 %
(COO Na)2 2
4.00E-17 2.99E-10 0.10 0.74
1.00E-16 7.46E-10 0.16 0.47
4.00E-16 2.99E-09 0.32 0.23
1.00E-15 7.46E-09 0.51 0.15
4.00E-15 2.99E-08 1.01 0.07
1.00E-14 7.46E-08 1.60 0.05
(COO) (2NH4 2)
4.00E-17 3.23E-10 0.11 0.71
1.00E-16 8.06E-10 0.17 0.45
4.00E-16 3.23E-09 0.33 0.23
1.00E-15 8.06E-09 0.53 0.14
4.00E-15 3.23E-08 1.05 0.07
1.00E-14 8.06E-08 1.66 0.05
Ž .
oxidation of biogenic isoprene Jacob and Wofsy, 1988 , olefins and hydrocarbons
ŽMadronich and Calvert, 1990 are thought to be the secondary sources of organic acids. Ž
in the atmosphere. Formic acid can be produced by oxidation of HCHO Chameides and
.
Davis, 1983 , which is one of the oxidation products of DMS in the marine atmosphere.
Ž .
Saxena and Hildmann 1996 constructed a list of candidate water-soluble organic compounds in atmospheric particles on the basis of the compilation of Graedel et al.
Ž1986 . Among organic compounds that are completely miscible with water are mono-.
Ž .
carboxylic acids and alcohols complete miscibility up to C4 or C ; diols and triols5
Žcomplete miscibility up to C ; and keto-carboxylic acids complete miscibility up to7. Ž
. Ž .
C4 Saxena and Hildmann, 1996 . On the basis of theoretical analysis of air–water equilibrium, they concluded that C –C monocarboxylic acids, alcohols, carbonyls and1 6 ethers were too volatile to be distributed in the fine particles, and would be completely partitioned into the gas phase. This result seems consistent with that of the model
Ž .
calculation of Meng et al. 1995 . However, as pointed out by Saxena and Hildmann
Ž1996 , there are some discrepancies between their theoretical assessments and observa-.
tions. They thought that this might be due to modification of the air–water distribution of these compounds as a result of aqueous phase reactions andror the presence of an organic film. Dicarboxylic acids, ketoacids and dicarbonyls, which were thought to be
Ž .
present in the aerosol phase Saxena and Hildmann, 1996 , constituted only a small fraction of the total particulate water-soluble organic compounds in the atmosphere. For
Ž .
example, Rogge et al. 1993 indicated that water-soluble dicarboxylic acids accounted for approximately 2 to 4% of total particulate organic mass.
Table 1 summarizes the published aerosol and gaseous carboxylic acids in different parts of the world. Organic acids have been measured over a wide range of environ-ments, e.g., marine and continental air, free atmosphere and surface layer, urban as well as remote atmospheres. There is a general consensus that formic and acetic acids
Ž .
The concentrations of formic and acetic acids in the gas phase ranged from 0.8 to 531 nmol my3 and 1.2 to 653 nmol my3, respectively. Unlike the gas phase data, relatively few measurements of aerosol-phase carboxylic acids have been reported. Table 1 shows that the concentrations of formate and acetate in the aerosols were typically in 0.02–5.3
y3 Ž y1 5 y13 y3 .
nmol m 1.36=10 –3.60=10 g cm , assuming sodium salts and 0.03–12.4
y3 Ž y1 5 y12 y3 .
nmol m 2.46=10 –1.02=10 g cm , assuming sodium salts ranges,
respec-Ž .
tively. Table 1 also shows that between 34% to 77% average 58% of formate and
Ž .
between 21 to 66% average 45% of acetate were present in the fine fraction. On the basis of simultaneously available measurements of data on aerosol and gas phase shown in Table 1, only about 2% of total formic acid and about 1% of total acetic acid are present in the aerosol phase. It indicates that the phase-partitioning is as much a function of the aerosol substrate as it is of the gas equilibrium vapor pressure.
Ž Ž . . Ž .
The results for pyruvic acid CH C3 -O COOH , oxalic acid HOOCCOOH , MSA
ŽCH S O OH3 Ž 2. . and propanoic acids ŽCH CH COOH3 2 . in the gaseous and aerosol phases are listed in Table 1. The pyruvate and oxalate concentrations in the aerosols
y3 Ž y1 5 y14 y3
were in the ranges of 0.03–0.6 nmol m 3.3=10 –6.6=10 g cm , assuming
. y3 Ž y1 4 y13 y3
sodium salts and 0.17–1.8 nmol m 2.28=10 –2.41=10 g cm , assuming
.
sodium salts , respectively. Smog chamber experiments showed that pyruvic acid was
Ž . Ž .
formed by photo-oxidation of o-cresol Grosjean, 1984 . Jacob and Wofsy 1988 reported that photochemical oxidation of isoprene, which was emitted directly in large
Ž .
quantities from trees and other plants Lamb et al., 1985 , was likely to be the predominant source of pyruvic acid in the atmosphere. Of the dicarboxylic acids, oxalic
Ž .
acid C2 was found to be the most abundant diacid species in the gaseous and aerosol
Ž . Ž . Ž
phases, followed by malonic acid C3 or succinic acid C4 Sempere and Kawamura,
.
1994 . Pyruvic and oxalic acids are mostly associated with aerosol particles due to their low vapor pressures. It is of interest to note that levels of organic acids are lower in the remote marine atmosphere than in the continental atmosphere or highly polluted urban areas. Organic acids are significantly enriched in the aerosol and gas phases derived from biomass burning plume.
3. The extent to which organic acids act as CCN
3.1. Aerosol organic salts as CCN
Ž .
Theoretical considerations of water vapor condensation Dufour and Defay, 1963 shows that there is a well-determined relationship between physical and chemical properties of the particles and their activities in the condensation process. Larger and more hygroscopic particles have lower critical supersaturations than smaller and less water-soluble ones.
Ž .
the traditional Kohler theory Twomey, 1977 . Table 3 lists the calculation results of the
¨
Ž . Ž .
critical radii rc and supersaturations Sc for droplets containing different dissolved
Ž .
organic salts. The laboratory study of Corrigan and Novakov 1999 indicated that the
Ž .
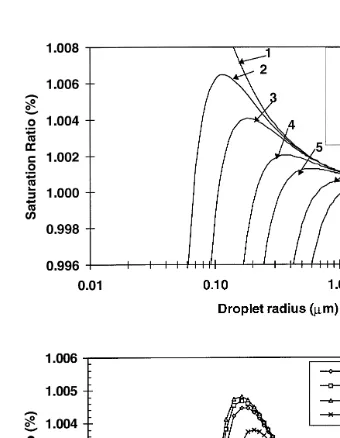
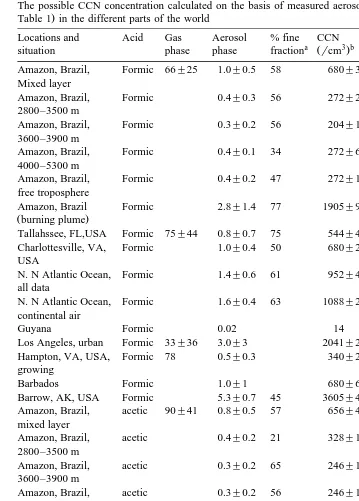
Fig. 1. a Saturation ratio vs. droplet size for droplets containing different mass of sodium formate at 208C.
Ž .b Comparison of relationships between saturation ratio and droplet size for droplets containing differnet
Ž y1 6 .
Table 4
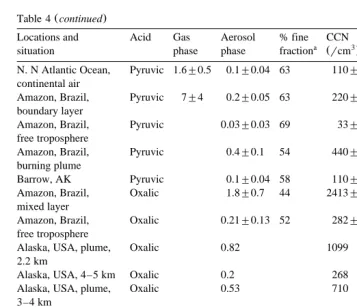
Ž 3. Ž The possible CCN concentration calculated on the basis of measured aerosol organic salts nmolrm from
.
Table 1 in the different parts of the world
Locations and Acid Gas Aerosol % fine CCN Authors
a Ž 3 b.
situation phase phase fraction rcm
Ž .
Amazon, Brazil, Formic 66"25 1.0"0.5 58 680"340 Andreae et al. 1988a Mixed layer
Ž .
Amazon, Brazil, Formic 0.4"0.3 56 272"204 Andreae et al. 1988a 2800–3500 m
Ž .
Amazon, Brazil, Formic 0.3"0.2 56 204"136 Andreae et al. 1988a 3600–3900 m
Ž .
Amazon, Brazil, Formic 0.4"0.1 34 272"68 Andreae et al. 1988a 4000–5300 m
Ž .
Amazon, Brazil, Formic 0.4"0.2 47 272"136 Andreae et al. 1988a free troposphere
Ž .
Amazon, Brazil Formic 2.8"1.4 77 1905"952 Andreae et al. 1988a
Žburning plume.
Ž .
Tallahssee, FL,USA Formic 75"44 0.8"0.7 75 544"476 Andreae et al. 1987
Ž .
Charlottesville, VA, Formic 1.0"0.4 50 680"272 Andreae et al. 1987 USA
Ž .
N. N Atlantic Ocean, Formic 1.4"0.6 61 952"408 Andreae et al. 1987 all data
Ž .
N. N Atlantic Ocean, Formic 1.6"0.4 63 1088"272 Andreae et al. 1987 continental air
Ž .
Guyana Formic 0.02 14 Gregory et al. 1986
Ž .
Los Angeles, urban Formic 33"36 3.0"3 2041"2041 Kawamura et al. 1985
Ž .
Hampton, VA, USA, Formic 78 0.5"0.3 340"204 Talbot et al. 1988b growing
Ž .
Barbados Formic 1.0"1 680"680 Talbot et al. 1986
Ž .
Barrow, AK, USA Formic 5.3"0.7 45 3605"476 Li and Winchester 1989
Ž .
Amazon, Brazil, acetic 90"41 0.8"0.5 57 656"410 Andreae et al. 1988a mixed layer
Ž .
Amazon, Brazil, acetic 0.4"0.2 21 328"164 Andreae et al. 1988a 2800–3500 m
Ž .
Amazon, Brazil, acetic 0.3"0.2 65 246"164 Andreae et al. 1988a 3600–3900 m
Ž .
Amazon, Brazil, acetic 0.3"0.2 56 246"164 Andreae et al. 1988a 4000–5300 m
Ž .
Amazon, Brazil, acetic 0.3"0.2 50 246"164 Andreae et al. 1988a free troposphere
Ž .
Amazon, Brazil, acetic 2.0"0.6 66 1639"492 Andreae et al. 1987 Burning plume
Ž .
Guyana acetic 0.03 25 Gregory et al. 1986
Ž .
Los Angeles, USA acetic 50"45 2.0"3 1639"2460 Kawamura et al. 1985
Ž .
Hampton, VA, USA acetic 5–166 0.3"0.1 246"82 Talbot et al. 1988b
Ž .
Barbados acetic 0.7"1.0 574"820 Talbot et al. 1986
Ž .
Barrow, AK, USA acetic 12.4"2.2 31 10164"1803 Li and Winchester 1989
Ž .
Tallahssee, FL, USA Pyruvic 2.2"2.5 0.3"0.2 53 330"220 Andreae et al. 1987
Ž .
Charlottesville, VA, Pyruvic 3.6"1.3 0.6"0.1 68 660"110 Andreae et al. 1987 USA
Ž .
Ž .
Table 4 continued
Locations and Acid Gas Aerosol % fine CCN Authors
a Ž 3 b.
situation phase phase fraction rcm
Ž .
N. N Atlantic Ocean, Pyruvic 1.6"0.5 0.1"0.04 63 110"44 Andreae et al. 1987 continental air
Ž .
Amazon, Brazil, Pyruvic 7"4 0.2"0.05 63 220"55 Andreae et al. 1987 boundary layer
Ž .
Amazon, Brazil, Pyruvic 0.03"0.03 69 33"33 Andreae et al. 1987 free troposphere
Ž .
Amazon, Brazil, Pyruvic 0.4"0.1 54 440"110 Andreae et al. 1987 burning plume
Ž .
Barrow, AK Pyruvic 0.1"0.04 58 110"44 Li and Winchester 1989
Ž .
Amazon, Brazil, Oxalic 1.8"0.7 44 2413"938 Talbot et al. 1988a mixed layer
Ž .
Amazon, Brazil, Oxalic 0.21"0.13 52 282"174 Talbot et al. 1988a free troposphere
Ž .
Alaska, USA, plume, Oxalic 0.82 1099 Wofsy et al. 1992
2.2 km
Ž .
Alaska, USA, 4–5 km Oxalic 0.2 268 Wofsy et al. 1992
Ž .
Alaska, USA, plume, Oxalic 0.53 710 Wofsy et al. 1992
3–4 km
Ž .
Alaska, USA, 3–5 km Oxalic 0.24 322 Wofsy et al. 1992
Ž . Ž .
High Arctic )60 N , Oxalic 0.22"0.14 295"188 Talbot et al. 1992 boundary layer
Ž . Ž .
High Arctic )60 N , Oxalic 0.17"0.10 228"134 Talbot et al. 1992 free troposphere
Ž . Ž .
Sub-Arctic 50–60 N , Oxalic 0.33"0.29 442"389 Talbot et al. 1992 boundary layer
Ž . Ž .
Sub–Arctic 50–60 N , Oxalic 0.21"0.12 282"161 Talbot et al. 1992 free troposphere
a Ž .
Fraction of organic ions in the fine particles aerodynamic diameter-1.0mm . b
Calculated by assuming that one of CCN only contained 10y1 6g organic salt.
conventional Kohler theory for single component particles could be used to approxi-
¨
mately predict critical diameters for organic compounds that are highly water-soluble. Fig. 1a shows the results of calculation for different masses of sodium formate. Similar figures as Fig. 1a can be drawn for all organic salts in Table 2. Table 3 shows that the critical supersaturations are in the range 0.04% to 0.71% for formate and acetate salts in the mass range 10y1 4 to 10y1 7g, corresponding to the critical radius range 0.11 to 1.91
mm. For pyruvate and oxalate salts in the mass range 10y1 4 to 10y1 7 g, the critical supersaturations are in the range 0.05% to 0.82%, corresponding to the critical radius range of 0.09 to 1.66 mm. Fig. 1b shows the comparison of relationships between saturation ratio and droplet size for droplets containing different organic and inorganic
Ž y1 6 .
salts with the same nuclear mass 10 g . Note that the differences among these curves are very small.
the contribution of organic salts to CCN concentration, we assume that the aerosol components are external mixtures and that one CCN particle contains only 10y1 6 g
Ž .
aerosol organic salts assuming sodium salts . This assumption was made for the sake of comparison, although one might expect that some organic nuclei could contain more or less than 10y1 6 g mass. The critical supersaturations for droplets containing different organic salts with a mass of 10y1 6 g can be found in Table 3. We can calculate the concentrations of CCN in the atmosphere by using the aerosol organic data in Table 1. The calculation results are summarized in Table 4. Table 5 lists the results of CCN observations at 0.1% and 0.5% supersaturations carried out under the different condi-tions. A close inspection of Tables 3–5 indicates that CCN sources from aerosol organic salts are comparable to the CCN concentrations observed in the different environments. Unfortunately, most studies in Table 4 did not simultaneously observe CCN concen-trations at the locations selected. The exceptions are the studies of Li and Winchester
Ž1989 and Liu et al. 1996 . In the experiments made at Chebogue point, Nova Scatia,. Ž . Ž .
Liu et al. 1996 simultaneously measured major inorganic ions and organic ions
Žformate, acetate, oxalate, pyruvate, MSA, propionate, glyoxalate, glycoaldehyde and
.
formaldehyde in the aerosol particles and CCN concentrations at 0.06% and 0.4% supersaturations. They found that the three most abundant species of the measured organics in their experiments were oxalate, MSA and acetate, but formate and other
Ž . y
organics were low. Liu et al. 1996 reported that particulate CH COO3 and oxalate
y3Ž y3.
concentrations were -0.3–3.3 nmol m -0.02–0.19mg m and -0.3–4.6 nmol
y3 Ž y3. 2y
m -0.03–0.36 mg m , respectively. The particulate nss-SO4 concentration
Ž . y3 Ž y3.
reported by Liu et al. 1996 was 13.5–122.8 nmol m 1.30–11.79mg m . As can be seen from Table 3, the critical supersaturations for 4=10y1 6 g CH COONa
3
Ž4.88=10y9 nmol. and ŽCOO Na. Ž2.99=10y9 nmol. were 0.22% and 0.23% 2 2
respectively. Here, if we assume that one CCN particle contains only 4=10y1 6 g aerosol organic salt, the CCN concentrations would be in the range of -62 to 676 cmy3 from acetate salts and in the range of -100 to 1538 cmy3 from oxalate salts. Total CCN concentration from organic salts would be -162–2214 cmy3. The actual observed CCN concentration at 0.4% supersaturation was in the range 267 to 2619 cmy3
ŽLiu et al., 1996 . Fig. 2 shows the correlation coefficients between the CCN concentra-.
tions at 0.4% and 0.06% supersaturations with oxalate, MSA, and acetate in the aerosol
Ž Ž ..
particles data obtained from Table 2 of Liu et al. 1996 . As can be seen, there are strong linear correlations between the CCN concentrations at 0.4% and 0.06%
supersatu-Ž .
rations and the oxalate concentration. Liu et al. 1996 found that total organics
Žformate, acetate, oxalate, pyruvate, MSA, propionate, glyoxalate, glycoaldehyde and .
formaldehyde strongly correlated with CCN concentration at 0.4% but not at 0.06% supersaturation. This might be due to the fact that soluble organics were present in the smaller particles and that the large fraction of CCN at 0.4% was associated with smaller
Ž .
particles which contributed a small fraction of mass Liu et al., 1996 . Obviously, it is necessary to know the extent to which organic acids are internally mixed with inorganic material such as sulfate that can act as CCN to accurately estimate the contribution of
Ž 4 y3.
organic acids to the CCN population. Very high i.e., 10 cm condensation nuclei
Table 5
The concentrations of CCN at two different supersaturations as observed at the ground level under the different conditions
Ž .
Locationrconditions 0.10% 0.50% Author s
Marine air
Ž .
Sydney, maritime air 80 150 Twomey 1959
Ž .
Hawaii, oceanic air 25 65 Jiusto 1967
Ž .
N. S. Atlantic Ocean, oceanic air 32 71 Twomey and Wojciechowski 1969
Ž .
N. S. Pacific Ocean, oceanic air 30 109 Dinger et al. 1970
Ž .
N. S. Pacific Ocean, oceani air 13 102 Hoppel et al. 1973
Ž .
N. Atlantic Ocean, oceanic air 40 123 Saxena and Fukuta 1976
Ž .
Cape Grim, Astralia, maritime air 56 106 Gras 1990
Ž .
N. Atlantic Ocean, oceanic air 79 177 Hoppel et al. 1990
Ž .
N. Pacific Ocean, oceanic air 7 34 Hegg et al. 1991
Ž .
Arctic Ocean, oceanic air 9 29 Hegg et al. 1995a
Ž .
Palmer Station, Antarctica, January 95 131 DeFelice et al. 1997
Ž .
Palmer Station, Antarctica, February 12 60 DeFelice et al. 1997
Ž .
North China, over sea 100 Wang 1988
Continental air
Ž .
Sydney, continental air 300 630 Twomey 1959
Ž .
California, unpolluted continental air 120 700 Hudson 1980
Ž .
Lannemezan, France, country air 300 670 Jiusto and Kocmond 1968
Ž .
Valladolid, Spain, country air, W wind 370 730 Garcia et al. 1981
Ž .
Valladolid, Spain, country air, E wind 520 1200 Garcia et al. 1981
Ž .
Rolla, Missouri, nonindustrial town 700 2300 Alofs and Lin 1981
Ž .
Ivory Coast, dry season – 1960 Desalmand et al. 1982
Ž .
Ivory Coast, subequatorial monsoon – 1660 Desalmand et al. 1982
Ž .
Switzerland, mixed continental air 600 3800 Wieland 1955
Ž .
North China, rural area 1000 Wang 1988
Ž .
Lamto, West africa, Savannah continental 1128 2700 Desalmand et al. 1985
Polluted air
Ž .
San Diego. California, urban air 400 2000 Hudson 1980
Ž .
Buffalo, N.Y. polluted air 550 1800 Jiusto and Kocmond 1968
Ž .
Near Jerusalem, 180 930 Terliuc and Gagin 1971
Ž .
North China, polluted air in city 10 000 Wang 1988
Ž .
EL Yunque, Puerto Rico, polluted marine air 558 Novakov and Penner 1993
Burning plume
Ž .
Abidjan, West Africa, bushfire event 5117 8030 Desalmand et al. 1985
Ž .
Petterlong, Canada, fire plume 1164 14 468 Hudson et al. 1991
experiment, was as high as 1=104 cmy3. This values is close to the estimation of
Ž 4 y3.
organic CCN 1.4=10 cm in Table 4 on the basis of the organic salt data of Li and
Ž .
Winchester 1989 , who measured organic salts in the same AGASP-II field experiment period.
Ž .
Ž .
Fig. 2. a The correlation coefficients between CCN concentration at 0.4% supersaturation and acetate, MSA,
Ž .
Oxalate. b The correlation coefficients between CCN concentration at 0.06% supersaturation and acetate,
Ž Ž ..
MSA, Oxalate from Table 2 of Liu et al. 1996 .
during a ship cruise over the Atlantic. In their infrared spectrum of CCN samples, there was an absorption peak appearing around the frequency of ;1600 cmy3. They thought it was indicative of an organic ester-like material that was water soluble. Formate and
Ž
acetate have been frequently observed in cloudwater and fog water Weathers et al.,
.
y1 y1 Ž .
;1580 cm and ;1413 cm , respectively Marley et al., 1993 . So it is reasonable to infer that formate was the organic material of the CCN reported by Fukuta and
Ž .
Saxena 1975 . Organic esters are often less soluble. It is currently assumed that organic
Ž .
esters are non-CCN related contaminants Williams et al., 1994 . This result might suggest that formate be a component of CCN.
Ž .
It is of interest to note the study of Matsumoto et al. 1997 about the contribution of particulate sulfates and organic carbon to CCN in the marine atmosphere. They found
Ž
that not only sulfates but also water-soluble organic salts formate, acetate, oxalate and
. Ž .
MSA were dominant in fine aerosols aerodynamic diameter -1.1mm . There was a
Ž
significant correlation between total water soluble organic salt formate, acetate, oxalate
.
and MSA concentrations and CCN concentrations at 1% and 0.5% supersaturations
ŽMatsumoto et al., 1997 . Their results also showed that the soluble organic salts. Žformate, acetate, oxalate and MSA were relatively more predominant than nss-sulfate.
and made a significant contribution to CCN number concentration under the lower
Ž .
sulfate conditions. Cruz and Pandis 1997 reported that pure glutaric acid and adipic acid aerosols did act as CCN and their behaviors were analogous to those of inorganic salts, as observed in the shape of the activation curves. They also reported that no CCN
Ž .
activity was observed for water-insoluble dioctylphthalate DOP for dry particle diameters as large as 0.15mm at a supersaturation as high as 1.2%. Since glutaric and adipic acids can be formed from the oxidation of unsaturated cyclic olefins, as indicated
Ž . Ž .
by smog chamber experiments Grosjean, 1977 , the results of Cruz and Pandis 1997 confirm some sources of CCN from the photochemical oxidation of organic compounds.
Ž
A major part of CCN in the atmosphere is water-soluble compounds Hobbs et al.
.
1974; Meszaros, 1988 . Organic salts have strong polarity, surface activity, solubility
Ž .
and affinity for water Weast, 1978; Keene and Galloway, 1988 . Since specific characteristics are required for an aerosol particle to become a CCN in the atmosphere
Ži.e., to have a critical supersaturation Sc-2%. ŽHegg and Hobbs, 1992 , it is to be.
expected that only a small fraction of aerosol particles could serve as CCN. Some observed ratios of the concentration of CCN active at 1% supersaturation to the concentration of CN at various locations, and those for smoke particles from different fuel combustion are listed in Table 6. It can be seen that a high total aerosol concentration does not necessarily coincide with a high concentration of CCN, and that
Ž . Ž .
the activated fraction N CCNrN CN of aerosols not only depends on the soluble fraction but also on the properties of soluble constituents of aerosol particles and particle sizes. In so far as organic acids have the same activity as inorganic acids or salts, they will have precisely the same impact on CCN activity.
A comprehensive study of CCN concentrations over various parts of the world showed that near the earth’s surface continental air masses are generally significantly
Ž .
()
S.
Yu
r
Atmospheric
Research
53
2000
185
–
217
Table 6
Ž . Ž . Ž q q q y y
Comparison of N CCNrN CN activated fraction of aerosol particles which contain formate, acetate and other soluble inorganic ions Na , NH , K , Cl , NO ,4 3
2y. Ž .
SO4 CCN at 1% supersaturation
y3 y3
Ž . Ž . Ž . Ž . Ž .
Location or fuel types for combustion CN cm CCN cm N CCNrN CN Soluble ions meqrg Cited references.
Washington, DC 78 000 2000 0.026 r Pruppacher and Klett, 1978
68 000 2000 0.029 r Pruppacher and Klett, 1978
57 000 5000 0.088 r Pruppacher and Klett, 1978
50 000 7000 0.14 r Pruppacher and Klett, 1978
Ž .
Long Island NY 51 000 220 0.0043 r Pruppacher and Klett, 1978
18 000 110 0.0061 r Pruppacher and Klett, 1978
6500 150 0.023 r Pruppacher and Klett, 1978
5700 30 0.0052 r Pruppacher and Klett, 1978
Yellowstone National Park, WWY 1000 15 0.015 r Pruppacher and Klett, 1978
Pine wood, smoldering 500 000 120 000 0.24 1.3–3.8 Hudson et al., 1991; Hallett et al., 1989
Pine wood, flaming 60 000 43 000 0.72 1.3–3.8 Hudson et al., 1991; Hallett et al., 1989
Chaparral, brush mixture 136 000 115 000 0.85 1.3–3.8 Hudson et al., 1991; Hallett et al., 1989
JP-4 aviation fuel 543 000 4343 0.008 r Hudson et al., 1991; Hallett et al., 1989
JP-4 aviation fuel 433 000 4332 0.01 r Hudson et al., 1991; Hallett et al., 1989
Sweet crude oil, low sulfur 129 000 8000 0.06 1.25 Rogers et al., 1991
Light crude oil, high-sulfur 155 000 11 500 0.07 1.22 Rogers et al., 1991
Acetylene gas, welding torch r r 0.49–0.53 3.13 Hallett et al., 1989
Diesel, diffuse flaming r r 0.42 0.094 Lammel and Novakov, 1995
continental origin. On the other hand, the results of concentrations of formate and acetate in precipitation from 16 widely spaced continental and marine locations showed
ŽKeene and Galloway, 1988 that organic acids exhibited higher concentrations in.
continental precipitation than in marine precipitation. The results in Table 1 also show that continental air masses are generally richer in organic acids than are marine air masses. The fact that formate and acetate were principal chemical components of
Ž .
precipitation in the remote continent Keene and Galloway, 1988 also implies that at least part of the components of CCN in the remote continental areas might be organic acids.
Ž .
The lifetime of CCN in the atmosphere is on the order of a few days Junge, 1972 . The atmospheric lifetimes of formate and acetate are also on the order of several hours
Ž .
to a few days Keene and Galloway, 1988 . For seasonal cycles, formate and acetate concentrations in the gas and precipitation show a strong seasonal cycle with higher concentrations in the growing season and lower concentrations in the non-growing
Ž .
season Keene and Galloway, 1988 . The CCN concentration also shows a strong seasonal cycle with higher concentrations in the growing season and lower
concentra-Ž .
tions in the non-growing season Desalmand et al. 1982 .
Ž .
Perhaps the most convincing evidence that NH4 2SO was the active CCN compo-4 nent was from the volatility experiments in which an aerosol sample was heated prior to
Ž .
entering a supersaturated cloud chamber Twomey, 1968 . Depending on their volatility, some particles evaporated in the tube leading to a reduction in the concentration of CCN
Ž . Ž .
at about the volatilization temperature of NH4 2SO4 ;3208C . This experimental technique was very useful for ruling out NaCl as a dominant CCN material, even over
Ž . Ž .
the ocean Dinger et al., 1970 . Dinger et al. 1970 observed that all CCN were found
Ž .
to be volatile at about 3208C above a stable air layer about 3 km in experiments over the North Atlantic and over the east coast of Barbados. Table 2 lists the melting and boiling points of several common organic and inorganic salts. The data from Table 2
Ž .
show that NH4 2SO melts at 2354 8C and decomposes into NH3 and H SO at this2 4
Ž .
temperature. All salts except NaCl, Na SO , KNO , KCl, and K SO2 4 3 2 4 in Table 2 will melt at a temperature above 3208C. Some of them, such as organic salts, also decompose at this temperature. So the volatility experiments cannot rule out these substances as CCN components and are not sufficient to obtain the conclusion that the major
Ž .
component of CCN is NH4 2SO . All these above mentioned similar characteristics4 between CCN and organic acids make organic acids a good candidate for CCN in the troposphere.
3.2. Organic acids in the gas phase to form particles
As shown in Table 1, most volatile organic acids are present in the gas phase in the atmosphere, and on average about 56"14% of organic salts are present in the size fraction below 1.0mm diameter. It has been found that aerosol particles in the size range 0.01 to 1.0mm diameter grow principally by gas-to-particle conversion, the process by which vapor molecules diffuse to the surface of a particle and are subsequently
Ž .
salts are at least partly of secondary origin. Organic acids like formic and acetic acids have strong solubility and surface activity, and can be incorporated into the aerosol
Ž .
particles by adsorption on the particle surfaces Andreae et al., 1988a . Both alkaline mineral particles and organic materials must be expected to have a relatively high affinity for volatile organic acids, especially if their surfaces are wetted by water films. Organic acids are not expected to be driven out of the aerosol phase by strong involatile
Ž
acids such as sulfuric acid, which is present in aerosols in polluted areas Andreae et al.,
. Ž .
1988a . This point of view was supported by the results of Andreae et al. 1987 that indicated no significant difference in the gasraerosol partitioning of organic acids between the Amazon areas and polluted regions.
A critical problem here is whether alkaline mineral particles such as Na CO2 3 or
Ž .
organic materials such as elemental carbon EC are necessary for organic acid vapors to form organic particles. To answer this, first we try to find if alkaline mineral particles or organic materials are available in the atmosphere. It is found that carbonaceous aerosol
Ž .
particles are ubiquitous in the atmosphere Chow et al., 1993 . A large number of carbon size-distribution measurements performed at several rural and urban locations in the US revealed that about 80% of EC and about 70% of OC were present in particles with diameter -2–2.5mm, and that the average diameters for the fine fraction were 0.28
Ž .
and 0.32mm for EC and OC, respectively Wolff et al., 1982 . Due to their ubiquitous presence, small dimensions, large specific surface and adsorbing properties, EC particles provide sites where organic acids are adsorbed. It is apparent that organic acids in the gas phase can form organic particles with the aid of alkaline mineral particles or organic materials because these materials are ubiquitous in the atmosphere. Surely deliquesced inorganic particles such as NaCl or sulfate would also act as efficient sites for organic
Ž .
acids to condense Wagner et al., 1996 .
It is important to study whether organic acid vapors can form new droplets or particles by interaction between two vapor species without the aid of a foreign nucleus or surface, e.g., by the homogeneous nucleation mechanism under special atmospheric conditions. The conditions favorable for homogeneous-bimolecular nucleation from H SO2 4 and H O vapors are the extremely small total surface area of the ambient2
Ž
aerosols, high concentrations of H SO and H O vapors, and low temperature Kiang et2 4 2
.
al., 1973; Hegg et al., 1990 . Laboratory experiments regarding the homogeneous
Ž .
nucleation of formic, acetic and propanoic acids were reported by Heist et al. 1976 and
Ž . Ž .
Russell and Heist 1978 . Russell and Heist 1978 found that the critical supersaturation of a unary system for the homogeneous nucleation of formic acid was in the range of 4
Ž .
to 6 for temperatures ranging fromy138C to 328C. Heist et al. 1976 reported that the critical supersaturation of a unary system for the homogeneous nucleation of acetic acid was in the range of 2.5 to 5.2 for temperatures ranging from y138C to 678C. In the binary nucleation and condensation experiment of the water–acetic acid system,
Ž .
Studzinski et al. 1986 observed the onset of nucleationrcondensation for this water– acetic acid system over a range of activities for acetic acid of 0 to 7 and for water of 0 to 6 for a condensation temperature range ofy38C to 178C. A nucleation rate of 1=1016
y3 y1 Ž
drops cm s was measured for the acetic acid–water system Studzinski et al.,
.
Ž .
nucleation. The calculation of Yue and Hamill 1979 indicated that the nucleation rates of a H SO –H O binary system at 02 4 2 8C were from ;10y8 to ;1012 cmy3 sy1 in the relative humidity range 1% to 100%, and 0.21E-4 ppbv to 2.08 ppbv H SO vapor. The2 4 H SO –H O binary system has a higher nucleation rate than that of these organic acids2 4 2 because of the low vapor pressure of H SO .2 4
Although classic nucleation theory gives the best explanation of organic acid
Ž
nucleation experiments performed under controlled laboratory conditions Heist et al.,
.
1976; Studzinski et al., 1986 , it may be much different for atmospheric conditions. It is clear that homogeneous nucleationrcondensation of organic acid vapors can occur under some special atmospheric conditions. In the experiments on late winter Arctic aerosols,
Ž .
Li and Winchester 1989 found evidence that high aerosol formate and acetate concentrations were due to condensation of organic acid vapors and the co-condensation of organic acid vapors with NH3 in the low Arctic temperature. They concluded that even at ppt levels for these gases, the equilibrium could produce organic salt particles.
Ž .
Although Li and Winchester 1989 did not mention the homogeneous nucleation of formic and acetic acids, it does not rule out the possibility that this process occurred in the late winter Arctic atmosphere because organic acid concentrations were high and the
Ž .
temperature was very low y258C . It should be emphasized that there is a great lack of thermodynamic data for organic acid species that inhibits a full study of nucleation of the organic acids.
The study of the effect of organic acid vapors on CCN activity has been lacking. However, the effects of inorganic acid vapors such as HNO and HCl have been studied3 recently. Here, these results are discussed because organic acid vapors may work in a similar way as inorganic acid vapors. By using a ‘‘Kohler surface’’ on the basis of two
¨
Ž .
Kelvin equations in the Kohler theory, Kulmala et al. 1993 studied the effect of acid
¨
Ž .
vapor HNO3 on CCN activity. They found that the presence of acid vapor depressed the effective vapor pressure of water over the growing solution droplets. As a result, a higher fraction of aerosol particles can serve as CCN than in an acid-free atmosphere.
Ž .
Laaksonen et al. 1998 has modified the traditional Kohler theory by adding a term to
¨
the Raoult effect to include the effect of soluble gases and slightly soluble aerosol substances. However, there are some technical limitations in this modification.
Kermi-Ž .
nen et al. 1997 have studied the role of NH , H SO , HNO3 2 4 3 and HCl in the condensational growth of freshly nucleated particles in the lower troposphere. Kerminen
Ž .
et al. 1997 found that the growth of these freshly nucleated particles was dictated initially by the flux of sulfuric acid into the particles and whether or not the HNO3rHCl-driven condensation depended on the partial pressure product of NH and3 HNO3rHCl, the ambient temperature and relative humidity. They suggested that the condensable volatile vapors had preferentially condensed on the pre-existing particles instead of causing particle formation. This seems consistent with the field experimental
Ž .
results of Marti et al. 1997 , who studied the relative contributions of SO and organic2
Ž
precursors to the formation of ultrafine particles at a remote continental site Idaho Hill,
. Ž .
particles by condensation upon the pre-existing particles or by causing new particle formation, organic acids will affect the activity of aerosol particles.
3.3. Other sources of CCN in the atmosphere
Any atmospheric process and compound that participates in the formation of soluble compounds will affect the sources of CCN in the atmosphere. The soil particles and dust that enter the atmosphere probably serve as CCN, but they do not appear to be a
Ž .
dominant source Pruppacher and Klett, 1978 . Sea-salt particles cannot be the main
Ž .
CCN Hobbs, 1971; Pruppacher and Klett, 1978 . There is no doubt that sulfates such as
ŽNH4 2. SO can serve as active CCN. DMS emitted by marine phytoplanktoncan be4
Ž .
oxidized in the atmosphere to produce sulfates Fitzgerald, 1991 and is proposed to be the major source of CCN over the oceans, but there are also many significant gaps in the
Ž .
DMS–CCN–Climate hypothesis Charlson et al., 1987 .
Other low molecular organic acids such as C –C4 6 dicarboxylic acids and C –C3 10 carboxylic acids, aromatic polycarboxylic acids and diterpenoid acids have been
deter-Ž .
mined in the atmosphere Talbot et al., 1990; Rogge et al., 1993 . Smog chamber experiments have shown that a number of dicarboxylic acids are formed from the
Ž .
oxidation of unsaturated cyclic olefins Grosjean, 1977 . These acids include succinic,
Ž .
glutaric and adipic acids. The model calculation of Shulman et al. 1996 indicated that
Ž .
dicarboxylic acids C2–C6 , phthalic acid and cis-pionic acid can affect cloud droplet growth by two mechanisms: by gradual dissolution in the growing droplet which affects the shape of the Kohler growth curve, and by lowering of surface tension which
¨
decreases the critical supersaturation. However, the concentrations of these organic acids in the atmosphere are often too low to be effective CCN and their solubility will decrease with the increase of their molecular weights. If the concentrations of these organic acids in the atmosphere are high, such as in urban polluted air, they can also affect the formation of CCN in the atmosphere. Organic compounds, such as terpenes, alpha- and beta pinene that can be emitted by vegetation and are precursors of organic acids in the atmosphere, are not soluble and have no affinity for water. It can be expected that they could not act as CCN by themselves and could not enhance nucleation.
4. Some specific sources of CCN in the atmosphere and their possible explanations from organic acids
4.1. Natural emissions of CCN
According to the analysis of the averaged weekly CCN concentrations, Desalmand et
Ž .
al. 1982 reported that vegetation could produce CCN, and smaller CCN originating from vegetation were released every day into the atmosphere after sunrise in the Ivory Coast of West Africa. In the DEAFE 88 experiment in the African equatorial rainforest,
Ž .
was due to the release of organic acids from vegetation. The experiments of Yu et al.
Ž1988 and Talbot et al. 1990 showed that vegetation could directly emit organic acids.. Ž . Ž .
Lacaux et al. 1992 indicated that 22% of total anion concentration was organic acids in precipitation from the coastal forest of equatorial Congo in the DEAFE 88 experiment. To some extent, it is reasonable to infer that CCN originating from vegetation might be primarily composed of organic acids in the coastal forest of West Africa. Makela et al.
Ž1997 reported the occurrence of particle nucleation in forests even in the wintertime.
and in the apparent absence of direct anthropogenic influence. The recent measurements
Ž .
of Kavouras et al. 1998 showed that the observed formation of new particles over forests was most probably caused by the interaction of organic acids produced by the photo-oxidation of terpenes with other organic or inorganic species. Kavouras et al.
Ž1998 also found that the consistent diurnal variations of gaseous formic acid particu-.
late cis- and transpinonic acids and Aitken nuclei suggest a common origin. The case
Ž .
study of gas-to-particle conversion in an eastern Canadian forest by Leaitch et al. 1999 shows that of the total mass estimated from the size distribution measurements for the
Ž
fine particles, the measured organic ions formate, acetate, pyruvate, propionate and
. Ž .
exalate and sulfate contributed about 12% and 33%, respectively. Leaitch et al. 1999 also found that the temporal variations of both formic and acetic acids in the gas phase
Ž .
are consistent with the variations in isoprene. Kesselmeier et al. 1998 observed significant and light-triggered emission of formic and acetic acids from various tree species and estimated that global annual emissions of formic and acetic acids from trees were 20 to 130 Gmol and 10–33 Gmol, respectively. Evidently, organic acids produced by forests directly and indirectly play an important role in the formation of new particles and CCN over the forested areas. It should be emphasized that the emission of organic compounds depends on the types of trees. Different types of forests may make different contributions to the formation of particles and CCN.
Ž .
In another experiment of Desalmand et al. 1985 , they found evidence that continen-tal savanna soil could produce CCN at Lamto savanna in West Africa, a rural site
Ž .
located far away from industrial sources. Sanhueza and Andreae 1991 observed that tropical savanna soil could directly emit organic acids and that savanna soil was a significant source of organic acids to the tropical savanna atmosphere. The diurnal
Ž .
behavior of CCN in the tropical savanna atmosphere Desalmand et al., 1985 is close to
Ž .
that of organic acids Sanhueza and Andreae, 1991 . Observations of CCN in continental
Ž .
and marine air Squires and Twomey, 1966; Hoppel et al., 1973 showed that the CCN concentration generally decreased with altitude over the continent, and remained con-stant over the sea in the troposphere. These results support the fact that major sources of
Ž
CCN can be found over the continent. Ground-based measurements showed Twomey
.
and Davidson, 1971 that at a given location, repeatable patterns can be detected in the diurnal variation of the CCN concentration, with a minimum at about 6 a.m. and a maximum at about 6 p.m. Some gas-to-particle conversion mechanisms requiring solar radiation may control the rate of production of CCN, which reach a maximum in the
Ž .
afternoon Wallace and Hobbs, 1977 . The diurnal behavior of HCOOH and CH COOH3
Ž .
showed Talbot et al., 1990 a daily temporal trend of rapid increase from morning
been determined in aerosol particles and can be a candidate for CCN. However, it should be remembered that inorganic condensable vapors such as H SO could also be2 4 produced by the atmospheric photochemical oxidation of precursors such as H S and2
Ž .
CS2 Penkett, 1994 , which can be emitted directly by vegetation. So, the diurnal behavior of CCN could be due to the production of either organic or inorganic condensable vapors from the photochemical reactions in the atmosphere.
4.2. Biomass burning
Ž .
Biomass burning can produce formic and acetic acids Talbot et al., 1988a,b . In the
Ž . Ž .
Arctic Boundary Layer Experiment ABLE 2A experiment, Andreae et al. 1988b found that organic ions were significantly enriched in aerosols derived from biomass burning and that organic anions contributed 9–25% of the anion sums in the plume aerosols. The aerosol formate, acetate, and pyruvate concentrations in the biomass-burn-ing plume over Amazonia were 2.8"1.4, 2.0"0.6, and 0.4"0.1 nmol my3
,
respec-Ž .
tively as shown in Table 1. Unfortunately, Andreae et al. 1988b did not measure organic acids in the gas phase in the biomass-burning plume. In the DECAFE 88
Ž .
experiment, Helas et al. 1992 showed that the average gaseous formic and acetic acids in the plume consisting of the aged air masses from the biomass burning were 151 and 110 nmol my3, respectively. Considering the results of the ABLE 2A and DECAFE 88 experiments, it appears that a major part of the organic acids in the biomass-burning plume still existed in the gas phase, although aerosol organic salts were very high in the biomass-burning plume. It should be emphasized that the absolute concentrations of organic acids in the biomass-burning plumes of DECAFE 88 and ABLE 2A might be very different because these two experiments were conducted at different places and times. Under the assumption that one CCN particle contains only 10y1 6g organic salts, the concentration of CCN in biomass-burning plume would be in the 11.0=104 to
4 y3 Ž .
30.0=10 cm range. Andreae et al. 1992 showed that the concentrations of CN in plumes consisting of aged air masses from biomass burning in the DECAFE 88 experiment was in the 1500 to 3200 c my3 range. It seems that the source from organic acids can at least explain parts of these unusually high CN levels in the biomass-burning plume. Many investigations also observed a significant local increase in the concentra-tion of CCN as a result of the burning of sugar cane leaves in Hawaii and Australia
ŽWarner and Twomey, 1967 and a similar CCN increase as a result of forest fires. ŽHobbs and Radke, 1969 . Hudson et al. 1991 found similar results from forest fires in. Ž . Ž .
that most of the particles were classified as CCN. Novakov and Corrigan 1996 indicated that the water-soluble carbonaceous fraction of smoke particles produced by smoldering combustion of eucalyptus and redwood biomass fuels was principally
Ž .
associated with the most volatile organic components. Novakov and Corrigan 1996 concluded that the water-soluble organic species in the smoke particles from smoldering biomass combustion were responsible for their intrinsic CCN activity. Since the chemical composition of the primary particles produced by biomass burning depends on
Ž .
4.3. Polar atmosphere
Ž .
In the AGASP-II field experiment made in the Alaska sector Barrow of the Arctic
Ž .
Basin from 16 March to 6 May 1986, Schnell et al. 1988 reported the unexplained high
Ž 4 y3.
concentration 10 cm of CN. Their results also showed that the majority of CN were acid and probably formed by coagulation of smaller acidic nuclei. Measurements
Ž .
made over the Arctic Ocean in June by Saxena and Rathore 1984 showed CCN concentrations on the order of 1000 cmy3 at 1% supersaturation. They thought the high
Ž .
levels of CCN and CN were likely due to long-range transport of pollutants into the
Ž .
Arctic Basin. Shaw 1989 tried to explain this result by the production of CN by homogeneous nucleation of H SO , but there is still an open question about his2 4 explanation.
Ž .
During the same AGASP-II field experimental period, Li and Winchester 1989 reported very high concentrations of organic acids in Arctic aerosols. The formate, acetate, propionate and pyruvate all together contributed 20% to the mean mass concentration in the fine fraction and 21% in the coarse fraction. These proportions are
2y Ž
comparable to those of nss-SO4 , 14% and 26%, respectively Li and Winchester,
.
1989 . Their aerosol formate and acetate concentrations are the highest ever reported. Note that organic anions contribute more to the mass concentration of the fine particles than nss-SO42y. Their analysis showed that organic acids most probably originated at lower latitude and were transported to the Arctic. They thought that organic acid vapors from lower latitudes might partition and form particles by their condensation and co-condensation with NH3 in the low Arctic temperature, causing most organic acid vapors to be present in the aerosol particles. The small organic acid particles might coagulate together to form the larger organic acid particles during their transport pole-ward in the winter season. As analyzed before, the concentration of CCN from
Ž 4 y3.
organic acids is close to the high concentration 10 cm of CN reported in the AGASP-II field experiments. The concurrent measurements of sulfate mass and CCN
Ž .
concentration by Hegg et al. 1995a also showed that most CCN activating at
Ž .
supersaturations present in Arctic stratus clouds i.e., less than approximately 1% were commonly not sulfates, and likely to be organics. This indirectly suggests that organic acids might be the major components of CCN in the Arctic in that period, although
Ž .
Hegg et al. 1995a did not mention the specific species of organics.
Ž .
In the ABLE 3A in July–August 1988, Talbot et al. 1992 reported that the North American Arctic and sub-Arctic summer troposphere was an acidic environment with HCOOH and CH COOH, and that organic acids were the principal components of3 precipitation over sub-Arctic tundra in the summertime. They also observed the highest gas concentrations of organic acids over the sub-Arctic tundra and boreal forest during the study period. The fact that the principal components of sub-Arctic precipitation were organic acids also implies that organic acids could make a significant contribution to the formation of CCN in the Arctic atmosphere.
In contrast to the Arctic, the Antarctic region has the lowest aerosol concentration
Ž .
compared with any other maritime region on the Earth Hogan, 1975 . Saxena and
Ž .
Ruggiero 1990 reported that the average CCN concentrations on November 3, 1980
y3 Ž .