MAPPING OF HIGH VALUE CROPS THROUGH AN OBJECT-BASED SVM MODEL
USING LIDAR DATA AND ORTHOPHOTO IN AGUSAN DEL NORTE PHILIPPINES
Rudolph Joshua Candare a, *, Michelle Japitana a, *, James Earl Cubillasa, Cherry Bryan Ramireza
a
Phil-LiDAR2 Project, College of Engineering and Information Technology, Caraga State University, Ampayon, Butuan City, Philippines
Commission VII, WG VII/6
KEY WORDS: OBIA, LiDAR ,Orthophoto, Support Vector Machine, eCognition
ABSTRACT:
This research describes the methods involved in the mapping of different high value crops in Agusan del Norte Philippines using LiDAR. This project is part of the Phil-LiDAR 2 Program which aims to conduct a nationwide resource assessment using LiDAR. Because of the high resolution data involved, the methodology described here utilizes object-based image analysis and the use of optimal features from LiDAR data and Orthophoto. Object-based classification was primarily done by developing rule-sets in eCognition. Several features from the LiDAR data and Orthophotos were used in the development of rule-sets for classification. Generally, classes of objects can't be separated by simple thresholds from different features making it difficult to develop a rule-set. To resolve this problem, the image-objects were subjected to Support Vector Machine learning. SVMs have gained popularity because of their ability to generalize well given a limited number of training samples. However, SVMs also suffer from parameter assignment issues that can significantly affect the classification results. More specifically, the regularization parameter C in linear SVM has to be optimized through cross validation to increase the overall accuracy. After performing the segmentation in eCognition, the optimization procedure as well as the extraction of the equations of the planes was done in Matlab. The learned hyper-planes separating one class from another in the multi-dimensional feature-space can be thought of as super-features which were then used in developing the classifier rule set in eCognition. In this study, we report an overall classification accuracy of greater than 90% in different areas.
1. INTRODUCTION
1.1 LiDAR Mapping
Land cover has a significant impact on the earth’s climate and environment. Because of this, land cover mapping is very important for authorities and scientists to gain better understanding and monitor environmental changes. According to the Climate Research Committee of the United States National Research Council, land cover distribution has an evident influence on the earth’s radiation balance, because changes in the land cover will have a large effect in the evaporation, and other heat fluxes on the earth’s surface (US National Research Council, 2005). One example of an environmental effect of a land cover type is the reduction of land surface temperature through the absorption of solar radiation by a large area of trees. Another instance would be the effect of an impervious land cover to the natural infiltration of groundwater which can be a potential cause for flooding.
Accurate understanding and precise monitoring of land cover is essential for decision makers for management of the earth’s resources. Passive aerial/satellite remote sensing techniques reach certain limits in producing a land cover analysis and classifications at finer scale; therefore, one of the advancements to consider in the future is to divert the research from algorithmic development into multi-sensor data fusion (Benediktsson, Chanussot, & Fauvel, 2007). That need for multi-sensor data fusion has thus motivated researchers to probe the use of topographic airborne LiDAR data for land cover classification. Airborne LiDAR is a laser profiling and scanning system, which emerged commercially in mid-1990s, mostly
used for bathymetric and topographic applications. Using direct geo-referencing, the laser scanning apparatus installed in the aircraft collects a 3D point cloud of the surveyed area. Unlike conventional 2D satellite data, the LiDAR point cloud describes the 3D topographic profile of the scanned surface. Several advantages of airborne LiDAR include penetration of tree canopy, insensitivity to lighting conditions and there are no effects of relief displacement. Due to these advantages, airborne LiDAR has been effectively used for generating digital terrain model (DTM), topographic mapping, construction of digital 3D city model, natural hazard (Wai Yeun Yan, 2014).
1.2 Use of LiDAR in vegetation analysis
in the aforementioned studies addresses the problem of classification confusion caused by spectral mixing in areas with heterogeneous classes. However, in high spatial resolution images, the problem of within-class spectral difference, and between-class spectral similarities would reduce the separability among different land cover/land class types. Because of this problem, object-based classification techniques have been proposed to replace pixel-based classification as is described in (Blascke, 2010). It has been pointed out in the literature that pixel-based analysis and classification is acceptable only if the spatial resolution of the imagery is coarse (Hay et al., 2001). The pixel-based approach is reasonable if the objects of interest to be classified are smaller than the spatial resolution. In imagery where the spatial resolution is finer than the objects to be classified, important spatial patterns like texture emerge and is not addressed by the conventional pixel-based approach. Yet still, the structural parameters of the image like texture, shape, and context could only be understood by human interpreters. In OBIA, image-objects represent meaningful entities that are distinguishable in a high resolution image. This new paradigm in image analysis incorporates segmentation, which is the vital step before classification.
1.3 Segmentation
In object-based image analysis, segmentation is the partitioning of an array pixels on the basis of homogeneity. Segmentation splits the raster image into spatially continuous, disjoint and homogeneous regions called ‘segments’ or objects. This process may include a processing chain of segmentation steps to ultimately delineate the target or desired objects in the image (Blaschke et al. 2004). The resulting heterogeneity of an object or segment within itself is less than the heterogeneity with respect to its neighbors. Early development in image segmentation was made during the 1970s and 1980s (Haralick and Shapiro, 1985). Segmentation methods are commonly divided into three main approaches: (i) pixel-, (ii) edge and (iii) region-based segmentation methods. These approaches can be combined as was presented in (Baatz and Schäpe, 2000). Different types of segmentation algorithms can be used interchangeably in preliminary stages and in later stages in order to capture the target objects. Different segmentation algorithms are defined by different parameters and a good control of these parameters are essential for a good segmentation result. The end results of a segmentation process are image-objects that are left to be classified. OBIA software like eCognition allows the user to emulate the human mind’s cognitive powers. The developers of this software devised a way to render knowledge in a semantic network. This relatively new software examines pixels not in isolation, but in context. eCognition allows the user to develop rule-based classification grounded on expert knowledge.
1.4 Classification
Object-based classification can be done through user-defined rule-sets. However, different classes of objects aren’t separable by direct thresholding one feature at a time. Hence, samples from different classes of objects need to be classified using machine learning algorithms. Among the machine learning algorithms, Support Vector Machine has recently received a lot of attention and the number of works utilizing this technique has increased exponentially. Support Vector Machines can generalize well given a limited number of training samples. The most important characteristic is SVM’s ability to generalize well from a limited amount and/or quality of training data. Compared to other methods like artificial neural networks,
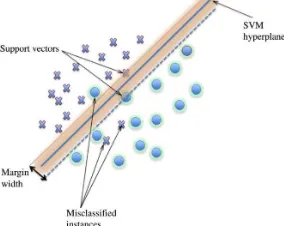
SVMs can yield comparable accuracy using a much smaller training sample size. This is due to the ‘‘support vector’’ concept that relies only on a few data points to define the hyper-plane that best separates the classes (Mountrakis et.al, 2010). An added advantage is that there is no need for repeating classifier training using different random initializations or architectures. Furthermore, being non-parametric, SVMs do not assume a known statistical distribution of the data to be classified. This is very useful because the data acquired from remotely sensed imagery usually have unknown distributions. This allows SVMs to outperform techniques based on maximum likelihood classification because normality does not always give a correct assumption of the actual pixels distribution in each class (Su et al., 2009). The method is presented with a set of labelled data instances (the sample objects) and the SVM training algorithm finds a hyper-plane that separates the dataset into a discrete predefined number of classes that is consistent with the training samples (Vapnik, 1979). The term “hyper-plane” is used to refer to the decision boundary that minimizes misclassifications, obtained in the training step. Learning is the iterative process of finding a classifier with optimal decision boundary to separate the training patterns (Zhu and Blumberg, 2002).
Figure 1. SVM hyper-plane dividing the Sample instances (objects). Adapted from (Burges, 1998)
The implementation of a linear SVM assumes that the multispectral feature data are linearly separable in the feature space. In real data measurements, distributions of vectors of different classes overlap one another. This property of real data makes linear separability difficult. No hard linear decision boundaries can be found to sufficiently to classify patterns with high accuracy. Succeeding techniques and workarounds such as the soft margin method (Cortes and Vapnik, 1995) and the kernel trick are used to solve the inseparability problem by introducing additional variables (called slack variables) in SVM optimization and mapping the nonlinear correlations into a higher dimensional space.The one-against-one formulation of the SVM constructs k(k-1)/2 classifiers (k is the total number of classes) where each one is trained on data from two classes. For training data from the ith and the jth classes, we solve the following binary classification problem:
linear separable, there is a penalty term � ∑��=1� which can reduce the number of training errors. The basic concept behind SVM is to search for a balance between the regularization term and the training errors (Chih-Jen Lin, 2001). After the classifiers have been constructed, an instance would be classified based on its sign with respect to the hyper-plane. For example if sign((wij)Txi + bij) >0 then xi is in the ith class. Choice of the parameter value (usually denoted by C), which controls the trade-off between maximizing the margin and minimizing the training error, is also an important consideration in SVM application. There exist no established heuristics for selection of these SVM parameters which frequently leads to a trial-and-error approach. However, an optimization procedure can be done to search for the regularization parameter C that gives the highest accuracy for classification. The equations of the learned hyper-planes can serve as “Super-Features” which can then be used to build a rule-based classifier in eCognition
2. METHODOLOGY
2.1 Study Area
Our study area is the province of Agusan del Norte having LiDAR datasets where for the purpose of this discussion contain the different classes that we aim to classify. The study area is shown in Figure 2.
Figure 2. LiDAR footprint of the study area.
2.2 Overall Workflow
The overall workflow for the object-based image analysis is shown in Figure 3. LiDAR derivatives and the Orthophotos are first segmented in eCognition. Due to the memory contraints of the very large 0.5m LiDAR/Orthophoto dataset (1,015 sq. km LiDAR footprint) segmentation is done in different blocks/scenes in eCognition. Samples from each class from different eCognition scenes are then taken and are subject to SVM optimization in Matlab. The advantage of doing this is that an optimized SVM model is developed that works with good accuracy for all the blocks/scenes. By plotting the samples in different 3D configurations in the feature space, the best features that separate the different classes are then used for the supervised SVM optimization. Specifically, the optimization procedure is a search for the best regularization parameter C in the linear SVM. The hyper-plane equations learned in the optimization are then used as rule-sets back in eCognition that work for all the blocks/scenes with high accuracy.
Figure 3. Overall workflow for the Object-Based Image Analysis
2.3 Pre-segmentation and Pre-classification
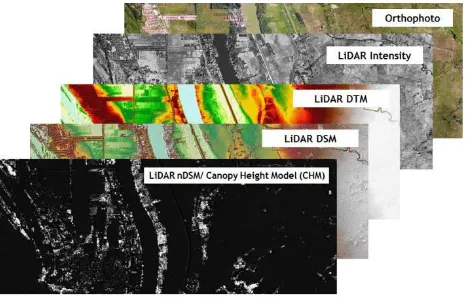
Five image layers are used in the object-based image analysis. These five layers are the following; Normalized digital surface model (nDSM) from LiDAR DSM and DTM, LiDAR Intensity, Red (from RGB orthophoto), Green (from RGB orthophoto), Blue (from RGB orthophoto).
Figure 4. The different LiDAR derivatives and Orthophoto used.
These layers are loaded into eCognition for pre-segmentation and pre-classification. The first segmentation performed is a quadtree segmentation with a scale parameter of 2.0 and weighted only based on the LiDAR nDSM layer (no weights are placed for the other layers). After the quadtree segmentation, a spectral-difference segmentation with a maximum spectral difference of 2.0 is then run on the current image-object level. A pre-classification is then made by assigning all objects with an nDSM value greater than 2.0 meters to the class HE (High Elevation Objects/Tall Group) using the assign class algorithm. Unclassified objects in the image-object level with an nDSM value that is less than or equal to 2.0 meters and greater than or equal to 0.25 meters are classified as class ME (Medium Elevation Objects/ Medium Group). All the other remaining unclassified objects (< 0.25 meters) are then assigned to the LE (Low elevation Objects/ Groundlevel Group) class. The purpose of pre-classifying the segmented objects into the three major classes is to develop separate SVMs for each of the HE, ME,
eCognition
Rules based on Hyperplane Classification
Matlab
SVM Optimization Hyperplane Extraction
eCognition
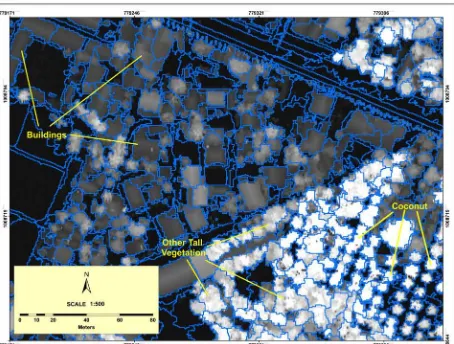
and LE major classes. Separate SVMs are developed because each major class would require different sets of features. For instance subclasses within the HE major class can be well separated and classified using mainly geometric features while subclasses within the LE major class can be classified well using LiDAR Intensity and RGB transformation features. A sample end result for this segmentation and pre-classification stage is shown in Figure 5.
Figure 5. Sample end result of the segmentation and pre-classification stage.
3. RESULTS AND DISCUSSION
3.1 Segmentation
3.1.1 High Elevation (Tall) Group: After the initial pre-classifications, the next step is re-segmentation to capture the target subclasses and to select subclass samples from each of the super-classes. Samples were collected for building an optimized support vector machine. In the HE super-class, the current subclasses are the following; Buildings, Coconut, Mango, and Other Tall Trees. Contained within the “Other Tall Trees” class are other tall tree species and other crops taller than 2.0 meters like banana, rubber and other tall species found in forest lands. Methods to classify banana and rubber are still being developed by the team. For now, these classes are still kept as “Other Tall Trees” class. The HE class objects are re-segmented using the multi-resolution segmentation algorithm in eCognition with a scale parameter of 17, shape of 0.3, and compactness of 0.5. The image layer weight is placed only on the nDSM layer. A sample end result of this segmentation setting is shown in Figure 6 and 7.
Figure 6. Segmentation result for the HE subclasses
Figure 7. Segmentation result for the HE subclasses
Figure 8. Segmentation result for the ME subclasses
Figure 9. Segmentation result for the ME subclasses
3.1.3 Low Elevation Group: The segmentation settings for the subclasses under the LE group are the same as the settings for the previously described ME class. In the LE superclass, the subclasses are the classes Grassland, Rice field, Fallow (uncultivated), Road, and Shadow. However, the shadow subclass is not an actual land-class and is reclassified contextually using the relative neighbor feature. In the development of the SVM for the LE superclass we include the class shadow because objects that fall in this class have a distinct property in the feature space. A sample end result in the segmentation of the LE class is shown in Figure 10.
Figure 10. Segmentation result for the LE subclasses
3.2 Feature Selection
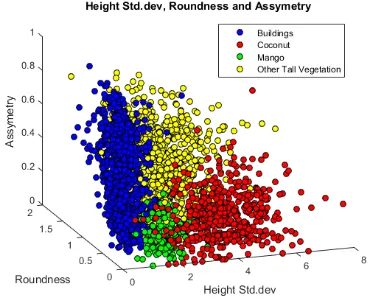
3.2.1 High Elevation (Tall) Group: Samples from the four different subclasses of the HE group are collected and the distributions of the samples in different configurations of the 3D feature-space were inspected to find the best features. These features are namely; Roundness, Compactness, Area, Height, Height standard deviation, Asymmetry. The features used for the subclasses of the HE group are structural features primarily based on the LiDAR derivatives. Detailed derivations and mathematical formulation of these features are described in the eCognition reference book. Shown in the following figures are the 3D plots of the samples in the best feature-space configurations that separate each class.
Figure 11. Roundness, Compactness and Height Std.dev
Figure 12. Height Std. Dev, Roundness, and Assymetry
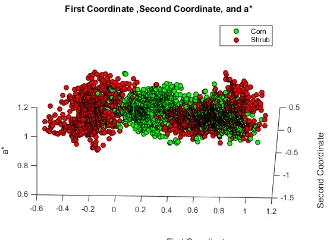
(HSI), a* (CIE Lab), b* (CIE Lab). Shown in Figure 13 and 14 are some of the 3D plots of the samples in the best feature-space configurations that separate the classes corn and shrub.
Figure 13. 1st coordinate, 2nd coordinate, and a*
Figure 14. a*, b*, and LiDAR Intensity
3.2.3 Low Elevation Group: The features used for the LE superclass are the same features used in developing the model for the ME superclass. Shown in Figure 15 and 16 are the 3D plots of the samples in the best feature-space configurations that separate the different subclasses in the LE superclass. In the plots, the class “uncultivated” corresponds to the class fallow.
Figure 15. a*,b*, and 2nd Coordinate
3.3 SVM Optimization
Using the scaled features for the different classes, an optimization procedure for the SVM learning is then carried out in Matlab. The optimization is a search for the best regularization parameter C that gives the highest cross validation accuracy. Three-fold cross validation is performed for each 1v1 SVM implementation. The LIBSVM package was interfaced in Matlab to extract the equations of the hyper-planes of the best SVM model found. A linear kernel SVM was used because an RBF kernel could not be reconstructed back to eCognition. A sample color plot of the search for the optimal
value for the regularization parameter C is shown in the Figure 16 below.
Figure 16. Sample color plot in the optimal C search
3.4 Classification in eCognition
Using the equations of the hyper-planes that separate the different classes in the six-dimension feature space, a rule-set is then built in eCognition. It should be noted that the equation of each hyper-plane is of the form wTx +b = 0, where w is the normal vector to the hyper-plane and x is the feature vector. For a 4-class problem (HE Class) with a one-against-one implementation in SVM, we have 6 hyper-planes namely (w12 )Tx +b12 = 0, (w13 )Tx +b13 = 0, (w14)Tx +b14 = 0, (w23 )Tx +b23 = 0, (w24 )Tx +b24 = 0, (w34 )Tx +b34 = 0. We have Class 1 = Buildings; Class 2 = Coconut; Class 3 = Mango; Class 4 = Other Tall Vegetation. An object (a feature vector x) would be classified according to its sign with respect to the hyper-planes it is involved with. For example, for an object to be classified as a Building (Class 1) it should satisfy: (w12)Tx +b12 > 0 and (w13 )Tx +b13 > 0 and (w14 )Tx +b14 > 0. The learned hyper-planes serve as “Super-Features” which is then used to build a thresholding rule set in eCognition for the classification of the scene.
Buildings (Class 1)
W12>0
W13>0
W14>0
Coconut (Class 2)
W12<0 W23>0
W24>0
Mango (Class 3)
W13<0
W23<0 W34>0
Other Tall Vegetation (Class 4)
W14<0
W24<0
W34<0 Table 1. Rules based on hyperplane for the HE subclasses.
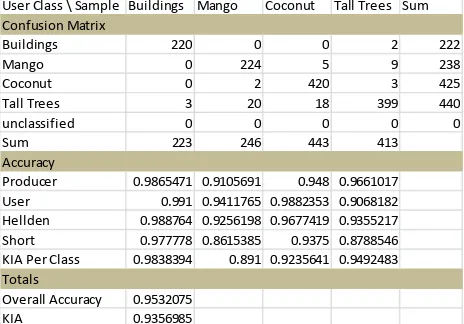
3.5 Accuracy of the Developed SVM Models
The developed SVM rule-set showed a high overall accuracy when applied to different scenes/areas. The following tables show the error matrix and the accuracy of one block/scene in Agusan del Norte.
Table 2. Accuracy of the HE subclasses in a sample block/scene
Table 3. Accuracy of the ME subclasses in a sample block/scene
Table 4. Accuracy of the LE subclasses in a sample block/scene
3.6 Sample Classification Results
The resulting classification maps can be accessed through the web as a Web Map (lidar2.carsu.edu.ph:9080)
Figure 19. Snippet of the High Value Crops Web Map
Figure 20. High Value Crops Map (Mango trees are shown in cyan and Coconut Trees are shown in green)
4. CONCLUSION
We have demonstrated an object-based classification of high-value crops using an optimized SVM model using LiDAR data and Orthophoto. There are three major parts of the presented workflow. The first part involves the segmentation algorithms for feature extraction. The second part is the SVM optimization through cross validation in order to extract the equations of the hyper-planes that best separate each class. Finally, the learned hyper-planes are used to create the rule-sets for classification in eCognition. Segmentation and rule-based classification was done using eCognition. The optimization of the SVM as well as hyper-plane extraction was done using LIBSVM through Matlab. Overall accuracies greater than 90% were achieved with the optimized model. An optimized model can yield better accuracy: however, like all optimization procedures, it may just cause the model to over-fit. To check if the model is over-fitted to the scene where it has learned the parameters, the model should be tested against different scenes. We have shown that even when the optimized SVM model was tested against different scenes within Agusan del Norte, the obtained overall accuracies were greater than 90%.
User Class \ Sample Buildings Mango Coconut Tall Trees Sum Confusion Matrix
Buildings 220 0 0 2 222
Mango 0 224 5 9 238
Coconut 0 2 420 3 425
Tall Trees 3 20 18 399 440
unclassified 0 0 0 0 0
Sum 223 246 443 413
Accuracy
Producer 0.9865471 0.9105691 0.948 0.9661017
User 0.991 0.9411765 0.9882353 0.9068182
Hellden 0.988764 0.9256198 0.9677419 0.9355217
Short 0.977778 0.8615385 0.9375 0.8788546
KIA Per Class 0.9838394 0.891 0.9235641 0.9492483 Totals
Overall Accuracy 0.9532075
KIA 0.9356985
User Class \ Sample Shrub Corn Sum
Confusion Matrix
KIA Per Class 0.6454952 0.8677606
Totals
Overall Accuracy 0.8978102
KIA 0.7393668
User Class \ Sample Grassland Rice field Fallow Road Shadow Sum
Confusion Matrix
Producer 0.9135135 0.8273381 0.814516 0.959276 0.898
User 0.9602273 0.983 0.682432 0.913793 0.981
Hellden 0.9362881 0.8984375 0.742647 0.936 0.937662
Short 0.8802083 0.8156028 0.590643 0.879668 0.882641
KIA Per Class 0.8965061 0.8061626 0.784774 0.948 0.844621
Totals
Overall Accuracy 0.8944911
ACKNOWLEDGEMENTS
The authors are grateful for the support and funding of the Department of Science and Technology (DOST-PCIEERD). This project is under the Phil-LiDAR 2 Program (Nationwide Resource Assessment using LiDAR). LiDAR data was obtained from the UP DREAM-LiDAR Program.
REFERENCES
Baatz, M., Schäpe, M., 2000. Multiresolution segmentation – an optimization approach for high quality multi- scale image segmentation. In: Strobl, J., Blaschke, T., Griesebner, G. (Eds.),
Angewandte Geographische Informations Verarbeitung XII.
Wichmann Verlag, Karlsruhe, pp. 12–23
Benediktsson, J., Chanussot, J., & Fauvel, M. (2007). Multiple classifier systems in remote sensing: From basics to recent developments. In M. Haindl, J. Kittler, & F. Roli (Eds.), Multiple classifier systems, volume 4472 of lecture notes in
computer science (pp. 501–512). Berlin/Heidelberg: Springer.
Blaschke, T., Burnett, C., Pekkarinen, A., 2004. New contextual approaches using image segmentation for object-based classification. In: De Meer, F., de Jong, S. (Eds.), Remote
Sensing Image Analysis: Including the spatial domain. Kluver
Academic Publishers, Dordrecht, pp. 211–236
Blaschke, T. (2010).Object based image analysis for remote sensing. ISPRS Journal of Photogrammetry and Remote
Sensing, 65,2–16)
Charaniya, A., Manduchi, R., & Lodha, S. (2004).Supervised parametric classification of aerial LiDAR data.Proceedings of the IEEE 2004 Conference on Computer Vision and Pattern
Recognition Workshop, vol. 3.(pp.1–8) (Baltimore)
Chih-Chung Chang and Chih-Jen Lin, LIBSVM: A Library for
Support Vector Machines, National Taiwan University, Taipei,
Taiwan, 2001).
Cortes, C., Vapnik, V., 1995. Support-vector networks.
Machine Learning 20 (3), 273–297
Haralick, R.M., Shapiro, L., 1985. Survey: image segmentation techniques. Computer Vision, Graphics, and Image Processing 29, 100–132
Hartfield, K.A., Landau, K.I., & Van Leeuwen, W.J. (2011).Fusion of high resolution aerial multispectral and LiDAR data: Land cover in the context of urban mosquito habitat. Remote Sensing, 3,2364–2383.
Hay, G.J., Marceau, D., Dube, P., Bouchard, A., 2001. A multiscale framework for landscape analysis: Object-specific analysis and upscaling. Landscape Ecology 16 (6), 471–490
Huang, Y., Yu, B., Zhou, J., Hu, C., Tan, W., Hu, Z., et al. (2013).Toward automatic estimation of urban green volume using airborne LiDAR data and high resolution remote sensing images. Frontiers of Earth Science, 7,43–54.
Mountrakis et. al, 2009 : Support Vector Machines in Remote Sensing: A Review. ISPRS Journal of Photogrammetry and
Remote Sensing pp. 247-259.
National Research Council (2005).Radiative forcing of climate change: Expanding the concept and addressing uncertainties.Washington, DC, USA: The National Academies Press).
Priestnall, G., Jaafar, J., & Duncan, A. (2000).Extracting urban features from LiDAR digital surface models. Computers,
Environment and Urban Systems, 24,65–78.
Su, L., Huang, Y., 2009. Support vector machine (SVM) classification: comparison of linkage techniques using a clustering–based method for training data selection. GIScience
& Remote Sensing 46 (4), 411–423
Wai Yeung Yan et. al, 2014 Urban land cover classification using airborne LiDAR data: A review, Remote Sensing of
Environment ,pp. 295-310
Vapnik, V., 1979. Estimation of Dependencies Based on Empirical Data. Nauka, Moscow, pp.5165-5184.
Zhu, G., Blumberg, D.G., 2002. Classification using ASTER data and SVM algorithms; The case study of Beer Sheva, Israel.