3D-INFORMATION FUSION FROM VERY HIGH RESOLUTION SATELLITE SENSORS
Thomas Krauß∗
, Pablo d’Angelo, Georg Kuschk, Jiaojiao Tian, Tahmineh Partovi
German Aerospace Center (DLR), Earth Observation Center, Remote Sensing Technology Institute, Oberpfaffenhofen, 82234 Weßling, Germany – [email protected]
KEY WORDS:Stereo satellites, DSM, 3D-objects, DTM, 3D-change-detection
ABSTRACT:
In this paper we show the pre-processing and potential for environmental applications of very high resolution (VHR) satellite stereo imagery like these from WorldView-2 or Pl´eiades with ground sampling distances (GSD) of half a metre to a metre. To process such data first a dense digital surface model (DSM) has to be generated. Afterwards from this a digital terrain model (DTM) representing the ground and a so called normalized digital elevation model (nDEM) representing off-ground objects are derived. Combining these elevation based data with a spectral classification allows detection and extraction of objects from the satellite scenes. Beside the object extraction also the DSM and DTM can directly be used for simulation and monitoring of environmental issues. Examples are the simulation of floodings, building-volume and people estimation, simulation of noise from roads, wave-propagation for cell-phones, wind and light for estimating renewable energy sources, 3D change detection, earthquake preparedness and crisis relief, urban development and sprawl of informal settlements and much more. Also outside of urban areas volume information brings literally a new dimension to earth oberservation tasks like the volume estimations of forests and illegal logging, volume of (illegal) open pit mining activities, estimation of flooding or tsunami risks, dike planning, etc. In this paper we present the preprocessing from the original level-1 satellite data to digital surface models (DSMs), corresponding VHR ortho images and derived digital terrain models (DTMs). From these components we present how a monitoring and decision fusion based 3D change detection can be realized by using different acquisitions. The results are analyzed and assessed to derive quality parameters for the presented method. Finally the usability of 3D information fusion from VHR satellite imagery is discussed and evaluated.
1. INTRODUCTION
Very high resolution (VHR) satellite missions like WorldView-2 or Pl´eiades allow the acqusition of (multi-)stereo imagery with ground sampling distances (GSD) of about half a metre. Sophis-ticated algorithms for dense image matching from such imagery allow the reconstruction of a detailled 3D point cloud from the acquired images with a vertical accuracy also in the range of one GSD.
Using the height-information together with the multi-spectral im-age data allows the classification, object-detection and extraction on a much higher level than from multispectral imagery alone. Since 3D data from optical imagery are always digital surface models (DSMs) this information is mostly useful especially in urban areas. In such areas the fusion of height- and spectral classification allows the potential detection of single objects like buildings, trees, roads and bridges and subsequently a more ro-bust object based change detection in contrast to mostly used sim-ple pixel based change detection algorithms. But also outside of cities the third dimension increases the worth of remote sensing data. Particularly height sensitive areas like mining or forest ar-eas can be monitored more detailled. So the output of a mine can easily be calculated by measuring the volume differences of the mining pit and the waste dump as we show later. For deep mining or other underearth activity also the volume change of detected waste dumps can be very valuable.
In this paper we describe the preprocessing steps necessary for generating elevation and classification data which can be used in turn for object detection, change detection and monitoring. For this first a DSM has to be derived from the (multi-)stero data. The resulting 3D data have to be fused with the original imagery to reduce errors and outliers. Afterwards the digital terrain model
∗Corresponding author
(DTM) representing the ground level and the normalized digital elevation model (nDEM) containing the height of all elevated ob-jects above the DTM are derived.
In parallel some multi-spectral classifications are executed, espa-cially the detection of vegetation, water and shadows. Afterwards all available data are fused for different purposes. If more scenes are available also all height- and spectral classified data can be fused for detailled and stable change detection and monitoring applications.
After an overview of the methods used we show in a few exam-ples the monitoring from GeoEye and WorldView-2 data and the application of such data for change detection in an open pit min-ing area. In a second experiment we show 3D buildmin-ing detection in Ikonos summer and winter scenes and in a third experiment we use panchromatic Cartosat-1 stereo data showing a change detection application in forest areas. Finally a short conclusion on using fused multi-spectral VHR stereo data on monitoring ap-plications from space closes the paper.
1.1 Preliminary work
2. PRE-PROCESSING METHODS
2.1 DSM generation
The VHR sensors used here have already a very good absolute image positioning of e.g. about 4 m for WorldView-2 only re-quiring a slight shift for absolute geocorrection. But dense stereo matching requires a relative correlation between the stereo im-ages of less than a pixel. To achieve this first good correlation points are derived automatically from the two stereo images and the shifts are applied to the sensor model of the images.
For reconstructing the 3D scene, we use dense stereo matching to make use of all the image information and compute a depth for each single image pixel. As for each image pixel multiple depth hypotheses need to be tested, a computational efficient cost function is needed for the image matching, which additionally has to be robust to potentially strong radiometric and perspective changes between the images. As the pure data term of the cost function is still prone to noise and performs poorly over large disparity ranges and homogeneously textured regions, a simple pixel-wise Winner-takes-all strategy solely based on the image matching function does not yield acceptable results, which is why we add additional smoothness constraints and solve the resulting optimization problem.
The Census transformCT (Zabih and Woodfill (1994)) encodes the local image structure within a small patch around a given pixel. It is defined as an ordered set of comparisons of intensity differences and therefore invariant to monotonic transformations which preserve the local pixel intensity order:
ξ(I(x), I(x′)) =
with the concatenation operatorN
and an ordered set of dis-placementsD⊂R2, which is chosen to be a7×9window due to its simple fitting into 64 Bit variables. The matching cost of dif-ferent Census vectorss1, s2is then computed as their Hamming distancedH(s1, s2)– number of differing bits – where highest matching quality is achieved for minimal Hamming distance, and the costs are normed to the real-valued interval[0,1]
cost(x, γ) =dH CT
(I1,x), CT(I2, F(1,2)(x, γ))
maxi,j{dH(si, sj)}
(3)
Using such a7×9support window for the Census transform increases the robustness of the matching function against mis-matches, especially when searching through a large disparity range as is very common in remote sensing data.
In the resulting disparity space image (DSI) we now search for a functionalu(x)(the disparity- or height-map), which minimizes the energy function arising from the matching costs (called data termEdata), plus additional regularization terms. As the data term is prone to errors due to some incorrect and noisy measure-ments, one often needs some smoothness constraintsEsmooth, forcing the surface of the disparity map to be locally smooth.
u(x) = argmin
This energy is non-trivial to solve, since the smoothness con-straints are based on gradients of the disparity map and therefore cannot be optimized pixelwise anymore. Because of its simple implementation, low computational complexity and good regu-larization quality, we use semi-global matching (SGM) for opti-mization (Hirschm¨uller, 2005), minimizing the following discrete energy term
The first term is the matching cost, the second and third term penalties for small and large disparity discontinuities between neighboring pixelsp∈Nx. The key idea is now not to solve the intractable global 2D problem, but to approximate it by combin-ing 1D solutions from different directionsr, solved via dynamic programming (with the raw costs normed to[0,1]). For deeper insights the reader is referred to the paper of Hirschm¨uller (2005).
2.2 DSM correction and Ortho projection
The such derived disparity map dnow fits exactly on the first imageI. Missing values due to occlusion or mismatches can be filled using the spectral similarity of neighbouring pixels in the pan-sharpened first imageIpswith valid disparities as shown in fig. 1. Afterwards using the sensor-model – in the cases of VHR satellites mostly rational polynomial coefficients (RPCs) – a height maphcan be calculated by converting the disparitiesd
of each pixel to true ellipsoidal heights.
Figure 1: Height map fitting on first pan image, corrected height map, pan-sharpened first image (l.t.r.), example from a WorldView-2 scene of Munich, K¨onigsplatz,300m×500m each
Figure 2: Ortho image of a GeoEye scene,16×9km
2.3 DTM extraction and classification
Based on the DSMDthe terrain model (DTM)T representing the ground can be derived using the morphological method de-scribed in Krauß et al. (2011) based on the unfilled DSM. The difference of the surface and the terrain model gives the normal-ized DEMN =D−T. Combining the DSMDand DTMT
allows such the extraction of a high objects mask mh = 1if
N > thandmh= 0else with a height-thresholdth≈3m.
In addition to the height classification also a spectral classifica-tion is needed for detecclassifica-tion of urban objects or the change detec-tion methods like the one described in Tian and Reinartz (2011). For this the multispectral imagery is converted first to a top of at-mosphere (TOA) reflectances imageItoa. Afterwards a shadow maskmsis calculated following Makarau et al. (2011) using the blue, green and red channel ofItoa. Applying the spectral fuzzy classification method described in Krauß et al. (2012) toItoa al-lows the extraction of land cover probability maps. These maps contain the normalized digital vegetation index (NDVI)Fnand a bare soil (Fb) and water mapFw. From these the vegetation, bare soil and water maskmv,mbandmware derived usingmv= 1 ifFn> tv,mb= 1ifFb> tbandmw= 1ifFw<−twwith the thresholdstv≈0.3,tb≈0.5andtw≈0.1.
Combining all classes gives a class map as shown in fig. 4. Using these classes the changes can be described as shown in tab. 1.
In mining areas the classification becomes more complex since the DTM does not follow the DSM correctly, so the mining area can show up any of the height changes. In this case only the real height change is of interest. Also the phenology of the trees have a great influence on the classification. In the WorldView-2 image taken in March most of the forest areas do not show up as high vegetation since the DSM generation process delivers mainly the more dominant ground. But such information can be used in monitoring purposes for tree type classification.
350
300
250
200
150
100
50
0
Figure 3: DSM of the same GeoEye scene,16×9km, 0 to 350 m height
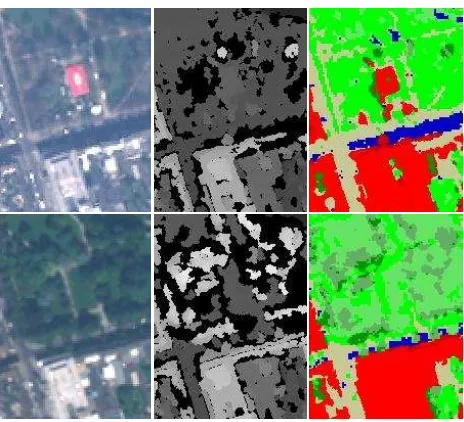
Figure 4: Ortho image, unfilled DSM and class map of the WorldView-2 (2011, top) and the GeoEye (2012, bottom) scenes (section 150 m×200 m); Classes: red/dark red: high non-vegetation objects (mainly buildings)/with shadows, tan/blue: low non-vegetation objects (mainly bare soil)/with shadows, dark green/olive: high vegetation objects (e.g. trees)/with shadows, light green/olive: low vegetation objects (grassland)/with shad-ows
2.4 Change detection
Knowing all heights and class maps for scenes of two or more epochs allow the application of the robust difference method as described in Tian et al. (2014) for detecting height changes. The robust difference between the initial DSM D1 and the second DSMD2for the pixel(x, y)can be defined as the minimum of differences computed between the pixelD2(x, y)in the second DSM and a certain neighborhood (with window size2w+ 1) of the pixelD1(x, y)in the first DSMD1. The robust positive and negative differencesXP dif(x, y)andXN dif(x, y)relative to the pixel(x, y)are defined in equations 8 and 9, respectively:
XP dif(x, y) = min
x′,y′ D2(x, y)−D1(x ′
, y′
) ,
D2(x, y)−D1(x ′
, y′
)
>0 (8)
XN dif(x, y) = max
x′,y′ D2(x, y)−D1(x ′
, y′
) ,
D2(x, y)−D1(x ′
, y′
)
<0 (9)
withx′ ∈[
x−w, x+w]andy′ ∈ [
Table 1: Possible changes depending on classified areas, empty fields mean “no change”, v and v¯ denote vegetation or non-vegetation, bld. stands for building
low→low low→high high→low high→high
v→v trees growed trees logged
v→v¯ harvested bld. erected trees logged trees→bld. ¯
v→v planted trees growed bld. demolished bld.→trees ¯
v→v¯ bld. erected bld. demolished
window around(x, y).
Eqs. 8 and 9 say that only the minimum value (greater than zero) in case of a positive change, or the maximum value in case of a negative change is taken, all within the defined window size. Typically window sizes used are3×3pixels up to7×7pixels depending on the DSM qualities and the difference in resolution between the two available DSMs.
To eliminate noise these robust height changes are filtered after-wards using morphological closing and opening operations. Also for a more accurate change detection of buildings the changes are masked using the shadow mask and other land cover masks as described above. Combining the classification results (vegetation /non-vegetation and high/low masks) with the detected changes allow for a more detailled classification of the changes.
3. EXPERIMENTS
3.1 WorldView-2 – GeoEye
In this experiment we use two VHR stereo scenes acquired on 2011-03-24, 10:58 (WorldView-2) and 2012-08-12, 10:39 (Geo-Eye) over J¨ulich. This area contains the city of J¨ulich, many and also the largest open pit mining area for lignite in Ger-many. Based on these stereo images first the DSMsD1 andD2 were derived as described in 2.1. Afterwards the DTMsT1and
T2 together with the nDEMsN1andN2 and the pansharpened TOA ortho imagesItoa,jand all masksmi,j(i∈ {h, s, v, b, w},
j∈ {1,2}) as described in 2.3 are calculated. Fig. 2 showed al-ready the ortho image and fig. 3 the DSM of the GeoEye scene of this area.
Calculating the robust difference and the appropriate morpholog-ical filtering gives the changes as shown in fig. 5.
Figure 5: Volume changes between the WorldView-2 and GeoEye scene, 16km×9km, red: negative changes, green: positive changes (0–60 m)
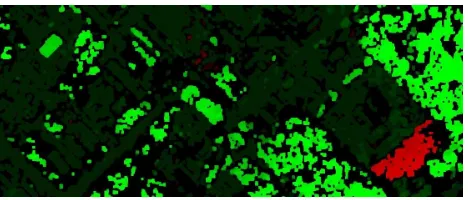
For a more detailled view fig. 6 shows a small (1100m×450m) section with a newly erected building in the left top edge (in green) and a cut down forest in the right bottom (in red). The
types of objects (building, forest) and type of change (erection and logging) is hereby derived from the class-map and following tab. 1. All other green objects in this image are trees not visible in the March WV-DSM but detected in the August GE-DSM.
Figure 6: Volume changes between the WorldView-2 and GeoEye scene, small section1100m×450m, top left: newly erected building, bottom right: cut down forest
In the left bottom edge of fig. 5 the open pit mining area “Braun-kohletagebau Inden” is visible. A positive or negative height change from any kind of vegetation to non-vegetation allows us to calculate the mined volumes. For this the positive (green) and negative (red) volumes of fig. 5 are calculated as 79.87 and 122.76 millions of cubic metres. The negative changes are the whole digged out volume containing the lignite and also the mine wastes. The positive changes are however only the dumped mine wastes. The mine wastes consist only of earth and stone with a density ofρsoil= 1500kg/m3while the lignite has a density of
ρlignite = 1000kg/m3. This allows us to convert the volume changes to mass changes as shown in tab. 2.
Table 2: Validation of 3D change detection results for the open-cast mining Inden (left bottom mining area); reference data from http://de.wikipedia.org/wiki/Tagebau Inden
Value Mine wastes Digged lignite Reference amount per year 80–85 Mio t/a 20–25 Mio t/a Amount between images (506 days) 111–118 Mio t 28–35 Mio t Volumes (m/ρ) 74–79 Mio m3 28–35 Mio m3 Measured volume changes 80 Mio m3 43 Mio m3
The two scenes were acquired with a distances of 506 days. So in tab. 2 first the reference amounts per year have to be scaled to this time distance. Afterwards the amount is converted to volumes and compared to the measured volumes from the 3D change de-tection between the two scenes. Finally we see that the measured volume changes from the described automatic change detection method comply very well with the amounts Wikipedia claims without any reference for this mine.
3.2 Ikonos building detection in summer and winter scenes
Our second example shows the building change-detection in dif-ferent seasons of two Ikonos scenes from Dong-An (North-Korea) acquired 2006 and 2010 (snow covered) as shown in fig. 7 to-gether with the derived DSMs in fig. 8.
Figure 7: Ortho images of Ikonos scenes of 2006 (left) 2010 (right, covered with snow), both sections1000m×1000m
Figure 8: DSMs from the scenes of 2006 (left) 2010 (right), both sections1000m×1000m, color coded heights in m
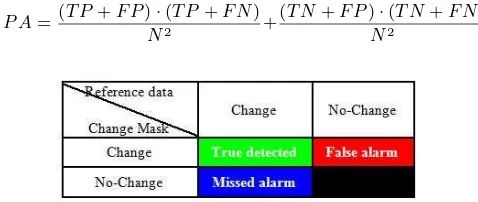
mask; true negatives (TN): black, pixels detected unchanged and also unchanged in reference; false positives (FP): red, unchanged pixels found erroneously as changes by the algorithm; false nega-tives (FN): blue, changed pixels wrongly classified as unchanged; overall accuracy (OA) and the kappa index of agreementκ calcu-lated following Congalton (1991):
OA=T P+T N
N and κ=
OA−P A
1−P A
withN =T P+T N+F P+F Nas the total number of pixels andP Aas the hypothetical probability of agreement:
P A=(T P+F P)·(T P+F N)
N2 +
(T N+F P)·(T N+F N)
N2
Figure 9: Color coding scheme of changes shown in change masks
3.3 Cartosat – Forest
The third experiment is based on pan-chromatic Cartosat-1 (IRS-P5) stereo scenes from a forest region near Oberammergau, Ger-many, acquired 2008 and 2009. These images are acquired with two stereo cameras (forward: 26◦
, backward: −5◦
) with a res-olution of 2.5 m. Two ortho images are shown in fig. 11. The DSMs created from the stereo imagery can be seen in fig. 12.
Applying a mean-shift over-segmentation to the ortho imagery and a region merging on the combination results in a land cover segmentation using only one pan-chromatic band (Tian et al.,
Figure 10: Detected changes in the Ikonos stereo DEMs of Dong-An, left: change probability (in %), right: change mask (green: true detected changes, blue: missed changes, red: erroneously detected changes)
Figure 11: Cartosat ortho images of a forest area near Oberam-mergau 2008 (left) and 2009 (right)
2013). To analyze the changes the height changes from the DSMs and robust multi-level change features from the images are used. Putting this all together results in a change probability map shown in fig. 13, left.
For the change detection between the two Cartosat images the overall accuracy is 0.9945 and the kappa index 0.5879.
4. RESULTS AND DISCUSSION
Fusing height information with multispectral classification allows more detailled monitoring and better change detection. The re-sults from the above experiments show very promising rere-sults of the proposed processing chain. The mining volumes are derived with an accuracy of about 4.5 % for the waste and 36 % for the digged coal. Also the accuracies calculated against manually de-rived change masks of the multi-season Ikonos building changes and the forest changes are very promising with accuracy values larger than 99 %.
Figure 12: DSMs created from the Cartosat stereo images of a forest area near Oberammergau 2008 (left) and 2009 (right), heights in [m]
Figure 13: Resulting change map and masks generated in the Oberammergau test area, left:Region-based change probability map (0–1=0–100 %), right: Refined mask overlaid with refer-ence data, green: true detected, red: false alarm, blue: missed alarm
5. CONCLUSION AND OUTLOOK
The presented methods for preparing and pre-processing very high resolution (VHR) satellite data open new possibilities on the remote sensing of the environment. Based on VHR satel-lite stereo imagery detailled 3D representations of urban areas or other environments can be prepared and used for simulation or monitoring issues. Besides the extraction of 3D objects also the much more precise change detection is an additional potential in monitoring the environment.
Using the method allows a potentially fully automatic change de-tection which is much more sophisticated than only image based methods as can be seen in the Ikonos summer/winter example. Also the monitoring of mining activities, illegal timber logging or monitoring the evolution of large cities are a good application area for the presented method.
But nevertheless the main disadvantage of the method is the need of pre- and post-elevation information. In most cases like dis-asters no pre-disaster stereo imagery or DSMs of the required resolution and region exists.
Unfortunately the Sentinel missions do not support stereo acqusi-tions. So we propose an additional sentinel mission covering the whole earth permanently like the indian Cartosat-1 (IRS-P5) mis-sion with a two- or even better a three-line-stereo-scanner (like ALOS-Prism) at a ground sampling distance of the stereo scan-ners of at least 2.5 m and also a nadir looking multispectral VNIR scanner with also about 2.5 m GSD or better.
References
Arefi, H., dAngelo, P., Mayer, H. and Reinartz, P., 2009. Au-tomatic generation of digital terrain models from cartosat-1 stereo images. International Archives of the Photogrammetry, Remote Sensing and Spatial Information Sciences.
Congalton, R. G., 1991. A Review of Assessing the Accuracy of Classifications of Remotely Sensed Data. Remote sensing of Environment 37(1), pp. 35–46.
dAngelo, P., Lehner, M., Krauß, T., Hoja, D. and Reinartz, P., 2008. Towards automated dem generation from high resolution stereo satellite images. In: IAPRS, Vol. 37, pp. 1137–1142.
Hirschm¨uller, H., 2005. Accurate and efficient stereo process-ing by semi-global matchprocess-ing and mutual information. In: IEEE Conference on Computer Vision and Pattern Recogni-tion (CVPR), Vol. 2, pp. 807–814.
Krauß, T., Arefi, H. and Reinartz, P., 2011. Evaluation of se-lected methods for extracting digital terrain models from satel-lite born digital surface models in urban areas. In: Interna-tional Conference on Sensors and Models in Photogrammetry and Remote Sensing (SMPR 2011).
Krauß, T., Sirmacek, B., Arefi, H. and Reinartz, P., 2012. Fus-ing stereo and multispectral data from WorldView-2 for urban modeling. In: Proc. SPIE 8390, Vol. 83901X, p. 2012.
Makarau, A., Richter, R., M¨uller, R. and Reinartz, P., 2011. Adaptive shadow detection using a blackbody radiator model. IEEE Trans.Geosci. Remote Sens. 49(6), pp. 2049–2059.
Tian, J. and Reinartz, P., 2011. Multitemporal 3D Change Detec-tion in Urban Areas Using Stereo InformaDetec-tion from Different Sensors. In: International Symposium on Image and Data Fu-sion, Vol. 2011, pp. 1–4.
Tian, J., Cui, S. and Reinartz, P., 2014. Building change detection based on satellite stereo imagery and digital surface models. IEEE Trans. Geosci. Remote Sens. 52(1), pp. 406–417.
Tian, J., Reinartz, P., dAngelo P. and Ehlers, M., 2013. Region-based automatic building and forest change detection on Cartosat-1 stereo imagery. ISPRS Journal on Photogramme-try and Remote Sensing 79, pp. 226–239.
![Figure 12: DSMs created from the Cartosat stereo images ofa forest area near Oberammergau 2008 (left) and 2009 (right),heights in [m]](https://thumb-ap.123doks.com/thumbv2/123dok/3266491.1400590/6.595.57.291.217.327/figure-created-cartosat-stereo-images-forest-oberammergau-heights.webp)
