A Study toward the Evaluation of ALOS Images for LAI Estimation in Rice Fields
Sh. Sharifi Hashjin *, R. Darvishzadeh, R. Khandan
Dept. of Remote Sensing and GIS, Geography Faculty, University of Tehran, Iran [email protected] & [email protected] & [email protected]
KEY WORDS: LAI, Rice, ALOS, AVNIR-2, Vegetation Indices
ABSTRACT:
For expanding and managing agricultural sources, satellite data have a key role in determining required information about different factors in plants Including Leaf Area Index (LAI).This paper has studied the potential of spectral indices in estimating rice canopy LAI in Amol city as one of the main sources of rice production in Iran. Due to its importance in provision of food and calorie of a major portion of population, rice product was chosen for study. A field campaign was conducted when rice was in the max growth stage (late of June). Also, two satellite images from ALOS-AVNIR-2 were used (simultaneous with conducted field works) to extract and determine vegetation indices. Then the Regression between measured data and vegetation indices, derived from combination of different bands, was evaluated and after that suitable vegetation indices were realized. Finally, statistics and calculations for introduction of a suitable model were presented. After examination of models, the results showed that RDVI and SAVI2, by determination coefficient and RMSE of 0.12
0.59 and 0.24 -0.62, have more accuracy in LAI estimation. Results of present study demonstrated the potential of ALOS images, for LAI estimation and their significant role in monitoring and managing the rice plant.
1. INTRODUCTION
The ratio of leaf surface area to unit ground surface area, called leaf area index (LAI) (Breda, 2003). Mapping and monitoring of LAI is mandatory for spatially distributed modeling of surface energy balance, vegetation productivity, water and CO2 exchange, Crop modeling and Photosynthesis monitoring. In addition, LAI is an important variable in climatic, ecological and agronomical research studies (Soltani and Galeshi, 2002; Lockwood, 1999; Ewert, 2004; Chen et al., 2002).
Measuring LAI on fields is time consuming and requires a great amount of labor and hence cost. For these reasons, many studies have sought to discover relationships between LAI and remote sensing data for its cost-effective, rapid, reliable and objective estimation.
Rice is regarded as a strategic and applicable product, after wheat, in food regime of people around the world and Iran. Since rice product industry create many occupations and profits in national level, it has a remarkable impact in economic and social perspectives. Rice widely planted in northern part of Iran. Rapid population growth, demands more rice production, while agricultural lands are gradually being reduced with urban expansion. The importance of this product caused remote sensing researches to focus on the monitoring of rice production, especially in the countries where rice is the main food.
LAI estimation, by new remote sensing methodologies, for estimating the amount and quality of product, biomass, damage and many other determining parameters of rice is so profitable. Therefore this study is aiming to analyze and to evaluate AVNIR-2 images for estimating the rice LAI.
Using the method of inversions of canopy Radiative Transfer Models (RTM) (Fang et al., 2003; Knyazikhin et al., 1998a, 1998b; Weiss et al., 1999) and empirical or semi-empirical relationships between spectral vegetation indices (VIs) and LAI method (Chen and Cihlar, 1996; Curran, 1983; Jordan, 1969; Myneni et al., 1997; Wiegand et al., 1979 ) are two main methods used in LAI estimation. Regarding that it is difficult to obtain optimal parameterized solutions for RMT inversions (Fang et al., 2003) and RTMs are often restricted to specific ideal conditions of plants and environment (Gobron et al., 1997), it is difficult to apply this method to agricultural practices.
of bands which is used more in plants (plants has high reflectance in near infrared and low reflectance in red). As a matter of fact, these VIs are recruited for extracting that information which are related to vegetation characteristics but under the condition of environment are not possible to be shown on bands. The advantage of VI is minimizing the effects of external factors such as atmospheric conditions (Myneni and Asrar, 1994), soil optical properties (Huete, 1989), illumination geometry (Shibayama et al., 1986), canopy morphology (e.g., leaf angle distribution) and leaf physiological properties (e.g., pigment content) (Haboudane et al., 2004) and for these reasons remote sensing data have been transformed and combined into various VI.
LAI generalization from small scales (regional) and for special species to large ones and different spices is not robust. But for generalization from leaf to global levels of a special species like rice, good results have been obtained (Boegh et al., 2002; Broge and Mortensen,2002; Clevers, 1989; Colombo et al., 2003; Curran, 1983a, b; Xiao et al., 2002 ) .
According to presented material, the goal of this study is presentation of optimized indices for LAI estimation using regression analysis and investigation AVNIR-2 image capability in LAI estimation.
2. DATA AND STUDY AREA 2.1 .Ground Data
In summer 2010(simultaneous with satellite pass) a field campaign was conducted in Amol, Northern part of Iran, when most of the rice crops were in grain-filling stage. Sixty plots of 30m by 30m were chosen by adopting stratified random sampling. To eliminate GPS errors, considering the spatial resolution of applied images (10 meter), the dimensions of filed samples were chosen by multiple of 3 in pixel size (30 meters) then the coordinates of determined points were regarded as the center of plots on ground.
Depending on the homogeneity of the sample plot, few sub-plots were selected and targeted for LAI measurements. LAI was determined by measuring the surface of the clipped shrubs using the LI-3100 scanning planimeter and dividing it by the surface area of the sub-plots. The plot LAI was then calculated by averaging the LAI of subplots. In next step two images of ALOS-AVNIR-2 were processed.
Figure 1. Ground Data Measurement
2.2 Remot sensing data
Since rice fields have small dimentions and their species are diverse, it was necessary to use high resolution images to segregate the fileds and increase the accuracy. Therefore, AVNIR2 images of ALOS satellite were used. This sensor is able to image in blue, red, green, and near infrared band with 10 m apatial resolution.Also it is equipped with a PROSMA camera for stereo mappig and PALSAR. In order to determin a suitable time for providing satellite images, primarily phenology information of rice was ontained. Then according to available data, planting time, SPAD peak and the harvest date was determine. Finally two images on 20 June 2010 and 7 July 2010(SPAD peak time) were provided.
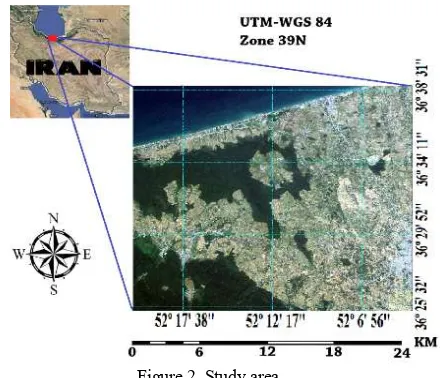
2.3. Study Area
Study area is located in Amol city which is one of main rice producers in Iran. The approximate area of location is about 385 square kilometers and is between 36º2513 N, 36º3851 N latitudes and 52º1117 E, 52º2050 E longitides. In Figure 2 the position of area is demonstarted. Area of study is located in a low level (Above sea) sedimentary plain where near shore line is below Mean Sea Level. Climate of this area is humid, according to De Martine classification.
3. DATA PROCESSING
Because no processing had been carried out on images, it was imperative to conduct geometrical and atmospheric correction on images. To these ends, geometrical correction was done using 19 distributed points in 1:25000 scale maps with 0.29 and 0.25 accuracy for two images respectively. Next, by using 2th order polynomial equations, resampling were done with nearest neighbor method. Also for increasing the accuracy, ground control points from ground measurements were recruited. Due to the presence of water vapor in this area an atmospheric correction model was applied to reduce the effect of atmosphere. In this paper FLAASH module, which is based on MODTRAN4 (Matthew, 2000), from ENVI 4.7 software was used.
4. METHOD
Vegtation indices which were developed initially in early 1970s for monitoring land perspectives, were applied for estimation of vegetation cover, primary product and some process such as evapotranspirtaion(Anser,1998).Vegetation indices are implemented on all pixels on aspecifc time and location regardless of land condition. Generally to assess biophisical parameters of plants (Biomass and leaf area index) by remote sensing physical and statistical approaches are used.
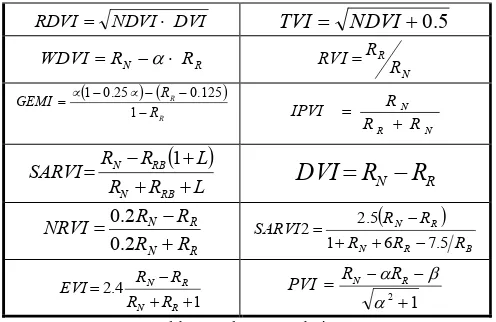
Among statistical aproaches, use of spectral indices is common due their ease of application and relation to physical variables (Baret, And Guyot, 1991:5, Baret, 1992:7). Ofcoarse, all spectral indices are not related to LAI. In this paper, it was tried to use most frequent applied indices for LAI estimation and are computable by AVNIR-2 images. As a matter of fact, 24 indices were chosen which were listed in Table 1. In this table shows soil line, and intercept. In this research, as well as vegetation indices, reflectances of four bands of sensor were used. After comparison of results, the most appropriate index for LAI estimation was selected.
Index Formulation
Table 1: Index Formulation
5. RESULTS
For introducing proper regression models, between LAI value and satellite data Regresion analysis and RMSE computations were done. Based on Average statistics of measured data (sampled points) LAI is introduced as dependent variable (Y) and values of vegetation indices as independent variable (X). In order to find the relationship of dependent and independent variables and model fitness, linear regression was used (Table 2).
Index
R^
2 RMSE IndexR^
2 RMSETable 2. Regression Results
The results of this study showed that among analysed indices, RDVI and SAVI2 were the most proper indices for LAI estimation in study area. The best RMSE value for available data was 0.12 and 0.24. Also in continuance, it was demonstrated that TSAVI and GEMI has more acceptable accuracies in contrast to others. Existence of red and near infrared bands in most of indices indicates express the relation of these bands with LAI.
infrared bands along with their sum, and decreasing the amount of saturation in NDVI, is a proper LAI estimator (Figure 4).
Figure 3. SAVI2 and RDVI relations with LAI
In red region of Electromagnetic spectrum, due to absorption of light through chlorophyll pigments, reflectance intensity decreases but in near infrared bands (because of structural characteristics of plant) the intensity of reflectance increases. Most of vegetation indices use the produced contrast between these two bands to estimate vegetation cover and physical parameters of plants.
One of the most applied vegetation indices which is used commonly in vegetation studies, is NDVI. But the use of this index in this study was confronted with low accuracy. As last studies showed (Trucker, 1979,:7, Sellers, 1985:4, 1998:, Gao et al, 2000:6), NDVI index in vegetated areas is saturated and cannot be regarded as an efficient index.
Considering that in the time of this research, rice was on its max growth, NDVI could not provide suitable accuracy in LAI estimation. Saturation of NDVI in high LAI was shown in figure 4.
Figure 4. NDVI and LAI Relation
6. CONCLUSION AND DISCUSSION
In this research reflectance values in four bands of AVNIR-2 sensor were used, as well as spectral indices. Among bands under study, infrared band could show the best result with determination of coefficient R^2=0.59. In this part no absorption is occurred by chlorophyll but if the plant leaves grow, which consequently it is possible to reach more minerals, the reflectance reaches maximum in this band. This result is in agreement with last studies (Thenkabail et al, 2004; Latifur, 2011).
As mentioned above, the time of field work was done during the max growth of rice and as a result, regarding that the soil surface is covered, indexes like OSAVI (for the reduction of background reflectance) could not reach a higher accuracy than NDVI (Table 2).
In the present study two atmospheric reduction indices SARVI and ARVI were used. The results indicate that these indices are not efficient after atmospheric corrections and their use after this correction caused some error. Notably, multiplying, subtracting, dividing, and summing of a constant number (except 0) in any index, does not change RMSE and and just change the values linearly.
For WDRVI and TVI it was observed that NDVI is multiplied with a constant number in their structure, so it is expected that the value of be equal in all these three indices (Table 2).
Results demonstrated that those indices which show better the differences of red and infrared bands, in contrast with other indices which by giving coefficients to bands reduce such a difference, has more accuracy. Also, due to the high density coverage of area, indices which use soil line adjusting factor L could not increase the accuracy of estimations very well.
It is recommended that for increasing the accuracy, in other regions, measurements be done simultaneously as much as possible, because the change of environmental changes in different times of day can affect the results. The more near the time of imaging to the reproductive phase of rice, the less is the background effects and the more accurate results of LAI
y = 0.0878x - 5.2867
R² = 0.5947
0 1 2 3 4 5 6 7
50 70 90 110 130
L
A
I
RDVI
y = 4.6925x - 6.056 R² = 0.6159
0 1 2 3 4 5 6 7
1 1.5 2 2.5 3
L
A
I
SAVI2
y = 22.149x - 7.9311
R² = 0.5646
0 1 2 3 4 5 6 7 8
0.3 0.4 0.5 0.6 0.7
L
A
I
estimation. Our results demonstrated the potential of AVNIR-2 and images confirmed that they contain relevant information for LAI estimation and can play a significant role in monitoring and managing the rice plant.
REFERENCES
Anser, G., 1998, Biophysical and biochemical source of variability in canopy reflectance . Remote Sens. Environ, 64(3), pp. 234-253
Asrar, G., Kanemasu, E.T., Yoshida, M., 1985. Estimates of leaf area index from spectral reflectance of wheat under different cultural practices and solar angle. Remote Sens. Environ, 17,pp.
111.
Barret, F. and Guyot, G., 1991, Potentials and limits of vegetation indices for LAI and APAR assessment. Remote Sens. Environ. 35(2-3), pp.161-173.
Barrett,E.C. and L.F. Curtis, 1992, Introduction to Environment
Remote Sensing. Chapman & Hall, New York,
Boegh, E., Soegaard, H., Broge, N., Hasager, C. B., Jensen, N. O., Schelde, K., et al. (2002).Airborne multispectral data for quantif ying leaf area index, nitrogen concentration, and photosynthetic efficiency in agriculture. Remote Sensing of Environment, 81, pp.
179 193
Breda, N. J. J., 2003. Ground-based measurements of leaf area index: A review of methods, instruments and current controversies. Journal of Experimental Botany, 54, pp. 2403 2417.
Broge, N. H., & Mortensen, J. V. (2002). Deriving green crop area index and canopy chlorophyll density of winter wheat from spectral re flectance data. Remote Sensing of Environment, 81,pp.
45 57
Broge, N. H. and Leblanc, E. 2000, Comparing prediction power and stability of broadband and hyperspectral vegetation indices for estimation of green leaf area index and canopy chlorophyll density, Remote Sensing of Environment. 76, pp. 156-172.
Chen, J.M., Pavlic, G., Brown, L., Cihlar, J., Leblanc, S.G., White, H.P., Hall, R.J., Peddle, D.R., King, D.J., Trofymow, J.A., Swift, E., Vander Sanden, J., Pellikka, P.K.E., 2002. Derivation and validation of Canada-wide coarse-resolution leaf area index maps using high-resolution satellite imagery and ground measurements. Remote Sens. Environ.80, pp. 165184.
Chen, J. M., & Cihlar, J., 1996. Retrieving leaf area index of boreal conifer forests using Landsat TM images. Remote Sensing
of Environment,55, pp. 153 162.
Clevers, J. G. P. W., 1989. The application of a weighted infrared-red vegetation index for estimating leaf-area index by correcting for soil-moisture. Remote Sensing of Environment, 29,
pp. 25 37.
Curran, P. J., 1983. Estimating green LAI f r o m multispectral aerial-photography .Photogrammetric Engineering and Remote
Sensing,49, pp. 1709 1720.
Fang, H. L., Liang, S. L., & Kuusk, A. (2003). Retrieving leaf area index using a genetic algorithm with a canopy radiative transfer model. Remote Sensing of Environment , 85, pp. 257 270.
GAO, X., HUETE, A. R., NI, W., and MIURA, T., 2000,
Optical-biophysical relationship of vegetation spectra without background contamination. Remote Sens. Environ, 74, pp. 609-620
Haboudane, D., Miller, J.R., Pattey, E., Zarco-Tejada, P.J., Strachan, I.B., 2004. Hyperspectral vegetation indices and novel algorithms for predicting green LAI of crop canopies: modeling and validation in the context of precision agriculture. Remote
Sens. Environ.90, pp. 337352.
Huete, A.R., 1989. Soil influences in remotely sensed vegetation-canopy spectra. In: Asrar, G. (Ed.), Theory and Application of
Optical Remote Sensing.Wiley, New York, pp. 107141.
Jordan, C. F. 1969. Derivation of leaf-area index from quality of light on forest floor. Ecology, pp. 50, 663.
Knyazikhin, Y., Martonchik, J. V., Myneni, R. B., Diner, D. J., & Running, S. W., 1998. Synergistic algorithm for estimating vegetation canopy leaf area index and fraction of absorbed photosynthetically active radiation from MODIS and MISR data.
Journal of Geophysical Research Atmospheres, 103 , pp.
32257 32275.
Latifur, R .S. and janet E. Nichol, 2011, Improved Forest estimates using ALOS-AVNIR-2 Texture indices, Remote Sens.
Environ, 115, pp. 968-977.
Lockwood, J.G., 1999. potential evapotranspiration and its relationship with actual evapotranspiration sensitive to elevated
atmospheric CO2 levels, Clim. Change 41, pp. 193212.
M. W. Matthew, S. M. Adler-Golden, A. Berk, S. C. Richtsmeier, R. Y. Levine, L. S. Bernstein, P. K. Acharya, G. P. Anderson,G. W. Felde, M. P. Hoke, A. Ratkowski, H.-H. Burke, R. D.Kaiser, and D. P. Miller,. 2000. Status of atmospheric correction using a MODTRAN4-based algorithm, Proc. SPIEInt. Soc. Opt. Eng.,
vol. 4049, pp. 199207.
radiative transfer models. IEEE Transactions on Geosciences and
Remote Sensing,35, pp. 1380 1393.
Myneni, R.B., Asrar, G., 1994. Atmospheric effects and spectral vegetation indices. Remote Sens. Environ.47, pp. 390402.
Sellers, P. J.,1985, Canopy reflectance, photosynthesis and transpiration, International Journal of Remote Sensing, 6, pp.
1335-1372.
Shibayama, M., Wiegand, C.L., Richardson, A.J., 1986. Diurnal patterns of bidirectional vegetation indices for wheat canopies.
International Journal of Remote Sensing.7, pp.233246.
Soltani, A., Galeshi, S., 2002. Importance of rapid canopy closure
for wheat production in a temperate sub-humid environment:
experimentation and simulation. Field Crop. Res. 77, pp. 1730.
Thenkabail, P. j., 1985, Canopy reflectance, photosynthesis and
transpiration. International Journal of Remote Sensing, 6, pp.
1335-1372.
Tucker, C.J., 1979, Red and photographic infrared linear combinations for monitoring vegetation. Remote Sens. Environ,
8, pp. 127-150.
Turner, D.P., Cohen, W.B., Kennedy, R.E., Fassnacht, K.S., Briggs, J.M., 1999. Relationships between leaf area index and Landsat TM spectral vegetation indices across three temperate
zone sites. Remote Sens. Environ.70, pp. 5268.
Vaesen, K., Gilliams, S., Nackaerts, K., Coppin, P., 2001. Ground-measured spectral signatures as indicators of ground cover and leaf area index: the case of paddy rice. Field Crop. Res. 69, pp. 1325.
Wiegand, C. L., Richa rdson, A. J., & Kanemasu, E. T. (1979). Leaf area index estimates for wheat from Landsat and their implications for evapotranspiration and crop model-ing.
Agronomy Journal , 71, pp. 336 342.
Weiss, M., Baret, F., Leroy, M., Begue, A., Haute coeur, O., & Sant er, R. (1999). Hemi-spherical reflectance and albedo estimates from the accumulation of across-track sun-synchronous