1. Introduction
accidents are mostly the result of increased mobility, activity and transport in the modern societies, resulting in a problem called transportation safety as a basic challenge of managers, authorities, and researchers' decision-making. hence, accident data including frequency, intensity, and like that, which are collected during different years and periods, are used as the main bases in accident reduction programs and road immunization projects. of the most important prerequisites for providing necessary control and monitoring projects and programs is to use facilities and capabilities of the modern systems on the bed of spatial communications and interactions. by using some components such as software, hardware, specialized workforce, communication data and networks, geographic information system (gis) is able to provide decision-makers with a targeted and efficient framework in order to improve accident analysis process and speed monitoring performances. in this way, decision-makers and planners are enabled, through communication between the databases collected by accident experts and observers, to provide reliable reports in suitable levels. in the reports and documents obtained, identification of high potential accident-prone areas and determination of the factors affecting are inevitable and complicated.
when an accident occurs, the factors affecting, directly and indirectly, have features such as unknown origins, dependency on the study area and indefinable spatial relations, that make preparation of the probability of accident occurrence maps hard. therefore, in this paper, with the aim of identifying accident-prone areas, including drawing accident-prone points in intersections and their analysis, the factors affecting in the city of mashhad are studied, and the effect of each of them, individually and or collectively, for preparing occurrence probability maps is modeled.
for this purpose, the factors such as pathway width density, street density, distribution, bus station location, geometric situation, pathway network extent, and the applications are dealt with, and they are weighed collectively by using an expert estimation. the main strength of this paper compared to other similar papers is to use density and longitudinal and transverse extent of pathway network in predicting accident occurrence. certainly, modeling this will lead to better analysis of geometrical distribution of the pathways and their organization by managers. so, in order to evaluate the model, the present paper is organized as follows. in the second section, scientific and practical experiences of researchers and scientists in the fields of predicting accidents and determining the factors affecting their
Extraction of Accidents Prediction Maps Modeling Hot Spots in Geospatial Information
System
R.Shad a, *
, A. Mesgar
b, R. Moghimi b
a
Rouzbeh Shad, Assistant professor, Civil Department, Ferdowsi University of Mashhad, Mashhad,
b
Ali Mesgar, Dept. of Civil Engineering, Ferdowsi University of Mashhad (International Campus),
Mashhad, Iran- [email protected]
Key Words
:
Geographic Information System, Spatial Distribution, Accident and Prediction.ABSTRACT
In streets and intersections, identification of critical accident-prone points has an important role in using the acceptable model and method in order to decrease the probability of accident occurrence. for this purpose, deviate the factors affecting accidents and study each individually and collectively with the aid of the arithmetic operators is able to calculate and implement different extent of the effect and role of each of them. hence, different theoretical and practical solutions are provided in order to guarantee more safety and improve traffic conditions in transportation system, and the main factors affecting accidents in intersections are identified. so, in this paper, to help guarantee safety in mashhad transportation system, the capabilities of geographic information system are used in order to estimate and predict the probability of accident occurrence in intersections.
occurrence are discussed, and the advantages and disadvantages of each of them are studied. as a result, the main advantage of the study conducted is to consider simultaneous effect of some factors on accident occurrence as well as to determine error rate in the accident estimation methods, that is an effective step taken towards planning for improvement of transportation network. then, in the third section, the concepts relating to accident distribution operators, together with theoretical fundamentals and the necessary formulas are described and kriging and idw models are considered as desirable models for estimating accidents. then, in the fourth section, through investigating physical and geometrical characteristics of the study area, the data of accident numbers in intersections are prepared and quality-controled spatially and descriptively, and used for entering the said models. the executive results along with the evaluation conducted indicate the superiority of kriging model in accident estimation. finally, in the section of conclusion and suggestions, the said model is suggested in order to continue the research in the future under the condition that it has lots of data.
2. Literature review
with technology development, urban life conditions and facilities, discussion of control and monitoring transportation infrastructures have been paid attention. one the most important parameters in controling urban transportation infrastructures is accident occurrence as a destructive phenomenon. of the dependent and important standards in urban accident occurrence is the frequency of accidents in each kilometer of street. by considering effective and mutual relationship between accidents frequency and their occurrence probability, a factor named places rating is of interest to a group of researchers according to accident degree . (t. k.anderson, 2009) in addition, in changes and spatial distribution of accident
occurrence, distribution and diversity of population have an important and undeniable role. in this respect, in separate studies in london and pennsylvania effect of the factors such as population density, employment, social deprivations, and different regions extent in estimating frequency and intensity of accident were investigated. the results obtained show that in the modern urban regions, intensity and frequency of accidents are less than other regions (a. robert, b. noland, c.ma quddus , 2003) (a. j. aguero-valverde,b. pp. jovanis, 2006). Furthermore, another factor which can affect spatial distribution of accidents is geometry and specifications of the path. in a study conducted in illinois, effect of the factors such as infrastructures of road network, together with their engineering design are discussed, and the results obtained indicate that as branch passages increase,
accidents increase as well, while increased width of each passage as well as increased width of the outer shoulder in highways decrease accidents (a. robert, b. noland, c. lyoong oh, 2004). one of the most important problems of the said research is that the parameters and factors relating to accident phenomenon are spatial, and have complicated relations with transportation realities. this causes the analytical results not to conform to the real specifications, and the necessary care is not achieved in modeling. with advances in computer science and technology and innovation of a new field known as geographic information system with the capabilities such as spatially processing and analyzing accidents, a modern way will be opened to researches in the field of digital analysis. hence, with the aid of this system, human errors such as traffic experts' delay in recording accident parameters and failure of attention to occurrence location can be modeled, before conducting the analyses, and be used to identify accident-prone points (b.p.y. loo, 2006).in addition, to decrease effect of the errors on output results, the data can be directly entered to the geographical information system (k. austin, 1995). consequently, by implementing this system, accident-prone points of roads can be identified efficiently and effectively. since in the academic communities, there is no specific definition for high risk points in roads, different methods such as network analysis, kernel-based density estimation and analysis of region extent can be used for specifying these points spatially (t. anderson, 2007).
what not considered in the above researches is the coordination between different factors and study of simultaneous effect of some factors in the probability of accident occurrence. by considering the effect of different factors simultaneously and providing accident prediction map, the present paper will be an effective step towards planning in the direction of prioritizing and correcting accident-prone points.
3. Study theory
calculations (whether for the present or for the project time).
4. Implementation
in this section, implementation stages including analysis of the study area, field studies, data and factors, processing and preparation procedure, combination method and the results obtained
4.1 Study area
the study area in this research is considered to be district 2, the city of mashhad (khorasan razavi province) (fig. 1). with an area of about 83.08 km/square, this district is bounded by ghaem and shahid fahmideh highways from the north, by shahid gharani and ferdowsi highways gtom the south, by ayatollah ebadi blvd. from the east, and by azadi blvd. from the west. after the district 12, the district 2 with a population of 380454 persons has the least population density among the municipal districts of mashhad. in addition, according to the annual reports issued by traffic control organization, the most accidents
occur in this
district.
figure. 1 study area
4.2 Accident data
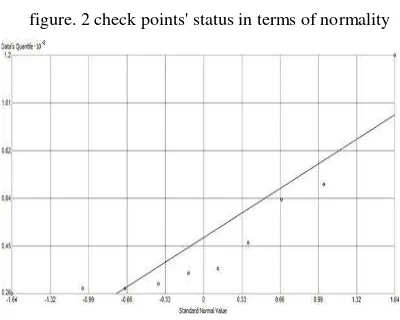
accident statistics in the area of the city of mashhad, prepared from the archive of traffic control organization, includes separate tables of accident numbers recorded in streets and intersections of each region in 2009. because the exact position of occurrence in streets, this data has low accuracy. hence, only the intersections are studied. in ten intersections of the said points called check points, accident statistics is allocated in the form of table. the intersection of khayyam st. and hedayat st. with 120 accidents, among all the data, is the most accident-prone point (table 1). five other intersections known as control points, with the aid of arithmetic operators for prediction of the probability of accident occurrence are used. in
addition, by using the normal qq plot graph, normality of the data can be examined. since the axis x and the axis y show normal distribution of the data and their cumulative distribution, respectively, the proximity of the data to the graph with an angle of 45º indicates their normal distribution. in the places which have high deviation from the graph, given the frequency, they can be excluded from the study. since from 2009 to present, some changes have been made in some intersections, their statistics are not included in this study.
table 1. the statistics of 15 accident-prone intersections in district 2
priority location type location name accident number
1 intersection khayyam-hedayat 120
2 square fahmideh 112
3 intersection toos-khayyam 72
4 intersection khayyam-ferdowsi 69
5 square sepad 63
6 square janbaz 55
7 intersection abutaleb-shefa 46
8 intersection abutaleb-abdolmotaleb
40
9 square vali-e asr 40
10 square meraj 36
11 square abutaleb 34
12 square ferdowsi 30
13 intersection toos-toos 78th 28
14 intersection ferdowsi-mahdi 28
15 square buali 26
4.3 Data preparation
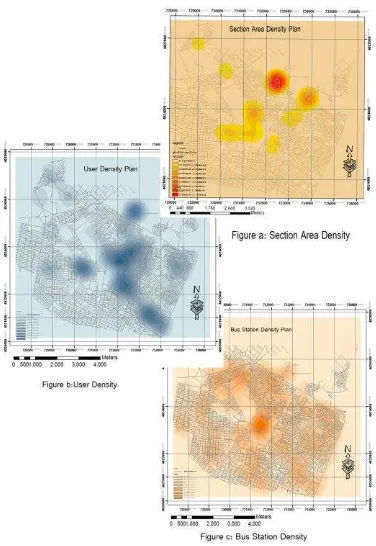
after selecting the study area and allocating the number of accidents to the intersections (table 1), necessary studies were conducted to identify the factors affecting the number of accidents and the factors such as density of bus stations in the district, width of passages, area of intersections, length of streets, and density of special usages affecting traffic, were selected as the effective factors, and density maps of each of them were drawn (fig. 3). density map for all factors except length and width of streets are prepared by kernel density. in addition, to obtain streets density map and width of passages, line density is used. then, the effect of density of each factor affecting accident is determined through weighing it numerically. for example, where the density of street length is more, the probability of accident occurrence is more. for this purpose, the weight 9 is allocated to it. on the contrary, allocation of 1 to the least density indicates low probability of accident occurrence in that area. for density of bus stations and special usages, the weight allocated is like the weight of street density (fig. 3). for width of passages and area of intersections, however, since as width of streets and area of intersections increase, the probability of accident occurrence decreases, 9 and 1 are allocated to less density and more density, respectively.
figure. 3 factors prepared in accident prediction
by analyzing weight of each layer in accident-prone points, it is observed that, in order, area of intersection,
width of passage, length of streets, bus stations, and usages affect accident occurrence. now, to draw overlay maps of the factors, a weight of 0 to 100 is allocated to each factor according to the table, and different parameters are combined. in this way, a map is drawn showing the probability of accident occurrence in the control points.
table 2. weighing the factors affecting, according to the experts
factor affecting
area of intersection
widt h of passage
bus stations
density of streets
usages
weight 30% 27% 20% 16% 7%
4.4 Execution
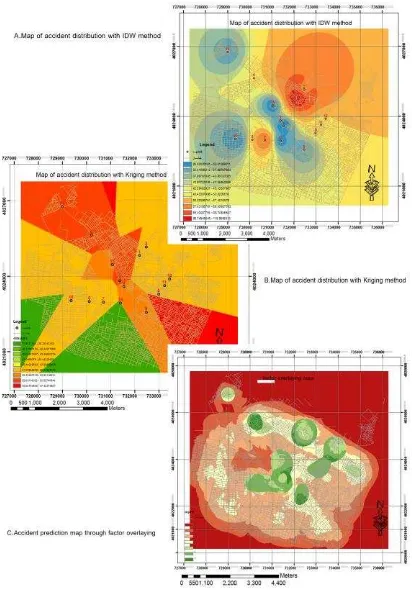
figure. 4 maps obtained from the operators of idw and kriging and factor overlaying
to compare and evaluate the amounts obtained, it is necessary to standardize the results from overlaying by using the following function.
number of predicted accidents = 15.33 × (the number from overlaying) – 309.33
by allocating the most and the least numbers of accident to the most and the least weight obtained from the overlaying map, this function is implemented. the results from the interpolation algorithms, factor overlaying and error rate of each of them in estimating accident frequency by using the control points are shown (table 3).
error rate in kriging method with 7 neighborhood points is less than other methods, indicating that increased number of neighborhood points has direct relationship with decreased error. in this method, by increasing data numbers (given their normality) before accident distribution, error rate can be decreased. high error in the overlaying method can be caused by inclusion of such factors as quality of pavements for highways, environmental conditions, traffic light system, and etc. since accident frequency in a point does not depend spatially on accident statistics in other points, error in idw method is an obvious thing.
table 3. the results obtained from interpolation algorithms intersecti accidents recorded). in the points 3 and 6, the difference between the two graphs becomes high, due to normality of the data in the blue graph.
figure. 5 graph showing error changes process in the control points
5. Conclusion and suggestions
operators of idw and kriging, it is found that the results from kriging algorithm becomes closer to the real statistics of accident in the control points, and error rate is considerably less. in this way, when the operator of kriging produces accident distribution map with more neighborhood points, error rate decreases and the output from accident prediction specifies the occurrence area with higher accuracy. in addition, spatial modeling of accidents based on the effective factors leads to better estimation of geometrical distribution of passages, distribution of bus stations, and distribution of special usages, all of which can be used in the development project of transportation network.
Reference
t. k.anderson, 2009. kernel density estimation and k-means clustering to profile road accident hot spots. accident analysis and prevention, 41 , pp. 359-364.
a. robert, b. noland, c.ma quddus , 2003 . a spatially disaggregated analysis of road casualties in england. accident analysis and prevention, volume 36 , issue 6 , pp. 973-984.
a. j. aguero-valverde, b. pp. jovanis, 2006. spatial analysis of fatal and injury crashes in pennsylvania. accident analysis and prevention , volume 38, issue 3, pp. 618-625.
a. robert, b. noland, c. lyoon g oh, 2004. the effect of infrastructure and demographic change on traffic-related fatalities and crashes: a case study of illinois county-level data. accident analysis and prevention , volume 36 , issue 4 , pp. 525-532.
b.p.y. loo, 2006. validating crash locations for quantitative spatial analysis: agis-based approach. accident analysis and prevention, volume 38 , issue 5 , pp. 879-886.
k. austin, 1995. the identification of mistakes in road accident records: part1, locational variables. accident analysis and prevention, volume 27, issue 2 , pp. 261-276.
t. anderson, 2007, comparison of spatial methods for
measuring road accident ‘hotspots’: a case study of
london. journal of maps, volume 3, issue 1 , pp. 55-63.