HIGH-RESOLUTION SAR IMAGES FOR FIRE SUSCEPTIBILITY ESTIMATION IN
URBAN FORESTRY
Silvia Canale, Alberto De Santis, Daniela Iacoviello, Fiora Pirri, Simone Sagratella
Department of Computer and System Sciences Antonio Ruberti, Sapienza University of Rome, Via Ariosto 25 00185 Rome, Italy-
{canale, desantis, iacoviel, pirri, sagratella}@dis.uniroma1.it
KEY WORDS: X-SAR images of Urban Forestry, Fire Susceptibility Map, X-SAR Images segmentation, classification
ABSTRACT
We present an adaptive system for the automatic assessment of both physical and anthropic fire impact factors on periurban forestries. The aim is to provide an integrated methodology exploiting a complex data structure built upon a multi resolution grid gathering historical land exploitation and meteorological data, records of human habits together with suitably segmented and interpreted high resolution X-SAR images, and several other information sources. The contribution of the model and its novelty rely mainly on the definition of a learning schema lifting different factors and aspects of fire causes, including physical, social and behavioural ones, to the design of a fire susceptibility map, of a specific urban forestry. The outcome is an integrated geospatial database providing an infrastructure that merges cartography, heterogeneous data and complex analysis, in so establishing a digital environment where users and tools are interactively connected in an efficient and flexible way.
1 Introduction
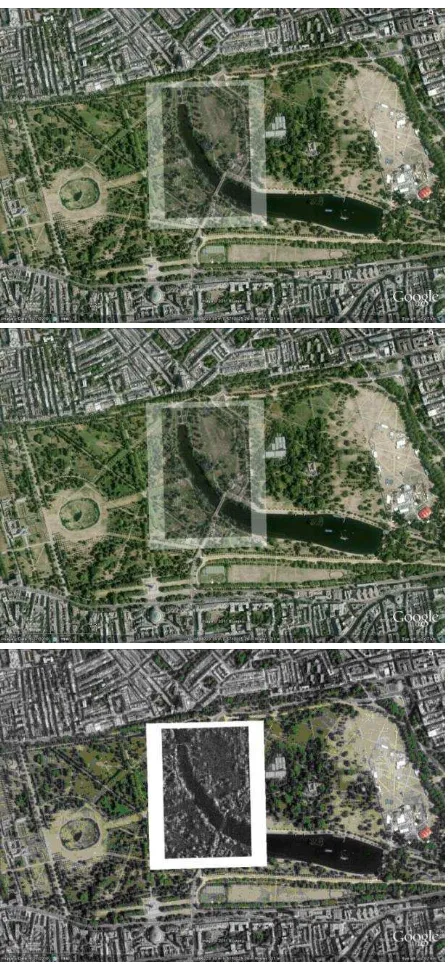
In this paper we present the main guidelines of a new approach towards an integrated model for the analysis and assessment of vulnerability to fire, applied to large urban forestry, see for example Figure 1 depicting Hyde Park in London.
Fire prevention in periurban forests, namely, wildlife ecosystems enclosed within inhabited regions or interfacing metropolitan areas, such as parks or protected woodlands, is crucial for urban management. In fact, several reasons affect a balanced growth of these areas, and fire risks is one of the major causes. Regardless of the good intentions, fire risk prevention often alters biodiversity, likewise the utmost cost for protection, maintenance and for public emergency have a negative impact on the destination of urban areas to forestry.
Figure 1. Hyde Park, London, Google Earth
.
Deterioration and lack of well modelled protection plans can cause dreadful consequences for these historical rich legacies and also great risks for the surrounding urban areas.
Indeed, if on one hand urban forestry is a great economic and social asset in metropolitan areas, for air pollution reduction, climate control, and recreational and social benefits (see
Konijnendijk et al., 2005), on the other hand a lack of accurate protection plans can cause a deterioration of these areas.
A crucial scientific contribution to urban management in European metropolis, where large urban forests and parks form a beautiful interface with the metropolitan settlement, is to provide a strategic view of vulnerability to fire.
In particular, in this project we consider several layers of data at different resolution that can integrate physical, natural and social factors. We consider the high resolution data obtained from X-SAR images, provided by Cosmo-SkyMed products, urban and land data, meteorological data and finally the automatic coregistration of the SAR images on Google Earth.
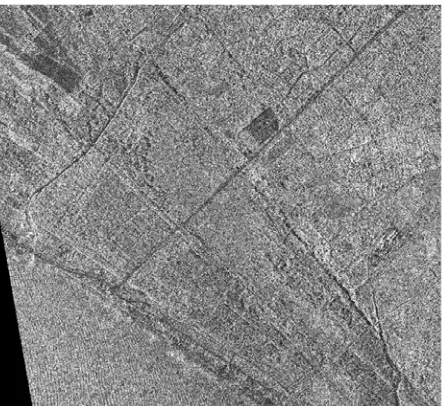
Figure 2. X-SAR Enhanced spotlight of Hyde Park
extracted with the SURF algorithm. Finally we end the paper with a short overview of the state of the art on these issues in Section 9.
Figure 3.Realization of the 4D tensor by projection of the cropped X-SAR image on Google Earth, to illustrate the coherence of the projection we display different opacity levels.
2 X-SAR images
Synthetic Aperture Radar (SAR) data have a great potential as a source of relevant and near real time information for the change detection, early warning, mitigation, and management of natural disasters. That is because of its observation capability regardless climate conditions and sun illumination. Indeed, synthetic aperture radar is an active form of remote sensing. The surface is illuminated by a beam of energy with a fixed wavelength that can be anywhere from 1 cm (K band) to approximately 70 cm (P-band). These long wavelengths penetrate clouds and atmospheric interferences common to optical imagery and therefore are not limited spatially or
temporally because of solar illumination or atmospheric interferences. The images available for the present paper are Cosmo-SkyMed products provided by the Italian Space Agency (ASI). They are high quality and high spatial definition, with resolution ranging from 0.6 to 1 m in the SpotLight mode, level 1C-GEC: this is a Geotiff format, the image is rectified and geo-referenced according to the UTM coordinate system, speckle filtered on demand. Data are obtained in the X-band (wave length ranging from 2.4 to 3.8 cm) . Smooth surfaces have a darker response to X-band than ragged ones. Indeed, the X-band is known to be sensitive to changes in the target moisture content, namely, the response is lighter on increasing humidity. On the other hand different patterns on X-SAR images, corresponding to regions with different characteristics, are distinguishable only by the gray level spatial distribution (texture). In Figure 2 an example of X-SAR image of Hyde Park is illustrated.
3 Coregistration
To identify X-SAR features in the absence of other bands, a very first problem is to register the image so as to compute the cross correlation between different intensity and colour channels. The considered X-SAR enhanced spot-light images from Cosmo-SkyMed are provided at different incidence angles (within 20° and 50°) and HH/VV polarization, are rectified, speckle filtered (Gamma Map). Data are in uint16 format, and a typical SpotLight image is represented by a raster of size 25856 x 25856 .
In order to realize a 4D tensor including both a colour image and the X-SAR one, the X-SAR is first cropped, using a graphic interface, so as to obtain a manageable size to work with.
The algorithm automatically computes the new coordinates and projects them on Google Earth, and it superimposes the X-SAR cropped image on the automatically selected area, see Figure 3. For a similarity transformation four pairs of control points are needed. The process can be repeated producing a whole tessellation of the original SpotLight image, with each cell very well manageable. A first analysis of features can be done by considering the cross correlation between the backscattering and the colour image, here we provide the normalized cross correlation between the X-SAR cropped image and each of the channel of the corresponding Google image.
Figure 4. Cross Correlation between the RGB and X-SAR coregistered images
In the follow we consider a case study area, the Castel Fusano forest, near Rome, Italy. It suffered a severe fire event in the year 2000, and a great deal of data (urban, land use and fuel characteristics, past fire data) is available, thanks to the collaboration of the Italian Civil Protection.
4 Segmentation
The region of interest is displayed on Fig. 5: it is a portion of the X-SAR data acquired on the first of June 2010, HH polarization with incidence angle of 29°, at 17.30 local time. The image is not speckle filtered.
Figure 5. X-band SAR image of the Castel Fusano area
A first step in the interpretation of X-SAR images is achieved by a segmentation procedure based on a discrete level set method (see De Santis et al., 2007), applied to a suitable transformation of the data aiming at the enhancement of the texture properties that better describe the characteristics of the zones to be identified. For example, typical transformations are the contrast, the uniformity and the entropy . Indeed uniformity is obtained as the sum of the square of the local image histogram bins value, while the local contrast is based on the local signal variance. For example, to identify the larger burned area of Castel Fusano the uniformity transformation is well suited. A four levels discrete level set segmentation of the region of interest applied on the transformed data provides a simplified representation of the original image preserving the information to be retrieved. A four levels segmentation is obtained by successive image binarizations: first the image I is partitioned into two distinct subregions (not necessarily simply connected) and represented, for any pixel
of the domain
The constants are the signal mean values within the
sets respectively. Function is the characteristic
function of a set . The sets are described by the
level set function
2
To obtain the binarization elements a cost function is minimized: it contains the fit error between the image and its binary representation and a regularization term for the level set function:
Figure 6. Contour of the canopy subregion in the Castel Fusano area
Parameter is chosen to enhance the fit error influence over the optimal solution. In De Santis et al. , 2007 it has been shown that the problem has a unique optimal solution. Once the first level optimal binarization is obtained, the regions are further binarized with the same procedure. Thus a four levels optimal segmentation is finally obtained. The measure of the local contrast allows in the chosen zone of Castel Fusano the identification oh subregions like the typical canopy of the old oak forest, planted in rows, see Figure 6. About ten different subregions can be identified in the Castel Fusano forest area. For each of them the high resolution X-SAR data allow for an accurate determination of the contour and extension, the fuel type, the gray level mean value that yields an estimation of average zone moisture content, one of the relevant physical parameter in the fire susceptibility model.
2 1,A A
5 Moisture Information
humidity value RH. To retrieve this value we can consider a psychrometric chart or a look-up table, or by means of empirical relations such as the following:
100
s E
E
RH
where E is the actual water vapor pressure and is the saturated water vapor pressure, in units of millibar. These quantities can be evaluated using the dew point values
and the temperature values
s E
d T T, both in Celsius scale:
7.5 (237.7 )
) 7 . 237 ( 5 . 7
10 11 . 6
10 11 . 6
d
d T
T T T s
E E
From the above relations the ROI average relative humidity is obtained, and the values correlated with the identified subregions can be found by a simple proportion, using their average gray level value. Periodical image acquisition provides a time series RH moisture values for every subregion. The moisture content of each zone is strictly related with the weather conditions but also on the soil and vegetation characteristics.
6 Data Integration
To learn a fire susceptibility map, the thematic zones identified by segmentation must be endowed with ancillary data describing the fuel type ( land use and vegetation), urban characteristics, human intervention and in particular anthropic factors accounting for typical behaviors of pyromaniacs. These data are provided on thematic maps (see Figure 7) such as a soil map, a vegetation map, etc. Nevertheless Once these maps are co-registered with the X-SAR image segmentation, it turns out that the data granularity is different, the X-SAR data being the finest. This can be appreciated on the detail represented on Figure 8. Therefore each pixel in the thematic areas from the segmentation can be assigned values from the other layers by a suitable classification algorithm interpolating data at coarser scale.
Therefore a dynamic and stratified data representation of the area of interest (ROI) is obtained, that is able to keep track of the evolution of changes at various levels relevant to fire susceptibility assessment.
We provide an automatic classification of high risk areas in the ROI based on both the data describing the past fires events and the data coming from X-SAR images segmentation. A novel and very efficient boosting technique combining kernel based Support Vector Machines has been developed and used to classify the different areas of the ROI, de Vasconcelos et al., 2001.
Figure 7. Castel Fusano thematic maps: vegetation map (left), soil map (right).
Figure 8. Detail of a thematic map showing the coarse data granularity
7 Data classification and learning of the fire susceptibility map
The data integration model we consider allows describing each pixel by a set of quantitative attributes based on the feature descriptors. In this paper we adopt a standard SURF algorithm in order to extract meaningful features from the X-SAR images. These quantitative attributes define the spatial cross correlations of a pixel with the closest ones in terms of the local properties devised. Given the n-dimensional feature space, the classification task is then defined over this input space where each record of quantitative attributes describes an atomic area of the X-SAR image. More formally, a record
x and a binary label y is assigned according to the features matching. The label y represents the kind of target area that we want to automatically identify in the X-SAR image, e.g. burned area, road, building, etc.
The set of these records and their labels represents the training set {(x1,y1),…,(xm,ym)}. Our aim is to identify the
classification rule defined over the training set and using this rule to assign the correct class to areas that have not been classified yet (test set). In order to define the classification rule we train a Support Vector Machine (Schölkopf et al., 2001) over the training set and test the resulting classifier over the test set. In this case, for each atomic area x of the image the classification function f assigns the estimated label given by a linear combination of kernel functions evaluated in the so called support vectors.
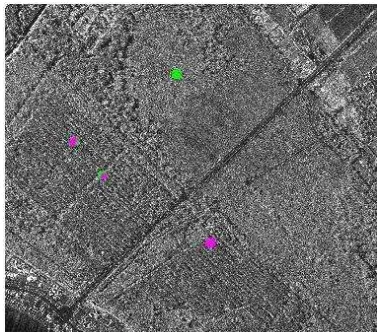
In order to obtain good accuracy in classification we adopt a Radial Basis Function as kernel function and estimate the best kernel parameter by a 10-fold Cross Validation procedure. We trained a Support Vector Machine on a training set consisting of 30000 instances: 20000 instances were drawn from oak tree areas and the remaining 10000 instances from burned areas. We obtained a 10-fold Cross Validation training accuracy of 99.10% and test the classifier
f obtained on a different X-SAR test image acquired on the same area one day after the acquisition of the image used for training the classifier. In Figure 9 we report the results of the classification of the X-SAR test image. The classification rules has been used to assign the label “oak tree forest” to 19600 test instances drawn from four test areas: two areas are portions of the oak tree forest; one is completely burned in the great fire of 2001 and one is half oak tree and half road. The classifier is able to recognize oak tree areas with an accuracy of 90.03% and to classify areas that are not in the oak tree forest with an accuracy of 89.40%. Other experiments on different areas and different polarization images gave similar results.
The image classification algorithm we propose in this paper is based on standard feature extraction and single pixel recognition. The high mean training accuracy gained shows that the instances drawn to train the classifier are consistent and that potentially high quality information can be extracted from X-SAR images. We perform a number of experiments showing that the classification rules we define on the base of the training set yield good separating surfaces. These surfaces allow to recognize area being characterized by specific labels, in particular the ones of interest for fire susceptibility like canopy of the old oak forest. Therefore kind, contiguity and moisture content of fuel can be automatically detected by image classification and this information is very useful for fire prevention and fight.
8 Conclusions
In this paper we present the main components and the underlying guidelines of a new approach towards an integrated model for the analysis and assessment of vulnerability to fire. In particular, we apply the proposed approach to large urban forestry that are often interested by fire events, e.g. the Castel Fusano area near Rome in Italy. On the base of the main results on SAR image statistics, we introduce a method for fine segmentation and classification of regions according to a specific search task of interest. Our method is based on the collection of local scale invariant features descriptors tuned to X-SAR specificity. The features space is derived by combining the local statistics of the X-SAR image with the corresponding image in colour space, obtained by projecting the rectified image on Google Map, and exploiting several scaling of the specific region. Correlation with the colour space induces a local interpretation rule for the X-SAR image pixel intensity values. The advantage of the method we propose is that it can be used to both search in an archive of X-SAR images, different from the one used for training the image classifier, or to automatically label the images for further search, by identifying specific classes of targets.
9 State of art
Since the earliest seventies the problem of providing an interpretation and a model of SAR images has been extensively studied under the perspective of defining the statistics of the intensity values of the backscattered signal.
In fact, a characteristic of SAR images is the interference phenomenon known as speckle (Arsenault et al., 1976) which produces a typical pixelization effect, that have induced several interpretation of the associated statistics.
Models provided range from very general to more empirical, mainly exploiting Gamma, inverse Gamma distributions, Generalized Gaussian models, Fisher distribution, and non-parametric distributions, and so on, with the aim at obtaining a full characterization of the electromagnetic scattering of a scene. On the other hand, for application purposes classification methods have fostered a more empirical approach to recognize areas of different soil and vegetation types. Classification methods have exploited Neural Networks, Support Vector Machine, MAP, and regression analysis of backscattering models relating the measured signal to some parameters characterizing the soil condition. In this context the use of the X-band is quite recent and its full capability in environmental monitoring is yet to be completely evaluated. Our approach combining different methodologies is completely new in the literature. Several machine learning based approaches have been proposed in literature for fire risk analysis and prediction. In (Lapucci et al., 2005) the fire risk areas were located in the Livorno district in Tuscany region by means of a synergetic use of data mining techniques to estimate the fire likelihood, given previous fire events, and a spatial multicriteria analytical hierarchy process analysis, for damage evaluation. An analogous experience using spatial data and data mining algorithms, to identify fire risk analysis in Portugal is described in (de Vasconcelos et al., 2001). Two different machine learning models have been used and compared: logistic regression and artificial neural networks. The most interesting results showed that spatial fire ignition patterns, identified by the proposed approach, could be used for fire risk prediction and that these patterns could differ according to different fire ignition causes. Further studies and experiences in machine learning models for fire risk analysis can be found in (Betanzos et al., 2003) and in (Iliadis et al., 2002).
Acknowledgments
The work reported in this paper has been supported by ASI within the Cosmo-SkyMed Announcement of Opportunity (DC-OST-2009-116), SARFIRE Project 2288.
References
Arsenault, H. H. and G. April, 1976. Properties of speckle integrated with a finite aperture and logarithmically transformed, JOSA, Vol. 66, Issue 11, pp. 1160-1163.
Betanzos, A. A., O. Romero, B. Berdinas, E. Pereira, M. I. P. Andrade, E. Jimenez, J. L. L. Soto, and T. Carballas, 2003. An intelligent system for forest fire risk prediction and fire fighting management in Galicia. Expert Systems with Applications 4(25), 545–554.
Daskalakis, C. and C. H. Papadimitriou, 2006. Computing pure Nash equilibria in graphical games via Markov random fields. In Proc. of the 7th ACM conf, on Electronic commerce, EC ’06, pp. 91–99. ACM.
De Santis, A. and D. Iacoviello, 2007. Discrete level set approach to image segmentation, Signal, Image and Video Processing, Springer-Verlag London, 1, 4, pp. 303-320.
comparing logistic regression and neural networks.
Photogramm Eng Remote Sens 67, 73–81.
Iliadis, L., A. Papastavrou, and P. Lefakis, 2002. A computer system that classifies the prefectures of Greece in forest fire risk zones using fuzzy sets. Forest Policy Economics 4.
Kearns, M. J., M. L. Littman, and S. P. Singh, 2001. Graphical models for game theory. In UAI ’01: Proceedings of the 17th Conference in Uncertainty in Artificial Intelligence, pp. 253–260. Morgan Kaufmann.
Konijnendijk, C., K. Nilsson, T. Randrup, and J. Schipperijn 2005. Urban Forests and Trees A Reference Book. Springer.
Lapucci, A., S. Lombardo, M. Petri, and A. Santucci (2005). A KDD based multicriteria decision making model for fire risk evaluation. In AGILE 2005, 8th Conference on Geographic Information Science, pp. 143–152. Toppen F, Painho M. (eds).
Martinez, J., E. Chuvieco, and P. Martin, 2004 . Estimation of risk factors of human ignition of fires in Spain by means of logistic regression. In: Proc. of the Second International Symposium on Fire Economics, Planning, and Policy.
Reineking, B., P. Weibel, M. Conedera, and H. Bugmann, 2010. Environmental determinants of lightning- v. human-induced forest fire ignitions differ in a temperate mountain region of switzerland. International Journal of Wildland Fire
19, pp.541–557.