RANGE AND IMAGE DATA INTEGRATION FOR MAN-MADE OBJECT
RECONSTRUCTION
F. Nex, F. Remondino
3D Optical Metrology, Fondazione Bruno Kessler, Via Sommarive 18, 38123 Trento, Italy <franex, remondino>@fbk.eu, http://3dom.fbk.eu
Working Groups I/2, III/1, III/3, III/4
KEY WORDS: Integration, Image, Matching, LiDAR, Automation, Aerial, Close range
ABSTRACT:
The extraction of information from image and range data is one of the main research topics. In literature, several papers dealing with this topic has been already presented. In particular, several authors have suggested an integrated use of both range and image information in order to increase the reliability and the completeness of the results exploiting their complementary nature. In this paper, an integration between range and image data for the geometric reconstruction of man-made object is presented. In particular, the focus of this paper is on the edge extraction procedure performed in an integrated way exploiting the information provided by both range and image data. Both terrestrial and aerial applications have been analysed for the façade extraction in terrestrial acquisitions and the roof outline extraction from aerial data. The algorithm and the achieved results are described and discussed in detail.
1. INTRODUCTION
The extraction of precise and dense point clouds is nowadays possible using both LiDAR and image matching techniques. Nowadays, LiDAR and photogrammetric point clouds can indeed be considered comparable in most cases in terms of density and accuracy, as asserted in several papers both in terrestrial (Remondino et al., 2008; Hiep et al., 2009) and aerial applications (Paparoditis et al., 2006; Hirshmuller, 2008; Gehrke et al., 2010).
In typical mapping and modelling applications, once a point cloud (usually several millions of points) has been extracted, only the first (and shortest) part of the work has been completed. It is afterward required to process them in order to extract metric information (such as shapes, surface normal vectors, dimensions, polylines, etc.) of different objects (façades, buildings, streets, etc.) necessary to achieve the final product (3D model, drawing, thematic map, etc.). In some way, the classification, segmentation, modelling and in general the
“understanding” of an unstructured point cloud in an almost
automated way and without loss of accuracy is the real challenge to be faced nowadays by researchers. In the literature several papers deal with such topics. Some contributions considered as input data only images (Zebelin et al., 2006), others considered range information (Habib et al., 2009; Sampath and Shan, 2009; Pu and Vosselmann, 2009) and a growing number of papers rely on the integration of different data sources (Demir et al., 2009) and in particular from both range and image data (Alshawabkeh, 2006; Awrangjeb, et al. 2010; Habib et al., 2010). The single-technique approaches usually provide good results in very specific applications, while they are unable to be adapted to operative conditions far from their original use. On the other hand, the multi-technique solutions seem to be more versatile and able to achieve good results for a wider range of applications exploiting the complementary nature of range and image data. In particular, the integration of range and image data has shown promising
results both in terrestrial and aerial applications for 3D modeling and mapping purposes (Alshawabkeh, 2006; Habib et al. 2010) with a great improvement for façade modelling. Generally the main problem is the correct extraction and 3D reconstruction of continuous and reliable edges. A complete edge extraction allows indeed to reconstruct the geometry of the surveyed objects in a better way (Nex, 2010). In this paper, a different edge extraction approach is presented. Assuming to have, for a defined area of interest, a point cloud (from range sensors or image matching) and a set of images, an integrated methodology is applied in order to retrieve the main geometric discontinuities of the scene which are the base for successive drawing or mapping purposes. Range sensors generally suffer in measuring the scene edges. On the other hand, despite edges are clearly measurable in the images, automated matching algorithms are usually not tailored to extract edges but they are matched only as integration to other image primitives. Therefore the proposed method extracts a set of reliable and continuous edges combining the available point cloud and images. The main goal is to obtain only the edges strictly requested in the geometric reconstruction of the surveyed scene. A data driven approach is used in order to keep the maximum flexibility and detect discontinuities of generic shape. The final results show a more complete 3D reconstruction of man-made objects. The reported case studies are related to objects, in terrestrial (building façades) and aerial acquisitions (roof outlines). In the following section a brief overview of the workflow is given with the integrated edge extraction step presented more in detail. Then, the achieved results in the 3D object reconstruction will be shown. Finally, conclusions and future developments will be discussed.
2. ALGORITHM’S OVERVIEW
The proposed algorithm processes image and range information in order to extract geometric primitives useful for a more
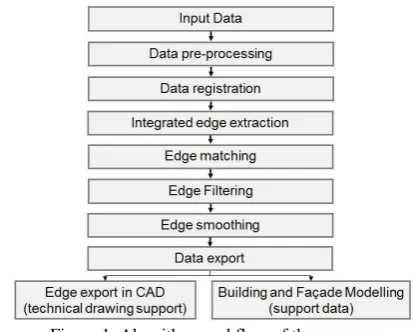
complete and detailed reconstruction of man-made objects like building façades or roofs. A point cloud provided from dense image matching or range sensors (aerial or terrestrial) is used to drive the edge extraction and the matching process. In this way the geometric object boundaries, useful in speeding up the drawing production or the building modelling are determined. This approach has been already presented in (Nex, 2010) where an exhaustive description of the algorithm is reported. In the following sub-sections the algorithm steps are briefly described (Figure 1), while the improvements developed in the edge extraction phase will be presented in the following section. The entire method, which starts from a dense and accurate point cloud and a set of images, is divided in blocks with concatenated processing steps.
Figure 1. Algorithm workflow of the process.
- Data acquisition. Both in terrestrial and aerial applications the multi-image approach is mandatory as it allows to improve the quality and the reliability of the image matching results (Zhang, 2005; Nex, 2010). In terrestrial applications, a set of convergent images or acquired according to an ad hoc network geometry is suggested. In the aerial case, high overlaps between images and adjacent strips are mandatory.
High image resolution is always requested too: the extraction of building boundaries from images is complicated if low resolution images are used, as edges are usually blurred and irregular. The most central image of each set of images is considered as reference in the following matching process: when image sequences are available, different reference images are chosen in a proper way to assure a multi-view geometry. - Data pre-processing. In order to improve the edge extraction, a non-linear Edge Preserving Smoothing (EPS) filter is applied to smooth the little radiometric variations but preserving and enhancing the main geometric discontents in the image. The boundaries of man-made objects are thus sharpened and smoothed deleting little radiometric changes that usually affect negatively the extraction of such elements. Moreover, in order to improve the radiometric contents of all the images and achieve better matching results, the Wallis filter is applied. - Data registration. Image orientation can be performed using different approaches (Barazzetti et al., 2011, etc.). Images and range data have to be already oriented in the same reference system. This process is not necessary if the available point cloud is generated with image matching techniques. Otherwise, the point cloud need to be co-registered in the photogrammetric reference system by means of a spatial roto-translation.
- Integrated edge extraction. The integrated edge extraction is performed on a reference image, as described more in detail in following section. The final goal is to define only some
“dominant” points able to provide a good approximation of the
edge shape for its reconstruction in the matching process. The dominant points are recorded and linked by straight edges. The edges are extracted only in the regions of interest while areas where mismatches and blunders could occur are excluded with a manually masking approach.
- Edge matching between images. A multi-image matching approach, divided in three steps, is used. The first step is a modification of the Multi-Image Geometrically Constrained Cross Correlation (MIGC3) proposed in (Zhang, 2005). Using a MIGC3, the dominants points of each edge are matched in all the images in order to reconstruct the breakline positions in 3D (object space). The images are preliminarily undistorted (using the camera calibration data) in order to ease them into a central perspective and speed up the following processes. The MIGC3 is able to match a high percentage of the extracted dominant point. Nevertheless, more than one reliable homologous point can be possible if only high cross correlation values are considered. A relational matching technique has been developed in order to solve these ambiguous matches and to improve the rate of the successfully matched points by means of a probability relaxation (Christmas et al., 1995). The method uses
the already matched dominants points as “anchors” and defines,
in an iterative way, the more suitable match between candidates imposing a smoothing constraint. Finally, a Multi-Photo Least Square Matching (Baltsavias, 1991) with the epipolar constraint is performed for each extracted point to improve the accuracy up to a sub-pixel dimension.
- Edge filtering. Once a set of 3D edges has been created, possible blunders are deleted using a filter that considers the reciprocal point positions on the same edge: the position of a
point is “predicted” considering the neighbouring dominant
points of the edge and then the difference between the predicted and real position of the point is evaluated. If the difference value is higher than a threshold, the point is delete. This filter works well if the blunders are isolated from each other. Then, more robust filter can be used to correct the edges when several blunders are close together: this algorithm uses the point cloud to verify the correctness of each dominant point: when it is farther than a threshold from the point cloud, the point is deleted.
- Edge smoothing. The edges extracted by the image matching algorithm are random noise affected and they cannot be directly used in the drawing production or in the segmentation process. For this reason, a smoothing is needed in order to define a regular shape of the object, easing the edges in lines and curves. The great majority of edges in both close range and aerial applications can be classified in sets of lines and second order curves. Therefore, each edge must be split in different basic entities that describe its linear or curved parts separately and, each separate basic entity is simplified in lines and curves fitting the dominant point information with a robust least square approach.
- Edge exporting. Geometric edges are exported in CAD environments in order to give a good preliminary data for the graphic drawing realization of the survey or to be used as additional information in the segmentation and modelling processes.
2.1 Integrated edge extraction
The completeness of the edge extraction process depends on several factors such as illumination condition, image resolution and typology of object. According to these factors, the edge extraction can produce fragmented or incomplete edges that reduce the quality of the achieved information.
Figure 2. Extracted edges using different Canny’s thresholds.
For this reason, using a standard edge extractor on an image, incomplete results are usually produced. This problem can be partially solved decreasing the thresholds of the edge extractor (i.e. Canny operator), but this brings to an increase in the number of edges due to simple radiometric variations or shadows (Figure 2). The integrated edge extraction considers the range and image information in order to improve the continuity, length and reliability of the reconstructed edges in correspondence or in the closeness of only geometric discontinuities. As the conditions are very different in terrestrial and aerial acquisitions and the typology of objects to be detected is different too, two methods are used. In terrestrial applications, the goal is the detection of the geometric discontinuities of different shapes on the façade, while in aerial applications the building outlines and rooftops have to be detected. In both cases, the use of a model based approach is not flexible enough to correctly describe all the geometric discontinuities of a generic object. The common idea of these approaches is to reduce the regions where the edge extraction is performed using the range information. Edges are detected on the range data and then they are projected on the image defining a region of interest. In this way, the edges due to radiometric variations or shadows are almost completely ignored and only regions of the image in correspondence of geometric discontinuity are considered.
Figure 3. Integrated edge extraction workflow.
The algorithm works according to several steps (Figure 3), some of them performed only in aerial applications:
- Regularized DSM. The available range information is firstly regularized in order to define a depth image of the scene simplifying the successive computation steps. The regularization procedure, which considers the range information as 2.5D data, depends on the range data density and detail dimensions to be surveyed.
- ROI detection in the range data. Aerial acquisitions over a urban area usually considers 3 main classes of objects: ground (bare soil, grass, road, sidewalk, etc.), buildings and vegetation (i.e. trees). For this reason, the classification of building regions from range and image data is performed before the outlines and
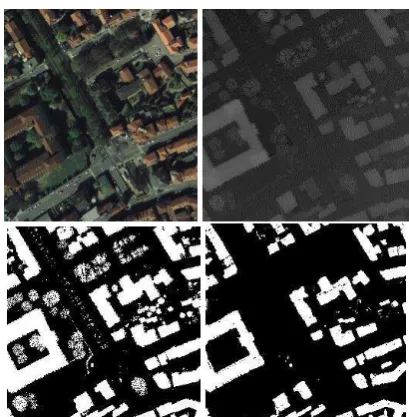
rooftop extraction. Simple RGB images and “single return” DSM (generated by LiDAR or image matching techniques) are used. To do that, different steps are performed. Off-ground data is formerly extracted from the data using the regularized range data (Figure 4). The simple assumption is that the height of a ground is lower than the heights of neighbouring non-ground points; the ground filtering is performed through an iterative regular grid filtering. This approach consider two different problems: (i) the ground height variations over a big region patch and (ii) the presence of big dimensions buildings that avoid to determine the ground height if a too little DSM patch is considered. For these reasons, the ground height is iteratively computed on different DSM patch dimensions.
The building terrain is then extracted from the off-ground data filtering the vegetation. To do that, the local height variability of the points is considered, as this value is higher in correspondence of vegetated areas than over manmade objects.
Figure 4. RGB image (upper left), regularized DSM (upper right), off-ground area (bottom left) and building (bottom right).
- Geometric edge extraction on range data. The geometric breaklines are extracted from the regularized range data (depth image) considering the gradients and the local curvature between adjacent pixels. This process is repeated both for each point of the depth image and the final result is a map of the geometric breaklines from the range data (Figure 5).
Figure 5. Geometric edge regions in aerial and terrestrial data.
- Projection of geometric edges on image. The breaklines detected on the depth image can be projected onto the oriented images. In this way, an interest region is defined in the image space and the edge extraction can be performed only in this area.
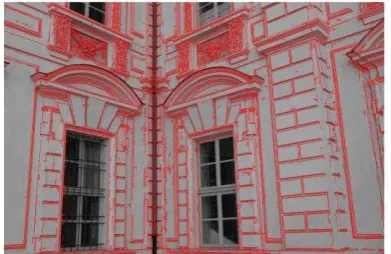
Figure 6. Geometric edge regions projected into the images.
- Edge extraction on image. The Canny’s operator thresholds are stressed in order to preserve the edge continuity. In
particular the lower threshold of the Canny’s algorithm is
further reduced in order to preserve the continuity between stronger edge points. The edges extracted with the Canny’s operator are approximated considering each point where the edge changes its curvature as a dominant point, and linking with a straight line the points comprised between two adjacent dominant points.
- Edge merging and filtering. Although the Canny’s thresholds are used in an adaptive mode, several edges can be divided or incomplete, thus requiring an aggregation strategy, in particular for long edges. The direction of the edge in correspondence of the extreme is computed considering the last dominant points of the edge. According to this direction a bounding box is defined and the presence of other edge extremes is looked for. When another extreme is found and the direction of the other edge extreme is similar, the edge is merged. The edges can be successfully merged only if the missing part of the edge is limited to few pixels.
(a) (b)
Figure 7. Edge merging process: the red box defines the bounding box for the merging process; violet lines defines the edge direction in correspondence of the extremes (red points).
- Extraction finishing and topological analysis. Several geometric features of a building cannot be described by using their radiometric content. To improve the completeness of the achieved results a combination of the geometric information and of the already extracted edges is considered.
Figure 8. Reconstruction of missing parts of the roof.
Roof outlines can be described by set of lines that are linked together in correspondence of knots (green points in Figure 8).
Then, each outline on the range data must have a corresponding outline on the image. According to this, the implemented algorithm firstly defines if the roof description is complete comparing the range and the radiometric data: when a missing part is defined the knots in correspondence of this area (red points in Figure 8) are considered. Then, a topological analysis is performed in order to evaluate if these knots can be linked together. In this analysis some rules are considered: (i) the new edge and the geometric one (on the range data) must have approximately the same direction (yellow region in Figure 8); (ii) knots to be merged must belong to the same building; (iii) the new edge must be “consistent” with the other extracted edges and the other knots of the same roof (e.g. the new edge must not intersect other building edges, etc.). In this way, the correct between different points can be defined when several edges can be merged together (green line in Figure 8).
3. TESTS
In the following, some results on both terrestrial and aerial images will be presented. The terrestrial test was realized considering a set of convergent images of an historical building. The aerial test was performed on a dense urban area over the city of Torino (Italy).
3.1 Terrestrial test
This test was performed on 5 images (GSD ca 2 mm) acquired on a corner of an historical building of Torino (Italy). The LiDAR data was acquired with 2 cm spacing resolution and it was regularized with the same step, as shown in Figure 9 (a). In this way, the regions where the geometric discontinuities occurred were detected (Figure 9 (b)).
(a) (b)
Figure 9. Regularized DSM (a) and geometric breaklines (b).
Figure 10. Extracted edges on the reference image (about 96000 dominant points).
With such images the integrated edge extraction improved the completeness of the achieved information merging edges that can be divided or separated (Figure 10). The matching process allowed to determine the 3D position of the dominant points. These points were finally smoothed and eased in lines and curves (Figure 11).
Figure 11. Achieved 3D results in the terrestrial test.
3.2 Aerial test
The dataset contains 6 aerial images (DMC Z/I Imaging-Hexagon Geosystems, GSD=12 cm) and 1m regular spacing DSM (single return) over a urban area of Torino (Italy). The test area (ca 0.5x0.5 km) is characterized by several high buildings, trees and variation of the ground height (Figure 12 (a)). From the available DSM, the buildings were extracted and the ground and the trees were filtered according to the algorithm described in the former section. The result (Figure 12 (b)) is complete and correct even if some problems still remain where the vegetation is very close to buildings, as shown in the lower left part of the figure. In these conditions some trees are still classified as buildings.
(a) (b)
Figure 12. Regularizad DSM (a) and building regions (b).
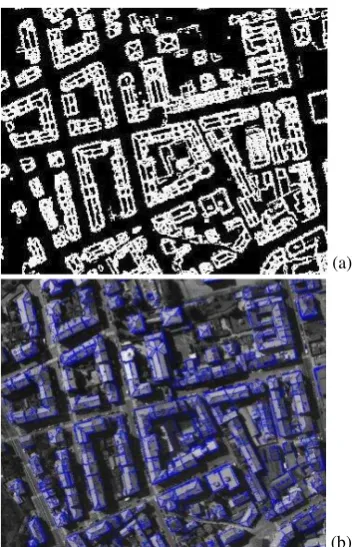
The building rooftops and outlines were finally extracted on the same area (Figure 13). It can be noted that the results are complete and the areas of interest on the buildings are correctly detected. The regions detected in Figure 13 (a) were projected in the reference image to limit the edge extraction. The edges extracted on the image were finally filtered to delete the ones shorter than 20 pixels. The result after the whole process is shown in Figure 13 (b). Most of the building outlines and rooftops were correctly detected. Few lines are missing in correspondence of bad textured areas, but the number of useless points on the roofs and in proximity of buildings was reduced thanks to the filtering of the edges.
(a)
(b) Figure 13. Roof outlines in the range data (a) and corresponding
extracted edges on the images (b).
The merging of adjacent edges and the extraction finishing improved the quality of the result. The extracted edges were finally matched and smoothed. The final 3D result is shown in Figure 14.
Figure 14. Achieved result in the aerial test.
The reported results, if compared to a former tests (Lingua et al. 2010) on the same area, show a significant improvement thanks to the integrated edge extraction that allowed to delete before the matching process the useless edges in correspondence of shadows and radiometric variations, increasing the completeness of the 3D product.
4. CONCLUSIONS AND FUTURE DEVELOPMENTS
In this paper an improved integrated approach for edge extraction from terrestrial and aerial images have been shown.
The method exploits both range and image information in order to provide for reliable and complete 3D edges useful for mapping and drawing purposes. The presented approach could complete the information provided by a LiDAR point cloud, that is generally unable to define the precise position of object breaklines and usually smooth the geometries of the surveyed objects. The proposed method gives also a complementary information with respect to dense matching algorithms as the extracted edges are concentrated in proximity of object breaklines and they are usually longer and more reliable. The use of low resolution images or poor GSDs make the edge extraction more difficult and unreliable, delivering incomplete and very noisy edges. The integrated edge extraction presented in this paper partially solves this problem. The merging of adjacent edges is still insufficient to reconstruct and complete edge extraction process when the edge missing parts are long. For these reasons a good image resolution is recommended. The aerial test has underlined the improvement that the integrated edge extraction provide to the final result. The feature extraction from the range data allows to detect the buildings outlines and rooftops in an almost complete way, reducing and easing the following edge extraction on the image. Then the edges are successfully filtered exploiting their geometric properties, i.e. their straightness and length. At the end of this process, approximately the 90% of building outlines has been detected on the images. Finally, the matching process and the smoothing allow to deliver more complete 3D edges. The topological analysis has shown to be strongly influenced by the resolution of the DSM: 1m spacing DSMs are not sufficient
to “drive” the reconstruction of the edge in a complete and
satisfying way as their information is too rough to be used on high resolution images. On the other hand, the use of only radiometric edges positions is insufficient to reconstruct the roof geometry in a proper way.
REFERENCES
Alshawabkeh, Y., 2006. Integration of laser scanning and photogrammetry for cultural heritage. PhD Thesis Institut für Photogrammetrie der Universität Stuttgart.
Awrangjeb, M., Ravanbakhsh, M., Fraser, C.S., 2010. Automatic detection of residential buildings using LiDAR data and multispectral imagery. ISPRS Journal of Photogrammetry and Remote Sensing 65, pp. 457-467.
Baltsavias, E., 1991. Multiphoto geometrically constrained matching, PhD Thesis, ETH Zurich, Switzerland.
Barazzetti, L., Remondino, F., Scaioni, M., 2011. Automated and accurate orientation of complex image sequences. In:
International Archives of Photogrammetry, Remote Sensing and
Spatial Information Sciences XXXVIII (5/W16) - 4th
International Workshop 3D-ARCH 2011, CD-ROM.
Christmas, W. J., Kittler, J., Petrou, M., 1995. Structural Matching in Computer Vision Using Probabilistic Relaxation.
PAMI 17(8), pp. 749-764.
Demir, N., Poli, D., Baltsavias, E., 2009. Detection of buildings at airport sites using images & LiDAR data and a combination of various methods. In: International Archives of Photogrammetry and Remote Sensing and Spatial Information Sciences, XXXVIII(3/W4), pp. 71-77.
Gehrke, S., Morin, K., Downey, M., Boehrer, N., Fuchs, T.,
“Semi-global matching: an alternative to LiDAR for DSM generation?, 2010. In: International Archives of Photogrammetry and Remote Sensing and Spatial Information Sciences, Canadian Geomatics Conference XXXVIII(1).
Habib, A.F., Zhai, R., Kim, C., 2010. Generation of complex polyhedral building models by integrating stereo aerial imagery and LiDAR data. Photogrammetric Engineering & Remote Sensing 76, pp. 609-623.
Habib, A. F., Chang, Y-C., Lee D. C., 2009. Occlusion-based methodology for the classification of LiDAR data.
Photogrammetric Engineering & Remote Sensing 75(6), 703-712.
Hiep, V.,H., Keriven R., Labatut, P., Pons J-P., 2009. Towards high resolution multi-view stereo. Proceedings of: Computer Vision and Pattern Recognition, pp. 1430-1437.
Hirschmüller, H., 2008. Stereo processing by semi-global matching and mutual information, In: IEEE Transactions on Pattern Analysis and Machine Intelligence 30(2), pp. 328-341.
Lingua, A., Nex, F., Rinaudo, F., 2010. Integration of airborne laser scanner and multi-image techniques for map production. Proceedings of: SPIE Remote Sensing 7831, pp. 14-28.
Nex, F., 2010. Multi-image matching and LiDAR data new integration approach, PhD Thesis, Politecnico di Torino, Torino.
Paparoditis, N., Souchon, J-P. Martinoty, G., Pierrot-Deseilligny, M., 2006. High-end aerial digital cameras and their impact on the automation and quality of the production
International Archives of Photogrammetry and Remote Sensing and Spatial Information Sciences, XXXVII. Part B3a. Beijing 2008.
Zebedin, L., Klaus, A., Gruber-Geymayer, B., Karner, K., 2006. Towards 3D map generation from digital aerial images. ISPRS Journal of Photogrammetry & Remote Sensing 60, pp. 413-427.
Zhang, L., 2005. Automatic Digital Surface Model (DSM) generation from linear array images. PhD Thesis, ETH Zurich, No. 16078, IGP Mitteilung N. 90.
ACKNOWLEDGEMENTS
This work was funded by the 7° Framework Programme
2007-2013 under the name “CIEM Project” (co-founded by Marie-Curie Actions 7° P.Q. - PCOFOUND- GA-2008-226070,
acronym “Trentino Project”).