ANALYZING RCD30 OBLIQUE PERFORMANCE IN A PRODUCTION ENVIRONMENT
M. E. Soler a, W. Kornus, A. Magariños, M.Pla
Institut Cartogràfic i Geològic de Catalunya, 08038 Barcelona, Spain – (eulalia.soler, wolfgang.kornus, antonio.magarinos, maria.pla)@icgc.cat
Commission III, WG III/1
KEY WORDS: Oblique imagery, Point Cloud, Mesh, Accuracy Analysis, Normalized Difference Vegetation Index, Line Spread Function.
ABSTRACT:
In 2014 the Institut Cartogràfic i Geològic de Catalunya (ICGC) decided to incorporate digital oblique imagery in its portfolio in response to the growing demand for this product. The reason can be attributed to its useful applications in a wide variety of fields and, most recently, to an increasing interest in 3d modeling. The selection phase for a digital oblique camera led to the purchase of the Leica RCD30 Oblique system, an 80MPixel multispectral medium-format camera which consists of one Nadir camera and four oblique viewing cameras acquiring images at an off-Nadir angle of 35º. The system also has a multi-directional motion compensation on-board system to deliver the highest image quality.
The emergence of airborne oblique cameras has run in parallel to the inclusion of computer vision algorithms into the traditional photogrammetric workflows. Such algorithms rely on having multiple views of the same area of interest and take advantage of the image redundancy for automatic feature extraction. The multiview capability is highly fostered by the use of oblique systems which capture simultaneously different points of view for each camera shot. Different companies and NMAs have started pilot projects to assess the capabilities of the 3D mesh that can be obtained using correlation techniques. Beyond a software prototyping phase, and taking into account the currently immature state of several components of the oblique imagery workflow, the ICGC has focused on deploying a real production environment with special interest on matching the performance and quality of the existing production lines based on classical Nadir images.
This paper introduces different test scenarios and layouts to analyze the impact of different variables on the geometric and radiometric performance. Different variables such as flight altitude, side and forward overlap and ground control point measurements and location have been considered for the evaluation of aerial triangulation and stereo plotting. Furthermore, two different flight configurations have been designed to measure the quality of the absolute radiometric calibration and the resolving power of the system.
To quantify the effective resolution power of RCD30 Oblique images, a tool based on the computation of the Line Spread Function has been developed. The tool processes a region of interest that contains a single contour in order to extract a numerical measure of edge smoothness for a same flight session. The ICGC is highly devoted to derive information from satellite and airborne multispectral remote sensing imagery. A seamless Normalized Difference Vegetation Index (NDVI) retrieved from Digital Metric Camera (DMC) reflectance imagery is one of the products of ICGC’s portfolio. As an evolution of this well-defined product, this paper presents an evaluation of the absolute radiometric calibration of the RCD30 Oblique sensor. To assess the quality of the measure, the ICGC has developed a procedure based on simultaneous acquisition of RCD30 Oblique imagery and radiometric calibrated AISA (Airborne Hyperspectral Imaging System) imagery.
1. INTRODUCTION
The Institut Cartogràfic i Geològic de Catalunya (ICGC) is the mapping agency of the Government of Catalonia. Created in late 1982, ICGC’s activities have been focused on providing valuable geoinformation for territorial planning by generating raster and vector databases at different scales ranging from 1:1 000 to 1:1 000 000. Nowadays, although maintaining up-to-date information at smaller scales, the ICGC is also very concerned about the specific geoinformation required for managing the ever growing urban areas (UN World Urbanization Trend forecasts that 86% of the population of the developed world will live in urban areas by 2050). This effort is not only a matter of working at large scales (1:1 000 and larger), but also to adopt
and develop the specific techniques which better describe the urban ecosystem from many different points of view: urban morphology, energy efficiency, sustainability and environmental applications, etc.
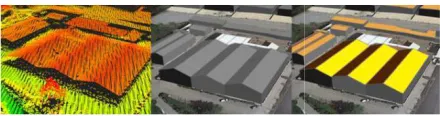
Some of the environmental or energy efficiency applications developed at ICGC for urban planning (such as light pollution, thermal efficiency, Urban Heat Island analysis) are related to specific hyperspectral surveys, but there is an increasing requirement of including detailed and photorealistic 3D models for specific morphological analysis and as a base layer of the urban information infrastructure, moving from 2D to 3D environments.
Figure 1. 3D Ortho vs 2D Or
LoD1 city models are being regularly produc ICGC as a by-product of the 1:1 000 top LoD2 city models from LiDAR point cloud as intermediate information when develop efficiency applications such as photovoltaic s
Figure 2. Point cloud. LoD2 buildings. photovoltaic suitability
The ICGC acquired the oblique camera syste objective of adding a new urban sensor to enables not only the creation of photorealist multi-view pixel-based algorithms, but also current product portfolio. In such evolutio aims at increasing the productivity of the ob by maximizing the number of application captured information, including 3D meshe façade textures, NDVI orthoimagery and ste capture at 1:1000 scale.
Establishing robust production pipelines rel camera system requires an in-depth stud capabilities. Therefore, this paper presents analysis of the oblique system based on med cameras. The analysis focuses on differe system. On the one hand, the study radiometric suitability of the RDC30 camera applications and stereo plotting at urban s hand, the study of the automated aerial tria and oblique blocks which is challenged images involved in the high-overlap flight su resolution variations along the oblique performance of dense point matching ac viewing directions.
Figure 3. High overlap data capture configuration
Ortho.
duced in urban areas at topographic database. uds are also generated oping specific energy ic suitability.
s. LoD2 building +
stem in 2014 with the to its portfolio, which listic 3D meshes using so the evolution of the tion, ICGC’s analysis oblique flight surveys ons derived from the shes, point cloud and stereo-models for data
relying on the oblique tudy of the sensor’s triangulation of Nadir d by the number of surveys, the scale and ue images and the across the different
re in maltese-cross
2. RCD30 OBLIQUE
From the whole set of models pres finally decided to acquire in 2014, by Leica: a 60Mpixel multispec which consists of one Nadir and fo towards the four cardinal points a The system can easily be upgrad multi-directional motion compen deliver high quality images.
Three different block configuratio carry out the camera assessment:
T1: Geometric study has been perf images collected with the RCD30 flying altitude (AGL) with 80% s block was flown in northeast – so and a resulting GSD of 8 cm. Ab were taken from each camera.
T2: For the radiometric assessmen the AISA Eagle II hyperspectra configuration chosen, with a flyin knot of speed, produced 126-band a resulting GSD of 1m. At the same was collected with the RCD30 Ob endlap and 17 cm GSD.
T3: A block of 240 images collecte with 60% sidelap and enlap was a evaluation. The resolution pattern of the image. The resulting GSD f cm.
For the acquisition process, the RCD on a PAV gyro-stabilized suspe conditions during the flight tests we
3. AERIAL TRIAN
A sub-block of 866 images extract has been triangulated using the Tr package (Match-AT). Approximat were taken from each camera. For of 16 control and check poin distributed over the block.
The simultaneous image capture w image overlap resulted in a ve connections causing long processin Although the setting parameters o highly restrictive to reduce the am much as possible, an average of correlated including points connec process took 31 hours on a 64-threads, local image storage). After distribution to approximately 100 adjustment took less than 10 minut
The following input data was intr approximately 87000 image point standard deviation σ of 2 micron
resent in the market, the ICGC 14, the RCD30 oblique featured ectral medium format camera d four oblique cameras viewing at an off-Nadir angle of 35º. aded to 80 Mpixels and has a ensation on-board system to
tions have been considered to
erformed with a block of 10095 30 Oblique camera from 770 m sidelap and 70% endlap. The south-west direction, 36 strips About 45 shots per flight line
ent, a simultaneous flight with tral sensor was planned. The ing height of 1650 m and 120 d AISA four strips images with me time, a block of 240 images Oblique with 60% sidelap, 40%
cted from 730 m flying altitude s acquired for spatial resolution rn was located in different parts for this configuration was 7.5
RCD30 Oblique was mounted spension mount. The weather were excellent.
IANGULATION
acted from the T1 configuration Trimble Inpho v7.0.2 software ately 11 images per flight line For accuracy assessment a total oints were available, evenly
e with 5 cameras and the high very high degree of image sing times for image matching. s of the matching module were amount of matched points as of 700 points per image were necting up to 112 images. The -bit server (16GB RAM, 16 fter thinning out the dense point 00 points per image, the block
utes.
introduced into the adjustment: int coordinates with an a priori The International Archives of the Photogrammetry, Remote Sensing and Spatial Information Sciences, Volume XLI-B3, 2016
points (σ = 4 cm for X, Y and Z). The considered shift and drift parameters measurements, IMU misalignment and s parameters for each camera).
Self-calibration led to significantly impr Trimble Inpho software allows applying tw self-calibration parameters: the 12 so-called (Ebner, 1976) and the 44 so-called Grün 1979). Figure 4 shows the averaged r coordinates for the Nadir image derived fro without self-calibration. The mayor systema compensated by applying self-calibration w The set of 12 parameters did not result in sat accuracy.
Figure 4. Calculated distortion grid for
From 12 independent check points, RMS ob of 3.2 cm in X, 4.5 cm in Y and 6.6 cm i Figure 5 shows the graphical representat control and check point residuals.
Figure 5. Horizontal (left) and vertical ( ground control points (triangles) and check p
This well characterized block-configuration preferred to generate preliminary dense subsequent textured meshes using Smart3DContextCapture software package (A
4. RADIOMETRIC CALIBR
The availability of remote sensing data, eith manned and unmanned airborne platforms, i more due to their useful applications in a wi Airborne photogrammetric systems are abl resolution imagery over large areas in a tim increasingly used for different application monitoring and environmental conditions
e adjustment settings ers of the GNSS self-calibration (44
proved results. The two different sets of lled Ebner parameters ün parameters (Grün, wide variety of fields. able to provide high-exploitation of photogrammetric increasingly emphasizing the ro calibration through the incorpora involving radiometric calibration o step basically translates the recorde physical information (radiance) us pixel level that are estimated b measurements. As a matter of sensor manufacturers, usually d geometrically high-performance sy absolute calibration of their sensors provide the constant values to cust a workflow to generate radio automatically.
The aim of this section is to asses calibration workflow included in software package for the RCD30 P operated at ICGC. To evaluate th ICGC has developed a procedur acquisition of RCD30 oblique ima hyperspectral sensor.
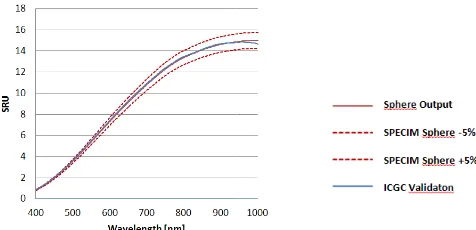
The AISA Eagle II, which is reg calibrated once a year by SPECI facilities after calibration and systematic validation of its radiom This protocol follows these steps:
1. AISA Eagle II sensor is the Integrating Sphere
2. Acquisitions of (approx.) of dark lines are carried o
3. Image is radiometricall pixel calibration coefficie
4. Radiance information of averaged (being the ima the sphere, only the centr illuminated).
5. Radiance is compared curve of the Integrating (National Physical Lab shows the resulting comp
Figure 6. Absolute radiometric ca validation at ICGC
metric precision, radiometric of data processing for the ic data. The ICGC has been role of absolute radiometric oration of innovative products n of data into its portfolio. This rded digital numbers (DNs) into using correction coefficients at by integrating sphere in-lab f fact, even photogrammetric devoted to the design of systems, take great care of the ors. Nowadays, they are able to ustomers and, at best, to include iometrically-corrected images ometric precision is carried out.
is placed about 20 cm far from
x.) 500 lines and 5 milliseconds d out.
ally-corrected using pixel-by-icients.
of illuminated pixels is time-mage taken at a distance from
ntral part of the field of view is
d with the spectral radiation ting Sphere provided by NPL aboratory) in UK. Figure 6 mparison.
calibration of AISA Eagle II The International Archives of the Photogrammetry, Remote Sensing and Spatial Information Sciences, Volume XLI-B3, 2016
The validation procedure demonstrates the reliability of the AISA absolute calibration as a reference to assess the radiometric performance of RCD30 images. With this aim, the 126 useful AISA spectral bands (T2 block-configuration) have been integrated according to RCD30 spectral filters leading to 4-bands imagery that can be used for the assessment in a consistent manner.
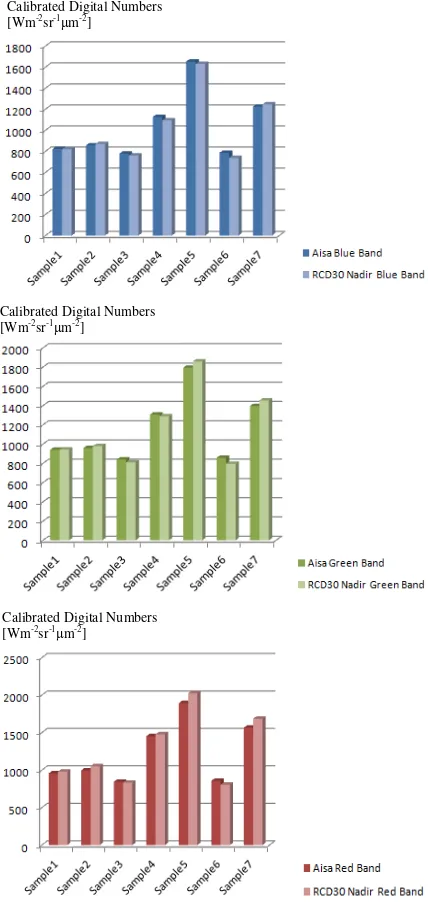
The evaluation has been carried out for each channel separately over seven terrain samples representing a heterogeneous set of land covers (e.g. forest, field, asphalt, bare soil, etc.). Thus, a difference image has been calculated from both AISA and RCD30 acquisitions. The statistics computed for each sample show an averaged difference of 22.91 W/m2sr-1µm between blue band calibrated images. Moreover, the averaged difference values found in green, red and near infrared channels are 36.33, 59.66 and 37.04 W/m2sr-1µm respectively. Figures 7, 8, 9 and 10 show the mean values obtained from the histogram of each sample in both AISA and RCD30 calibrated images.
Figures 7,8,9,10. Histogram mean values computed for each sample and each band. Y axis represents Radiance
As a final summary of the previous measures, Table 1 shows the relative error of the RCD30 absolute calibration.
Blue Green Red Near
Infrared Relative
error (%)
2.44 3.26 4.57 2.1
Table 1. Relative error of the RCD30 absolute calibration
5. IMAGE RESOLUTION
Spatial resolution has become a key quality factor of the photogrammetric sensors, especially with the advent of digital sensors in the market. In this case, the spatial resolution is limited by the measure in pixel, yet it rarely coincides with the nominal resolution due to blurring and noise effects. They are caused by many factors. The main ones are the atmosphere (e.g. visibility, haze), the illumination geometry (sun height), the camera design (e.g. CCD, motion compensation, optic), the flight configuration and acquisition settings (e.g. flight speed, flight altitude, exposure, aperture) and data post processing (Read & Graham, 2002).
The visual identification of targets was the most used procedure to assess the resolving power of an optical system. USAF 1951 was especially recognized amongst the rest of patterns due to it wider use. In the last decades, photogrammetric systems have shown important improvements of resolution capabilities, strengthening the importance of image quality. With the same aim, automatic methods developed to assess the performance of a system based on profiles of sinusoidal intensity and their evaluation by means of the Spread Functions (SF, image space) or the Modular Transfer Function (MTF, frequency space).
Since the acquisition of the first Z/I DMC camera, the ICGC has an in-house methodology supported by the Line Spread Function (LSF) intended to provide a resolving measurement of an image in pixel magnitude. The program processes a region of interest that contains a single contour and performs a minimum least squares adjustment over a bi-dimensional function of the edge modeled by a sigmoid function:
(2) Calibrated Digital Numbers
[Wm-2sr-1µm-2]
Calibrated Digital Numbers [Wm-2sr-1
µm-2]
Calibrated Digital Numbers Calibrated Digital Numbers [Wm-2sr-1
µm-2]
The five parameters estimated by the least are used to achieve the analytical expression Function in the image space. The FWHM ( Maximum) over the LSF is considered a value of the effective resolution.
5.1. Theoretical expectations
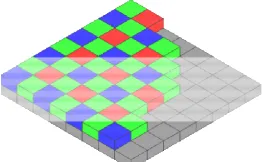
Image formation is performed by means demosaicking procedure for each camera hea used color device typically alternates red a odd rows and blue and green filters for even two-by-two cell, the green filters double the (Figure 11). Since demosaicking is carried o interpolation approach, the final image giv values for green band in both Nadir and obliq
Figure 11. Bayer pattern
Furthermore, the resolution is not constant since the image scale decreases with the from the image center. The pixel size in border on the ground (x) is obtained fro relationships shown in Figure 12 and describ
where:
α = tilt angle h = flying height p = pixel size in image f = focal length d = image side length/2
st squares adjustment ion of the Line Spread (Full Width at Half as the measurement
ns of a Bayer filter head. This commonly- and green filters for ven rows: within each the blue and red ones out through a spatial ives better resolution blique images.
rn
nt for oblique images e increasing distance in the oblique image from the geometrical ribed in equations (3):
Figure 12. Geometry o
The scale reduction factors in the (y direction) are shown in Figure obtained by projecting a regular gr comparing the distances of the given by the nominal scale ( According to these reduction fact size, the resolution varies from lines/mm to 74 lines/mm along the
Figure 13. Resolution reduction fa along flight direction. Position with
5.2. Results obtained with RC Siemens Star targets
The algorithm has been applied on on a canvas surface of 50m2 (Figu for both Nadir and oblique generalization, the analysis has be camera (Forward) which has acq different images. In each of them different location within the imag Moreover, in order to compensate the measure, the algorithm has bee pattern. The final effective resoluti 2 and 3 has been calculated by aver
Flight Direction
mm
y of a tilted camera
area of one component image ure 13. The graphic has been r grid from object to image and e points to nominal distances (Honkavaara et al., 2006). actors and the 5.2µm of pixel a nominal RP value of 129 he flight direction.
factors for the Forward camera ithin the image is given in mm.
RCD30 aerial images and
on a Siemens star target painted gure 14) that has been captured cameras. Without loss of been restricted to one oblique acquired the bar pattern in 3 m the pattern was imaged at a age (T3 block-configuration). ate for the directional effect of een applied on each edge of the lution measure shown in Tables veraging these values.
RP Reduction factors
mm The International Archives of the Photogrammetry, Remote Sensing and Spatial Information Sciences, Volume XLI-B3, 2016
Figure 14. Siemens star quarter used for the resolution study
Resolution (pix)
Red Green Blue
Nadir 1.9 1.3 2.2
Oblique 3.1 2.4 3.6
Table 2. Effective resolution results for Nadir images in pixels
Forward Pattern location in image (y axis, in milimeters)
Resolution (pixel, green
channel)
Image 1 -9.38 2.23
Image 2 6.16 2.41
Image 3 18.31 2.60
Table 3. Resolution measurements as a function of the location in the image
These results prove that the image formation procedure has the major influence on the effective resolution. Typically, cameras with a single CCD for every channel, such as DMC, show a worsening of the effective resolution as the wavelength decreases due to Rayleigh scattering. Conversely, RCD30 presents the best resolution values in green channel, while the gap between red and blue values appears as a consequence of atmospheric dispersion. In addition, mainly for the oblique cameras, the values show that the location of the object within the image greatly affects the resolution, since the tilted geometry leads to different optical path lengths for every pixel. Finally, the reduction factors obtained for oblique images must be taken into account when translating the pixel value into the object space. As a consequence, the ground sampling distance will not be constant.
6. STEREO PLOTTING
Besides the geometric and radiometric assessments, a qualitative analysis on the usability of the RCD30 Oblique imagery for stereo plotting purposes has been carried out. Stereo pairs have been generated using Nadir images and visualized in a 3D environment in order to evaluate the usefulness of these images in a production workflow for creation and updating of topographic databases covering urban areas with a level of detail equivalent to 1:1000 scale (T1 block-configuration). The approximately 70% overlap is not the best configuration to achieve a good Base-Height ratio, but the use of only alternative images for the generation of the stereo pairs was discarded because they would not cover completely the area.
In the stereo plotting tests three aspects have been considered: the visualization of the stereo pairs, the photointerpretation of the real world objects and the positional accuracy of the digitation.
Related to the quality of the images, it has been seen that the main limitation of RCD30 Oblique images is the high number of fuzzy images, which hinder the stereoscopic vision and visual fatigue, and may provide poor accuracy in positioning and measuring. However, since the production phase is still in an early state of deployment, the reasons concerning blurred images have to be analyzed in more detail.
Figure 15 shows an example to illustrate the reason of the stereoscopic problems.
Figure 15. Clearness differences between left image and right image of the same stereoscopic model.
Another problem detected is the loss of resolution in the extremes of the images (section 5), as is showed in the road of Figure 16, which also makes uncomfortable data capture and updating.
Figure 16. Clearness differences between the extreme part (left) and centre (right) of the same image.
The photointerpretation has been based on the ICGC catalogue that includes the features and the attributes collected in the urban topographic database at 1:1000 scale. Using the RCD30 stereomodels, the recognition of the required level of detail for this database has widely achieved.
As in the case of aerial triangulation, the positional accuracy of stereoplotting has been assessed by comparing the coordinates of independent check points with the coordinates of the same point measured in the stereoplotter. Table 4 allows comparing the positional accuracy achieved with the RCD30 images and the DMC aerial images at 9cm nominal pixel, in which usually is based the ICGC stereoplotting process. The positional accuracy required for the topographic database at scale 1:1000 is 20cm in X,Y and 25cm in H.
90% X (m) 90% Y (m) 90% H (m) RCD30 Nadir
images 0.08 0.07 0.10
DMC images 0.143 0.150 0.169
Table 4. Positional accuracy.
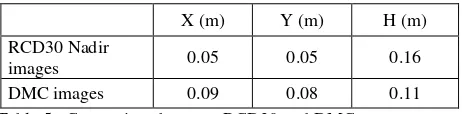
An additional positional check has been performed comparing the results of measuring a point from different stereo pairs. This comparison provides an estimate of the different cumulative errors from the orientation and positioning processes. Table 5 shows that the differences in measurements from different stereo pairs are, in comparison with to the DMC images, better in coordinates X and Y and not so good in elevation.
X (m) Y (m) H (m)
RCD30 Nadir
images 0.05 0.05 0.16
DMC images 0.09 0.08 0.11
Table 5. Comparison between RCD30 and DMC measurements resulting from orientation and positioning
This loss of accuracy in elevation, compared to the good results obtained in the coordinates X and Y, are likely due to the poor Base-Height ratio of the stereo pairs mentioned above.
7. SUMMARY AND CONCLUSIONS
RCD30 Oblique images prove to be suitable for all the purposes analyzed in the study. Preliminary results in aerial triangulation have shown that sub-pixel accuracy can be routinely achieved in production flights. Nevertheless, efficient time consumption for image matching and least-squares bundle adjustment involving the five cameras is a key point to improve in order to achieve a efficient production line. Taking advantage of the redundant information generated through the five cameras and the high overlaps, preliminary dense point clouds and subsequent textured meshes have been generated using the Bentley Smart3DContextCapture software package and T1 block-configuration.
Concerning the radiometric calibration a validation process of the workflow included in the post-processing software package has been proposed. The methodology developed -based on the comparison between AISA Eagle II and RCD30 simultaneous acquisitions- has demonstrated the suitability of the RCD30 calibrated data for remote sensing applications.
Regarding the resolution of RCD30 images resolution measures have been generated from a Siemens Star target whose dimensions are known. The measurement FWHM extracted from the LSF function provides a specific quantification of the resolving power of the system. The results have shown the impact of the image formation process (Bayer filter) on the effective resolution, as well as the position of the objects within the image due to the different optical path length that has to be covered for every pixel. In addition, the description of the tilted geometry for the oblique cameras has been included in the section. The projection of a regular grid from the object to image space and the comparison between distances of the points to nominal distances have provided the reduction factors of the resolution along the camera pointing direction.
From the stereoplotting point of view, the conclusion is that RCD30 stereopairs from Nadir images are suitable to achieve the positional accuracy and to identify and classify properly the elements included in the catalogue of the ICGC topographic database at 1:1.000 scale, which are the required to create or update the information on urban areas. Main limitation using the RCD30 images is related to the resolution variation within the images, which difficult the stereoscopic vision and produce visual fatigue. Preliminary results for positional accuracy have allowed us to provide firsts comparison values between DMC and RCD30. However, future tests at different scales and different configuration overlaps must be carried out to generalize the comparison in a more rigorous manner.
ACKNOWLEDGEMENTS
We would like to thank the hard job done by Andrés Alvarruiz and Joan Marimón for the measurements of the check points used in aerial triangulation and stereoplotting assessment. Furthermore, we really appreciate the collaboration of Joan Arnaldich in the development of specific software tools to efficiently handle the increase of data involved, as well as the cooperation of Luca Pipia, Anna Tardà and Ramon Alamús with the AISA Eagle II flight survey planning and data processing.
REFERENCES
Ebner, H., 1976.Self-calibrating block adjustment, ISP-congress Helsinki 1976, Int. Archive of the ISPRS, Vol 18-3
Grün, A., 1979. Self-Calibration versus Testfield Calibration, ISP WG III/3, Aalborg 1979.
Read, R.E, Graham, R.W.,(2002).Manual of Air Survey: Primary Data Acquisition. Whittles Publishing, Caithness. 408 p.
Honkavaara, E., Jaakkola, J., Markelin, L., Becker, S., 2006. Evaluation of Resolving Power and MTF of DMC. In proceedings of ISPRS Comission I Symposium, Paris.