DETERMINING SUITABLE AREAS FOR MORE EFFICIENT HAZELNUT
PRODUCTION
*E. Saralioglu a , D. Yildirim a , O. Gungora ,
aKTU, Dept. of Geomatic Engineering, 61080 Trabzon, Turkey (ekrem.saralioglu, dyildirim, ogungor)@ktu.edu.tr
Commission II, WG II/3
KEY WORDS: Hazelnut, MCDM, Suitable Area
ABSTRACT:
Turkey is the largest hazelnut producer and exporter in the world with approximately 75% worldwide production and 70-75% of world exports, yet according to FAO; annual yield gain rate is significantly lower than Italy and USA. While Turkey produces 0.94 ton/hectare hazelnut, average yield rates for USA, Italy and Spain are 2.6 ton/hectare, 1.68 ton/hectare and 1 ton/hectare, respectively. Hazelnut production in Turkey is primarily concentrated along Black Sea coast centered Giresun and Trabzon provinces. The purpose of this study is to propose a methodology to further improve the efficiency in hazelnut production by determining the most significant geographical criteria and using them for spatial queries and analysis in ArcGIS environment to detect most fertile hazelnut plantation areas. For the study, the Surmene district of Trabzon is selected for pilot region. A thematic map of hazelnut plantation areas created from the classification of WorldView-2 image of the district was used as the base map. Furthermore, a database is created with layers and cost maps using multicriteria decision methods. Detected most suitable areas for hazelnut production area are compared with the present situation. Proposed methodology and the database can be used by officials for better management of hazelnut production in Turkey, therefore in the world.
1. INTRODUCTION
Turkey, the leading hazelnut producer and exporter in the world, makes 79% of the entire hazelnut production. Italy, Spain and USA are other important hazelnut exporters. When it comes to hazelnut importation, European countries, which have advanced food industry with products such as chocolate and candy, are more dominant (Aktaş et al., 2009). In Turkey, hazelnut cultivation plays an important role in economic,
environmental and rural development (Taşdemir and Reis,
2011). Turkey has been the leading hazelnut producer in the world for a long time (Yavuz, 2005). Hazelnut product provides a 1.5 billion dollars of foreign currency inflow, and a significant amount of the population rely on it as a mean of living. Another socioeconomic reason that the hazelnut product plays an
important role in Turkey’s economy is that it can be turned into
a semi-finished product and it provides an important source of
employment in marketing stage (Yazıcı, 2013). However,
Turkey is still behind of the hazelnut producers like Italy and USA in terms of the yield obtained from hazelnut cultivation. In Turkey, USA, Italy and Spain, yield per hectare is 0.94 tones, 2.6 tones, 1.68 tones and 1 tones (FAO). Low hazelnut yield has a negative effect on international competitiveness of Turkey. As can be seen, hazelnut product has a high economic value for Turkey. Hence, it is important to take control of hazelnut cultivation areas and to increase their yields in terms of the contribution made to the economy of the country.
In this study, a 3D model of the study area was generated in GIS environment by using the thematic image and DEM. Slope, aspect and wind analysis were then conducted to investigate whether or not the hazelnut cultivation areas satisfy the criteria for a successful hazelnut production. Also, the answers of these questions were sought in this study:
*Corresponding author
“In which slope interval hazelnut production is currently
made?” and “In which areas hazelnut cultivation results in
better yields?”. On the other hand, in Turkey, there is not a
robust and up-to-date database about hazelnut product and its extent. Satellite imageries, which have been used increasingly in recent years, provide great convenience to satisfy this need. Besides, European Union (EU) demands information relating to the types of the agricultural products and their extents. In this study, the locations and extents of hazelnut cultivation areas were determined to generate a robust database and to analyze the current status to increase the yield obtained from hazelnut. Hence, an important criterion of the EU regarding the agriculture will be satisfied.
1.1. Study Area
Study area is in the Kumru district of Surmene, which is a town
in the city of Trabzon. Surmene (40° 52´ N, 40° 07´ E) is
situated in the Black Sea region of Turkey and includes a huge amount of tea plantation areas. 80% of the population of Surmene make their living in agriculture. Tea and hazelnut are the most income-generating agricultural products in the town (URL-1).The study area can be seen in Figure 1.
The International Archives of the Photogrammetry, Remote Sensing and Spatial Information Sciences, Volume XLI-B2, 2016 XXIII ISPRS Congress, 12–19 July 2016, Prague, Czech Republic
This contribution has been peer-reviewed.
Figure 1. Study area in Kumru district of Surmene
2. METHODOLOGY
2.1. Image Classification
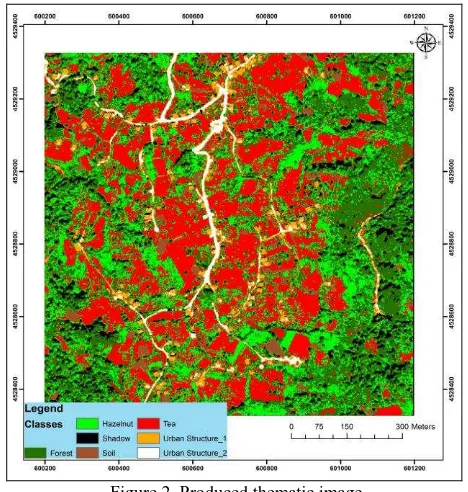
Akar and Gungor (2015) increased the performance of the Random Forest classifier by integrating texture information to the classifier. They used two WorldView-2 multispectral images (one taken in summer and one taken in winter) to which atmospheric and radiometric correction were already applied. In that study, they rectified the images as a first step to eliminate the geometric errors. They classified the geometrically corrected images by using Random Forest classifier. The data was classified into seven classes as forest, hazelnut, tea, residential area 1, residential area 2, soil and shadow. Then, they integrated the texture information extracted by using the GLCM (GrayLevel Co-occurance Matrix), NDVI (Normalized Difference Vegetation Index), Gabor filter and Curvelet transformation to the Random Forest classifier to separate the tea and hazelnut products from other spectrally similar vegetation. They concluded that the use of the Gabor filter increased the classification accuracy most. Addition of the coefficients obtained from the Gabor filter to the grey values increased the classification accuracies by 9% and 8% for summer and winter images, respectively (Akar and Gungor, 2015). The thematic image produced by Akar and Gungor (2015) was used in this study to specify the tea fields, hence, this study can be considered a follow-up of the study conducted by Akar and Gungor (2015). The thematic image is given in Figure 2.
Figure 2. Produced thematic image.
2.2. Generation of the GIS Base Data
In this study, the thematic image obtained by the classification of the summer image was used to determine the hazelnut plantation areas. The TIN (Triangulated Irregular Network) of the study area was also generated by using the contours, which were obtained by digitizing the 1/25000 map provided by the General Command of Mapping. Slope and aspect maps were produced by using the TIN data. It is possible to generate the slope map in either degree or in percentage. The raster slope map was classified with respect to specific slope intervals. All classes in the thematic image were then overlaid with the cadastral parcels to generate the database, which was used for spatial analysis.
2.3. Criteria for Efficiency in Hazelnut Production
It is necessary to pay attention to certain criteria, to get more output from the hazelnut plantation fields.
A major criterion involves slopes. The slope of the terrain has to be more than 6% for hazelnut production (Turkish Regulation 2844 for Hazelnut Production Planning and Determination of Planting Areas). On the other side, large slopes introduce the risk for land erosion. To prevent erosion, underground water can be drained in plane fields. Many parts in the Turkish Black Sea region is found suitable for hazelnut production; for instance the slope in most parts of the Black Sea region is even larger than 20%. Terracing of the land helps harvesting and planting done regularly, storing rainwater, pruning, fertilizing and removing remains of fertilizers.
The following terracing system is applied according to the slope of the terrain:
Channel terraces when the slope is between 5 and 25%.
Ditch terraces when the slope is between 25 and 75%.
Pocket terraces when the slope is greater than 75%.
The International Archives of the Photogrammetry, Remote Sensing and Spatial Information Sciences, Volume XLI-B2, 2016 XXIII ISPRS Congress, 12–19 July 2016, Prague, Czech Republic
This contribution has been peer-reviewed.
Another major factor in hazelnut production is the wind. Hazelnut pollen is carried by the wind. Therefore, free air stream is necessary for pollen transportation. Wind protects the hazelnut trees and also provides the necessary air drainage. However, strong winds may damage young trees. During the plantation period, winds may affect adversely, and this needs to be prevented. At that time, the hazelnut can be damaged by both hot and cold winds ( Leuty, et all, 2012).
Soil, being the main economic resource of the agricultural activity, is the most important capital of the farmers (Doganay, 2007). In the district of Surmene and rest of the mountainous parts of the Eastern Black Sea region, lateritic soil can be found due to frequent rainfall and the subsequent overwashing. Acidic lands, suitable especially for growing hazelnut, corn and tea (Atalay, 2006), have contributed to the agricultural scene within Surmene and neighboring districts.
Aspect affects the amount of sunlight absorbed annually, and therefore the length of the branches and the amount of new buds, and therefore the efficiency in hazelnut production . Approximately one fifth of the annual rainfall happens in spring and summer seasons (spring: 21%, summer : 20%, autumn: 35%, winter: 24%), when the agricultural stocks grow. There is no need for irrigation.
3. RESULTS AND DISCUSSION
Slope is a major factor in hazelnut production efficiency. Table 1 shows the total areas of the regions according to the slopes.
Slope Area (m 2 )
According to Table 1, a total of 48,370 m2 of plantation violates the slope restriction in the regulation (slope < 6).
The wind data on the study area is analyzed. Wind speed can reach 20 m/s that is in very high range, and causes large and long waves on the sea. Furthermore, such strong winds damage the three branches. Even at places where the average wind speed is around 3 m/s, the wind speed can occasionally reach values as high as 20 m/s. Therefore, the average wind surface 3 m / s and above areas are defined as areas not suitable for hazelnut production. These areas comprise a total of 20,055 m2 and 2.53 % of the total study area. Only 1.04% of the present hazelnut plantation fields within the study area fail the wind criterion. Nearly all of them are in the suitable parts.
As seen in Table 2, most fields face east (259350 m2, 28%)
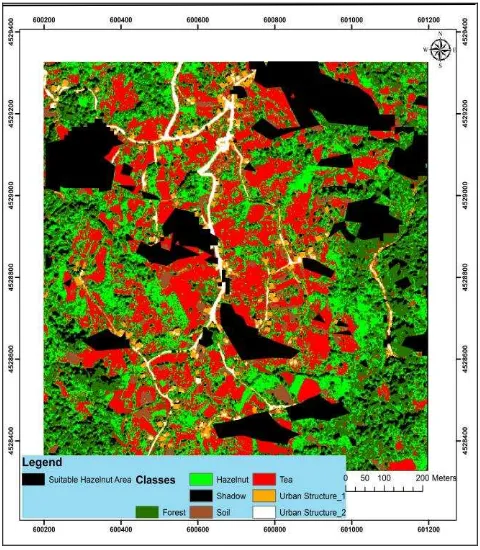
Table 2. The total areas in certain aspect ranges. According to the aspect criterion, the fields need to face south/southeast/southwest direction. Only 151,874 m2 (16%) face those directions. plantation areas. 27,411 m2 out of 226,900 m2 (12%) of the plantation areas satisfy the criteria shown in Figure 3.
Taking into account all the criteria, only 15% of study area is eligible. The percentage is even smaller for the present.
Figure 3. Suitable Hazelnut areas
According to these results, currently the hazelnut production is not efficient. Hazelnut fields should be planted on suitable areas. Present fields in unsuitable areas for hazelnut production should be removed and in those areas, more suitable agricultural products such as kiwi need to be planted.
The International Archives of the Photogrammetry, Remote Sensing and Spatial Information Sciences, Volume XLI-B2, 2016 XXIII ISPRS Congress, 12–19 July 2016, Prague, Czech Republic
This contribution has been peer-reviewed.
4. CONCLUSION
In the study, DEM, slope, aspect and wind speed maps were generated for the study area, and these products were overlaid with the thematic classes and cadastral data to generate a database, which enables the authorities to ensure sustainability of hazelnut production areas. With this database, it is possible to determine the extent of the hazelnut produced by farmers, and to determine the amount of technical stuff, fertilizer and agricultural pesticide needed for hazelnut production. Determining the extent of the hazelnut fields makes it possible to specify surplus and insufficient products year by year. This will help the authorities to decide whether these products will be exported or imported. A dynamic and up-to-date database, generated for hazelnut product, makes it possible to take immediate actions to govern the economy. The results of the analysis indicated that the produced database enables the users to check the accuracy of the cadastral data, to reveal the false declarations of farmers, and to control the product changes. The procedure followed in this study can also be used to generate database for other agricultural products.
REFERENCES
Akar Ö., Güngör O., 2015, "Integrating multiple texture
methods and NDVI to the Random Forest classification algorithm to detect tea and hazelnut plantation areas in northeast Turkey", INTERNATIONAL JOURNAL OF REMOTE SENSING, vol.36, pp.442-464
Aktaş AR., Öztürk E, Hatırlı SA (2009). Dünya Fındık Piyasasında Türkiye’nin Rolü, Süleyman Demirel Üniversitesi Vizyoner Dergisi, Cilt 1, Sayı 1, Isparta
Atalay, İ., 2006, Toprak Oluşumu, Sınıflandırılması Ve Coğrafyası, Meta Basım, 3. Baskı, İzmir, syf: 455
Doğanay,H.,2007, Ekonomik Coğrafya 3: Ziraat Coğrafyası. Aktif Yayınevi, İstanbul.
FAO, http://faostat.fao.org/site/291/default.aspx
Leuty, T., D. Galic, P. Bailey, A. Dale, E. Currie, and M. Filotas. 2012. Hazelnuts in otatio - growing, harvesting and food safety. Ministry of Agriculture, Food and Rural Affairs.
Taşdemir,K., Reis, S., (2011), “Land cover identification for finding hazelnut fields using Worldview2 imagery”, IEEE IGARSS 2011, 22-29 Temmuz, Vancouver, Kanada.
Yazıcı,2009 http://www.tarim.gov.tr/BUGEM/Belgeler/ Duyurular/BASIMf%C4%B1nd%C4%B1k%20c%CC%A7al% C4%B1s%CC%A7tay%C4%B11%20(2).pdf Fındık çalıştay raporu, TRABZON
Yavuz, F., Birinci, A., Peker, K., and Atsan T., 2005.
Econometric Modelling of Turkey’s Hazelnut Sector: Implication on Recent Policies. TUBİTAK J. of Agr. and
Forest., 27:313-321.
URL-1 http://www.surmene.bel.tr/EkonomikYapi.asp The International Archives of the Photogrammetry, Remote Sensing and Spatial Information Sciences, Volume XLI-B2, 2016
XXIII ISPRS Congress, 12–19 July 2016, Prague, Czech Republic
This contribution has been peer-reviewed.
![KAJIAN EFEK MAGNETOIMPEDANSI FREKUENSI RENDAH PADA MULTI LAPISAN [Ni80Fe20/Cu]N KAWAT Cu HASIL ELEKTRODEPOSISI.](data:image/gif;base64,R0lGODlhAQABAIAAAP///wAAACH5BAEAAAAALAAAAAABAAEAAAICRAEAOw==)