3D GEOMARKETING SEGMENTATION: A HIGHER SPATIAL DIMENSION PLANNING
PERSPECTIVE
A. Suhaibaha*, U. Uznira, A. A. Rahmana, F. Antonb and D. Miocb
aGeospatial Information Infrastructure (GeoI2) Research Lab.,
Faculty of Geoinformation and Real Estate, Universiti Teknologi Malaysia, 81310 Skudai, Johor, Malaysia
[email protected], [email protected], [email protected]
bDept. of Geodesy, National Space Institute, Technical University of Denmark,
Elektrovej 328, 2800 Kgs. Lyngby, Denmark [email protected], [email protected]
KEY WORDS: Geomarketing, Market Segmentation, Geo-Clustering, 3D Spatial Database, 3D GIS, Information Retrieval
ABSTRACT:
Geomarketing is a discipline which uses geographic information in the process of planning and implementation of marketing activities. It can be used in any aspect of the marketing such as price, promotion or geo targeting. The analysis of geomarketing data use a huge data pool such as location residential areas, topography, it also analyzes demographic information such as age, genre, annual income and lifestyle. This information can help users to develop successful promotional campaigns in order to achieve marketing goals. One of the common activities in geomarketing is market segmentation. The segmentation clusters the data into several groups based on its geographic criteria. To refine the search operation during analysis, we proposed an approach to cluster the data using a clustering algorithm. However, with the huge data pool, overlap among clusters may happen and leads to inefficient analysis. Moreover, geomarketing is usually active in urban areas and requires clusters to be organized in a three-dimensional (3D) way (i.e. multi-level shop lots, residential apartments). This is a constraint with the current Geographic Information System (GIS) framework. To avoid this issue, we proposed a combination of market segmentation based on geographic criteria and clustering algorithm for 3D geomarketing data management. The proposed approach is capable in minimizing the overlap region during market segmentation. In this paper, geomarketing in urban area is used as a case study. Based on the case study, several locations of customers and stores in 3D are used in the test. The experiments demonstrated in this paper substantiated that the proposed approach is capable of minimizing overlapping segmentation and reducing repetitive data entries. The structure is also tested for retrieving the spatial records from the database. For marketing purposes, certain radius of point is used to analyzing marketing targets. Based on the presented tests in this paper, we strongly believe that the structure is capable in handling and managing huge pool of geomarketing data. For future outlook, this paper also discusses the possibilities of expanding the structure.
1 INTRODUCTION
Geomarketing is the integration of geographical intelligence into various aspects of marketing, including sales and distribution. Geomarketing research is the use of geographic parameters in marketing research methodology, including from sampling, data collection, analysis, and presentation. Location is a key factor for this discipline. Geographical locations together with demographic data are used in geomarketing analysis to study the routing plan, territorial planning and site selection. Geomarketing has a direct impact on the development of modern trade and the reorganization of retail types. Site selection becomes automated and based on scientific procedures that save both time and money. Geomarketing uses key facts, a good base map, proper data layers, reliable consumer profiling, and proper success or fail criteria.
Geographical Information System (GIS) is a common tool used to manage business and marketing information especially information that related to locations. With GIS, users can determine where the customer are, calculate summary information for specific areas or solves problem regarding location of new
retail outlet. The uses of GIS in marketing and business can be seen in various studies. For example, (Supak et al., 2014) using GIS as a decision support tool for tourism planning and marketing. From the system users can easily visualize and analyze spatial distribution of visitors along with demographic information. This functionality can be beneficial in developing or augmenting business plans or marketing strategies. Another example is a study by (Musyoka et al., 2007). From their study, GIS is used as a decision tool to analyze spatial distribution of soft drink industry in Kenya. The study developed a multiple regression model for predicting sale by taking into account sales figures from specific distribution outlets, demographic and socio-economic characteristics.
(1) demographic and psychographic segmentation. According to
(Kotler and Keller, 2006), the geo-cluster approach combines demographic data with geographic data to create a more accurate or specific profile.
In geographic segmentation, data are clustered or categorized according to geographic criteria such as nations, states, regions, countries, cities, neighborhoods, or postal codes. However, during the process of segmentation, a serious overlapping issue may occur and leads to an inefficient geospatial analysis. Moreover, geomarketing is usually active in urban areas and requires clusters to be organized in a three-dimensional (3D) way (i.e. multi-level shop lots, residential apartments). This is a constraint with the current GIS framework. Therefore, this research introduces a new approach in handling geomarketing data. The approach efficiently minimizes the overlapping among clusters during market segmentation and increases the accuracy of spatial object groupings in 3D.
This paper is organized as follows: problems and motivation regarding the 3D geo-clustering in market segmentation are discussed in the next section. In Section 3, the concept of the proposed method is explained with its implementation. Section 4 presents the analysis and results of the experiment. Finally, the conclusions are presented in Section 5.
2 RESEARCH PROBLEM AND MOTIVATION
Clusters in market segmentation can be seen in various viewpoints. It can be used to divide a broad target market into subsets of consumers, businesses, or countries that have common needs, interests, and priorities. The segment will be analyzed to plan the strategies to target market. Market segmentation strategies are generally used to identify and further define the target customers, and provide supporting data for marketing plan elements such as positioning to achieve certain marketing plan objectives. Businesses may develop product differentiation strategies, or an undifferentiated approach, involving specific products or product lines depending on the specific demand and attributes of the target segment.
As discussed in the previous section, a serious overlapping between clusters for market segmentation can produce inaccurate result. According to the first law of geography, everything is related to everything else, but near things are more related than distant things. Thus, inaccurate result will not optimize the analysis of market segmentation. Considering the locations of retail stores and customers in the urban mixed-use development areas with high rise multi-level buildings, a 3D method is prominently required in order to define the segmentation before further spatial analysis can be performed. The overlapping issue can be seen as a serious problem in data retrieval and analysis. It will affect the query efficiency in terms of response time, database storage and information accuracy. Furthermore, with the huge data pool of geomarketing data, the analysis and the efficiency of data retrieval will become more complex and crucial.
To segment the marketing area, common statistical techniques for segmentation analysis are utilized. For example, the most commonly clustering algorithm used for market segmentation is k-means clustering. By using this algorithm, data will be partitioned
into k clusters (C1, C2, …, Ck). The means for all instances in each
cluster are then calculated as a cluster centres.
The algorithm starts by randomly finding initial cluster centres. For each one of the iterations, an object or instance is assigned to the nearest cluster centre based on Euclidean distance. Then, cluster centres are recalculated until the coordinates are constant.
The centre of each cluster is calculated as the mean of all objects or instances belonging to that cluster:
��=
1
�� � �� ��
�=1
where Nk is the number of instances belonging to cluster k and µk
is the mean of the cluster k.
According to (Selim and Ismail, 1984), a sample size of m instances or objects does affect the complexity of T iterations of the k-means algorithm. Thus, the complexity of each characterized search by N attribute is:
O (T . k . m . N)
The linear complexity is one of the reasons of k-means popularity. Even if the size of instances is large, this algorithm is computationally attractive. Besides that, k-means offer simplicity, speed and adaptability to sparse data (Dhillon and Modha, 2001). k-means algorithm is sensitive to the presence of noise and outliers (Hasan et al., 2009; Kaufman and Rousseeuw, 2008). A single outlier can increase the squared error dramatically. However, this disadvantage is exceptional in our case, since data used in this research is static and stagnant such as buildings and customer locations. The only concerning issue using this method is the initial seed of the cluster centre in k-means algorithm. Besides that, one of the functions in k-means is categorized as NP (Non-deterministic Polynomial-time) hard problem. This function is inclined to focus cluster centers at one point or area. Thus, any selection is very sensitive to the group cluster and may make a difference for the end result.
3 IMPROVING 3D GEO-CLUSTERING
Since k-means algorithm could not produce minimal overlap among its clusters, we proposed an improve version of k-means called k-means++. Based on our previous studies, k-means++ has proved its ability in producing well balance and evenly spread cluster centers. k-means++ has been invented by (Arthur and Vassilvitskii, 2007) few years ago. This algorithm groups the weighted data points by squared distance. Then, the closest cluster centers are initially defined. The initial seed of cluster centers were defined and combined with the k-means algorithm, the resulting algorithm is known as means++. The algorithm of k-means++ is described in the Figure 1.
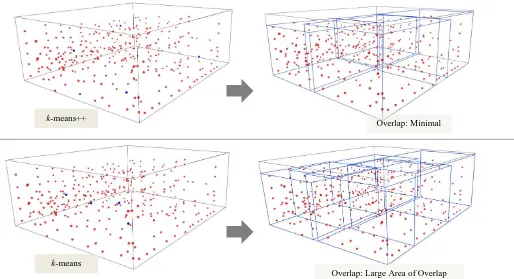
cluster centers and how it may affect the end results. Figure 2 shows a set of data in 3D have been clustered using k-means and k-means++. The blue dots are the initial cluster center for both algorithms. Initial cluster center by k-means seems to be concentrated at one area meanwhile initial cluster center by k-means++ is evenly spread for the whole area of the dataset. Then, each object is assign to the nearest cluster center.
Figure 1. k-means++ workflow.
Boundary parallelepiped is formed using the minimum and maximum value of objects location in the group cluster. By forming this parallelepiped, the overlap region can be analyzed. Since the cluster centers of k-means++ are evenly spread, the produced region is balanced and overlap among parallelepipeds is minimal. Meanwhile, unevenly spread cluster centers by k-means produced unbalanced number of data in the group cluster and produced large area of overlap among parallelepiped. This situation creates repetitive data entries where some of the objects falls in two or more parallelepiped regions. Thus, information about the objects will be recorded more than once.
Before the clustering step is implemented, target market needs to be grouped based on geographic criteria. Then data in each segment are clustered using proposed clustering algorithm. Each cluster group is also bounded with the maximum and minimum coordinate value and form a parallelepiped. The combination of geographic criteria and the proposed clustering approach will constellate the geomarketing data efficiently in the database. Each group from the clustering results will be uniquely identified in the database with its unique identification. With this identification, users will be benefitted to save the time of data retrieval. The overall workflow of proposed approach is described in the Figure 3.
�(�)2 ∑�∈��(�)2 Input: P(object set), k(number of cluster) Output: clusters
Step 1: Initialize k cluster centers. Step 2: Choose one center C1 Step 3: Repeat for 2 ≤ i ≤ k
Step 4: Choose Ci to be x ∈ X with D 2
weighting
Step 5: while termination condition is not satisfied do Step 6: Assign objects to the nearest cluster center. Step 7: Update cluster centers.
Step 8: end while
k-means++
k-means
Overlap: Minimal
Overlap: Large Area of Overlap
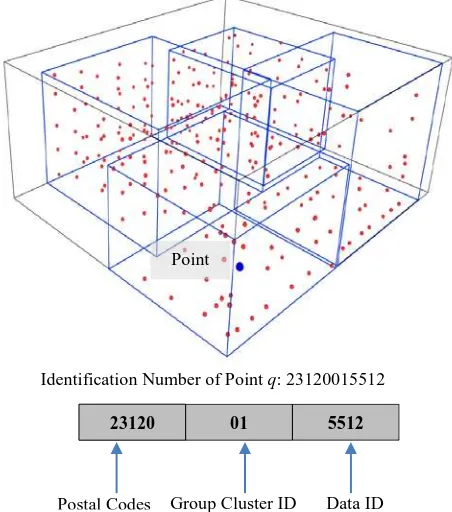
From Figure 3, the first phase of market segmentation process would be classification of data based on geographic criteria. Data are segmented based on postal codes. This process produces four groups of market segments; 1st Segment (23120), 2nd Segment (23010), 3rd Segment (22110) and 4th Segment (22001). Then, each data in market segment are clustered into several clusters. Each group clusters will form a parallelepiped based on minimum and maximum coordinate value. Data in the group cluster is identified based on the combination of postal codes, the id number of clustering group and the id number of data and paired with the parallelepiped id. Figure 4 explains the combination of this identification.
Figure 4. Unique identification of market segments based on geographic criteria.
4 EXPERIMENT AND ANALYSIS
4.1 Geomarketing Data Retrieval
In this study, the proposed approach is aimed to cater geomarketing dataset. The first test is to retrieve those dataset from the database using Structured Query Language (SQL). Following statement of SQL retrieve records from the database by using the unique identification. The return result is presented in the Figure 5.
Select *
From Market_Segment Where ID = 22110045416; Market Target: Customer
L i
Market Segmentation: Postal C d
1st Segment: 23120 2nd Segment: 23010
3rd Segment: 22110 4th Segment: 22001
Group Cluster
2nd Segment: 23010
#First Phase
#Second
#Third Phase
Figure 3. The workflow of market segmentation.
Point
Identification Number of Point q: 23120015512
23120 01 5512
Figure 5. Retrieved record from database.
In the second test, SQL statement will be performed to retrieve records with several conditions. For example, calculate number of customer that cancelling the company’s service in the area where the postal codes is 25220. Based on that situation, the SQL statement would be:
Select *
From Market_Segment2 Where Postal_Codes = 25220 and Purchase_Status = ‘Cancel’;
The return result of the query statement is presented in the Figure 6. From the figure, the total number of records shows that 12 customer has cancelled their purchase from the company due to various reasons. Many times customers move purchase preferences to a competitor brand. This may happen for many reasons those of which can be more difficult to measure. It is many times beneficial for the former company to gain meaningful insights, through data analysis, as to why this change of preference has occurred. Such insights can lead to effective strategies for winning back the customer or on how not to lose the target customer in the first place.
Figure 6. List of customer that cancel their purchase.
4.2 Overlap Region
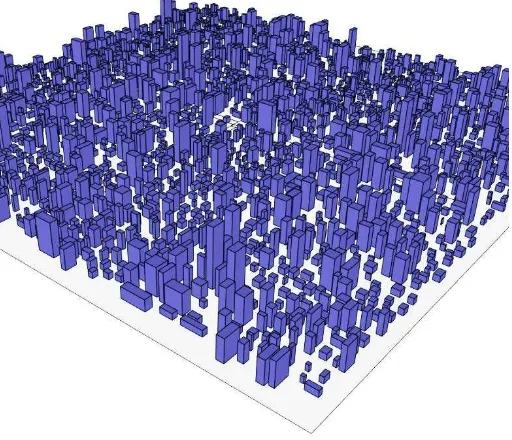
In sales territory management, segmenting the marketing data could increase time efficiency and sales volume. However, overlapping area among segmented clusters may lead to inefficient data management. Since, proposed clustering algorithm, k-means++ could reduce the overlap area, a comparison test is implemented. 10,000 KM2 of urban area with 6,000 customer locations in 3D buildings are used in this test. Figure 7 shows some of the datasets of 3D building used in this
test. From the test, customers are segmented based on postal codes. 8 groups of market segmentation are produced. Segmented areas are then clustered into several groups using means and k-means++ algorithm. Overlap area of both result are calculated and presented in the Table 1. Number of customer locations that are belong to the overlap region is also calculated. This number contributed to the repetitive entries in the database because it’s belong to more than one cluster centres and produced multiple records in the database. From the Table 1, the total area of overlap region produced by k-means++ is 752 KM2 meanwhile 2,750 KM2 area is produced by means which is 3 or 4 times than k-means++. Total Number of customer that are belong to the overlap region are 178 for k-means++ and 589 for k-means. Derived information from Table 1 shows that overlap area produced by proposed k-means++ is minimal and number of customer in overlap region is also lower
Figure 7. 3D buildings of 10,000 KM2 urban area.
Table 1. Comparison of overlap region.
Cluster Approach
Total Overlap Region (KM2)
Number of Customer in Overlap Region
k-means++ 752 178
k-means 2750 589
4.3 Analysing the Market Target
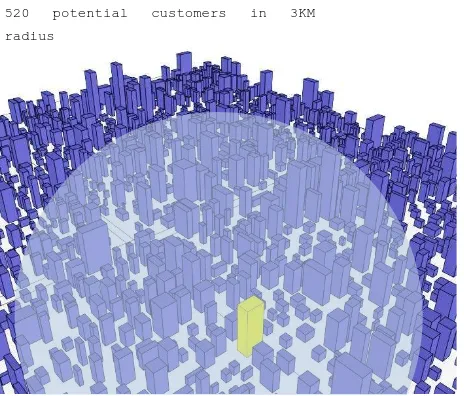
geographic region or area. The return result is presented in the Figure 8. From the database, there are about 520 potential customers will be a target market for the new opening store.
Figure 8. Potential customer within 3KM radius from new opening store (yellow block).
The next test is to find the nearest competitor to the new opening store. Competitor analysis in geomarketing is an assessment of the strengths and weaknesses of current and potential competitors. Common technique is to create detailed profiles on each of your major competitors. These profiles give an in-depth description of the competitor's background, finances, products, markets, facilities, personnel, and strategies. This involves location, products, marketing and personnel. In this test, query operation is performed to find list of competitor within 3KM radius and the return results are visualized in the Figure 9.
Figure 9. List of competitors from new opening store.
5 CONCLUSION
This paper proposed an efficient approach of market segmentation based on geographic criteria and clustering algorithm. Using proposed approach, geomarketing data are constellated in geospatial databases for efficient data management. The proposed approach is aimed to reduce overlap region during market segmentation.
The findings and applications, resulting from the comprehensive tests and analyses of the proposed approach are discussed below. First, the geomarketing data i.e. market target is retrieved and identified from the database by comparing the customer location or target market with parallelepiped coordinate and by using its unique identification. On the basis of this identification, data and information were directly retrieved from specific segments. Compared to non-constellated data, each record in the database table needed to be scanned or visited for the filtering process. In the overlap region test, the capability of the proposed approach is remarkable by producing a small area of overlap region. The results shows that the overlap region is minimal compared with the region produced by original k-means algorithm. In the final test, the market target is analysed by retrieving a set of customer and analysing the location of competitor from the new stores location.
On the basis of these findings, we believe that the proposed approach is suitable for market segmentation in geomarketing application. However, further testing is suggested to facilitate additional improvements. To extend the analysis of this structure, we suggest to combine the data with sales and purchasing data for marketing and strategic planning. This may help the marketers to develop successful promotional campaigns achieving marketing goals.
ACKNOWLEDGEMENT
This work is supported by the Ministry of Education, Malaysia under the MyPhD, MyBrain15 initiatives.
REFERENCES
Arthur, D., Vassilvitskii, S., 2007. k-Means++: The Advantages of Careful Seeding, Proceedings of The Eighteenth Annual ACM-SIAM Symposium on Discrete Algorithms. Society for Industrial and Applied Mathematics, Pp. 1027-1035.
Dhillon, I.S., Modha, D.S., 2001. Concept Decompositions for Large Sparse Text Data using Clustering. Mach. Learn. 42, 143-175.
Hasan, M.A., Chaoji, V., Salem, S., Zaki, M.J., 2009. Robust Partitional Clustering by Outlier and Density Insensitive Seeding. Pattern Recognition Letters 30, 994-1002.
Kaufman, L., Rousseeuw, P.J., 2008. Divisive Analysis (Program Diana), Finding Groups in Data. John Wiley & Sons, Inc., Pp. 253-279.
Kotler, P., Keller, K.L., 2006. Marketing Management. Pearson Prentice Hall.
520 potential customers in 3KM
Musyoka, S.M., Mutyauvyu, S.M., Kiema, J.B.K., Karanja, F.N., Siriba, D.N., 2007. Market Segmentation using Geographic Information Systems (GIS): A Case Study of the Soft Drink Industry in Kenya. Marketing Intelligence and Planning 25, 632-642.
Selim, S.Z., Ismail, M.A., 1984. k-Means-Type Algorithms: A Generalized Convergence Theorem and Characterization of Local Optimality. Pattern Analysis and Machine Intelligence, IEEE Transactions on Pami-6, 81-87.