EXTRACTING TEMPORAL AND SPATIAL DISTRIBUTIONS INFORMATION
ABOUT ALGAL GLOOMS BASED ON MULTITEMPORAL MODIS
Lü Chunguang a,, Tian Qingjiu a a
International Institute for Earth System Science, Nanjing University, Nanjing 210093, hohai_rsandgis@163.com
Keywords: Taihu Lake; algal blooms; spatio-temporal distribution;
Commission VII, WG VII/3
ABSTRACT:
Based on MODIS remote sensing data, method and technology to extraction the time and space distribution information of algae bloom is studied and established. The dynamic feature of time and space in Taihu Lake from 2009 to 2011 can be obtained by extracted method. Variation of cyanobacterial bloom in the Taihu Lake is analyzed and discussed. The algae bloom frequency index (AFI) and algae bloom sustainability index (ASI) is important criterion which can show the interannual and inter-monthly variation in the whole area or the subregion of Taihu Lake. Utilizing the AFI and ASI from 2009 to 2011, it found some phenomena that: the booming frequency decreased from the north and west to the East and South of Taihu Lake. The annual month algae bloom variation of AFI reflect the booming existing twin peaks in the high shock level and lag trend in general. In the subregion statistics, the IBD and ASI in 2011 show the abnormal condition in the border between the Gongshan Bay and Central Lake. The date is obvious earlier than that on the same subregion in previous years and that on others subregion in the same year.
Lü Chunguang: PhD candidate in Nanjing University, China. The main research direction is water environment remote sensing.
1. INTRODUCTION
Lake is one of the most important fresh water resources on the planet. In recent years, eutrophication of many of lake in the world is serious, because of human social economic activities (Guo H, 2000; Liao M, Lin H, 2003). The significant signs are frequent outbreaks and large scale to flourish of algae bloom. Algae bloom refer to the phenomenon of accumulation of algae due to the biomass of phytoplankton significantly higher than average in water (Oliver R L et al, 2000). Under the action of the external forces (such as wind and flow, etc), algae bloom formed on the spectrum characteristics similar to terrestrial vegetation (Dekker A G, 2001). Remote sensing had timeliness, macroscopically and quality economy in environmental monitoring. Consequently, remote sensing technology is used with great advantage in monitoring the time and space distribution of algae bloom (Huang J et al, 1999).
At present, there have been several researches on algae bloom distribution of time and space and changing regularity. The reproductive biology of Calanus Finmarchjcus was investigated at a permanent station in the Norwegian Sea during a time series between March and June 1997 (Head, R et al, 1999). It implies that the reproduction of C. Finmarchicus in the Norwegian Sea is to some extent decoupled from the phytoplankton bloom (Head R et al, 1999). On the basis of the spectral analysis, an applicable model was developed to extract the cyanobacteria bloom information from multi-source remote sensing images (Ma R et al, 2008). And then, the model was used to acquire cyanobacteria bloom-covered area and its spatial distribution (Ma R et al, 2008). Using available satellite images, Duan reconstructed the spatial and temporal patterns of
algal blooms in Lake Taihu through the past two decades (Duan, H et al, 2009). Using MODIS satellite images and Chlorophyll-a concentration data and adopting cyannobacteria
bloom evaluation method, Liu studied different type of
cyanobacteria bloom from 2004 to 2008 in Taihu Lake, and explored the characteristics of cyanobacteria bloom and its spatial and temporal variation, which provided pre-prevention and early waning for cyanobacteria bloom (Liu J et al, 2011). Based on the emergency remote monitoring in 2008, the frequent region, changes in migration, and the relevancy to the water quality objectives such as temperature were discussed to support the emergency management of cyanobacteria bloom in Taihu Lake (Jin Y et al, 2009).
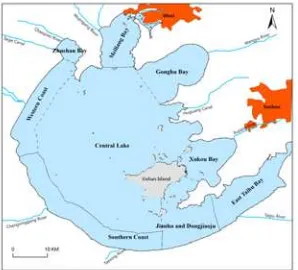
Lake Taihu, the second freshwater largest lake in China is located in Jiangsu and Zhejiang provinces at the junction, also is in the south of the Yangtze River delta (Figure 1). The length of the lake (from north to south) is 68.5 km and the width (from east to west) is 56 km. The mean depth of the lake is 1.9 m, and the maximum depth is 2.6 m. It is a typical shallow lake water or depressions (Qin B Q et al, 2007).The rich water resources in Taihu Lake Basin is the foundation of the development of regional social economic conditions, but with population growth, urban expansion and the acceleration of industrial growth, the related problems of water environment of lakes are more and more serious (Guo L, 2007). The recent bloom in summer 2007 affected the Wuxi City nearby significantly, causing drinking water sources to be severely polluted and millions of people to be exposed to health hazards, which in turn imperilled the social stability of the region (Yang M et al, 2007)
extraction the time and space distribution information of algae bloom. 2) Based on extracted information and index, obtaining the dynamic feature of time and space in Taihu Lake from 2009 to 2011. 3) Analyzes and discusses variation of cyanobacterial bloom in the Taihu Lake during this time.
a. The water body of Lake Taihu is divided into nine water regions: Xukou Bay, Meiliang Bay, Zhushan Bay, Gonghu Bay, Central Lake, Western Coast, Southern Coast, Jianhu and Dongjiaoju, East Taihu Bay (Jin Y et al, 2009; Liu J et al, 2011; Zhang Y., et al , 2011; Duan, H, et al, 2009).
b. The satellite imagery: the blooming found by MODIS imagery in Lake Taihu on August 17th, 2009.
Figure 1 Location, morphology and division of Taihu Lake
2. DATA AND METHOD
2.1 Data Acquisition and Pre-processing
MODIS sensors are carried by TERRA and AQUA satellite in EOS plan of the United States. It cover the visible to the near infrared (0.4- 1.4 um) spectrum With 36 spectrum channel and its scanning width is 2330 km, whose spatial resolution is 250m, 500m and 1000 m and the temporal resolution is twice a day. MODIS image data is often used in an eutrophication monitoring of lakes (Kong W et al, 2009). Excluding the weather reason such as clouds and rain, there are 374 MODIS images over Lake Taihu that used to extract the spatiotemporal information of algal blooms (Table 1). The data in the period of 2009-2011 were downloaded from the NASA EOS Data Gateway (EDG).
Year
Items
2009 2010 2011
Effective monitoring day 128 150 96
Algal bloom days by
Monitoring
97 74 38
Cloudless days 103 150 65
Note: Effective monitoring day means the days of completing activitie s of monitoring indicator normally. Cloudless days are the days witho
ut cloud cover within the whole Taihu Lake region in a year. Table 1 The total days of the status of monitoring algae bloom using MODIS image in 2009, 2010 and 2011, Taihu Lake
In order to obtain the algae bloom space distribution data of Taihu Lake in effective monitoring days using MODIS data, the cutting operation, geometric correction, and radiation calibration should be executed firstly. Geometric correction can be doing using longitude and latitude data in HDF original file and building a geographic lookup table to transform the image. Radiation calibration can be executing using gain and offset coefficient value of each band in HDF file realizing the transform from DN to radiance value. In order to get the truth value of water surface radiation and reflectance, it is necessary to do atmosphere correction, in the process of correcting, the FLAASH model (Kaufman, Y et al, 1997) in ENVI being adopted. In that the eastern of Taihu Lake (including Jianhu and Dongjiaoju, East Taihu Bay and Xukou Bay), in which there are many growth of large phytoplankton belong to the type of palustrine and shallow Lake. In the process of recognition using remote sensing image, it is often to take aquatic vegetation for
cyanobacteria bloom, so before there is no better identification mode, the eastern of Taihu lake region will be as aquatic vegetation area automatically in this paper (Jin Y et al, 2009; Ma R et al, 2010). NDVI (Jensen, J. R., 1986) is useful to extraction space distribution information in Effective monitoring days (Hu C et al, 2000). Usually, handling of NDVI can partly eliminate the influence of the height of the sun Angle, satellite viewing angles, and the terrain to extract algae bloom information (Hu C, 2009).
2.2 The Time and Space Distribution Index
The algae bloom frequency index (AFI) is defined as the number of the algae bloom days against the number of effective monitoring days marked as T in a certain water area at certain time. Using MODIS data in algae bloom monitoring, the size of a certain water area is the 250m*250m, a size of a pixel, and a certain time usually is 365day in a year. The mathematical expression is as the follow:
AFI = t / T*100% (1)
a. AAFI in 2009 b. AAFI in 2011
c. AAFI in 2010
d. ASI in 2009
e. ASI in 2010
f. ASI in 2011
g. IBD in 2009
h. IBD in 2010
i. IBD in 2011
g. EBD in 2009
k. EBD in 2010
l. EBD in 2011
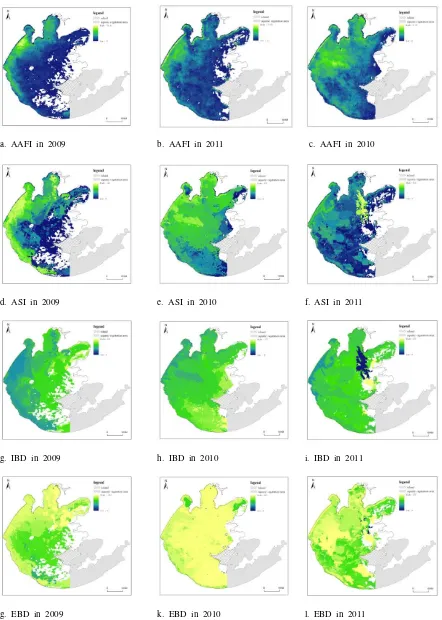
Figure 2 the spatial distribution patterns of the annual algae bloom frequency index, algae bloom sustainability index, annual initial blooming date and end blooming date in 2009, 2010 and 2011
The algae bloom sustainability index (ASI) is defined as the difference between the last days and the first days at a certain time to find algae bloom using NDVI in certain water
last day which is an effective monitoring day to find algae bloom at a certain time is called as end blooming date (EBD) in certain water region. The mathematical expression is as the follow:
ASI = EBD - IBD +ε (2)
ASI can reflect the length of algae bloom in some area at certain time (in a year) (Duan H et al, 2009; Ma R er al, 2010). εis decided by the monitoring time interval. The some area can be corrected to the pixel size.
2.3 The process of extracting the index and information
In order to achieve the extraction of temporal and spatial distributions information about algal glooms, the space distribution data of algal glooms in effective monitoring days are stored as open storage formats, which use storage framework of separating geographic code from data in favour of data sharing and interoperability among various sectors. The data include the original value and time information (date and days in a year). According to the method above, the IDL (Interactive Data Language) program is compiled and executed to extract temporal and spatial distributions information, obtaining the algae bloom frequency index and the algae bloom sustainability index map corrected to image pixel size based on MODIS data and statistical information about the subregion in Taihu Lake.
3. RESULTS AND DISCUSSION
3.1 The Algae Bloom Frequency and Sustainability
Index
The figure 2(a, b and c) shows the annual algae bloom outbreak situation in 2009, 2010 and 2011. It can be seen that the area of highest of AAFI is mainly at the Western Coast region (>40%). The area of AAFI beyond 30% was also located in Meiliang Bay and Southern Coast. In brief, the area of higher frequency of booming focused on the north and west of Taihu Lake. Conversely, it is very low in the Gonghu Bay and extensive Central Lake. The booming frequency decreased from the north and west to the East and South of Taihu Lake, even if, in closer to the aquatic vegetation area there are many blank area that has no booming frequency in 2009. In 2010, the area of AAFI beyond 40% is narrower than that in 2009, but the area of AAFI beyond 30% or 20% is larger than that in 2009. The highest of AAFI has moved from Western Coast region to the border regions between the Western Coast and Central Lake. It's worth noting that, in 2010, in the Central Lake; area of AAFI beyond 20% is a common phenomenon but rarely appears in 2009. These characteristics show that the degree of booming is more serious than that in 2009. There is a general trend that the outburst of booming is frequent in the east part of Taihu Lake. From the picture of AAFI in 2011, it looks like that degree of bloom frequency is significantly reduced compared with 2010. The area of highest of AAFI is mainly at the Western Coast region, which is as similar as the condition in 2009. It is obvious to the trend of contraction from the Central Lake to the north and west.
The figure 2(d, e and f) shows the annual algae bloom duration in 2009, 2010 and 2011. The spatial distribution of
sustainability index was inconsistent with that of bloom frequency index in these three years. There are rarely areas that the duration of booming is beyond 200 days in 2009. Such area is mainly located in Meiliang Bay. The regions having the greater duration are the Western Coast, Meiliang Bay and Southern Coast in which the blooming duration is general more than 150 days. The blooming duration in Central Lake is mostly less than 100 days. In 2010, there are few regions that have the duration more than 200 days, which located in Western Coast and Meiliang Bay. The regions having the greater duration are border regions between the Western Coast and Central Lake in which the blooming duration is general more than 150 days and the distribution area is smaller than that in 2009. The blooming duration in Central Lake which is about 100-150 days is much higher than that in 2009. Note that spatial distribution of the blooming duration is stranger than the situation in 2009 and 2010. It is not like the duration that showed the tendency of increasing from the East and South to the north and west of Taihu Lake, but the messy distribution. The regions having the greater duration are border regions among the Central Lake, Meiliang Bay, and Gongshan Bay in which the blooming duration is general more than 350 days and significantly higher than maximum value of blooming duration in 2009 and 2010. The spatial distribution area of the other time slice of blooming duration is much smaller than that in 2009 and 2010.
3.2 The Initial Blooming Date and End Blooming Date
The figure 2 (from g to l) shows the annual initial blooming date and end blooming date situation in 2009, 2010, and 2011. It can be seen that the area of the lowest value of IBD (111th days) is located in Western Coast region in 2009(figure 2 g). It is a general trend that the date of initial blooming is lower and lower from the north and west to the Central Lake. The latest end blooming date is about 280th days in 2009 and the area is located in the border between the Gongshan Bay and Central Lake, in which the bloom duration is very short(figure 2 h). In 2010, the area of the lowest value of IBD (120th days) is also located in Western Coast region in 2010(figure 2 i) and just closer to the Central Lake. The initial time of the southern coast had been put off. The latest initial blooming date is about 230th days in 2010 and the area is located in southeast part of the Central Lake. The latest end blooming date went to the 350th days and that spatial distribution is wide. The area with earlier end blooming date is the small part of Zhushan Bay and Gongshan Bay. In 2011, the area of the lowest value of IBD (8th days) is also located in the border between the Gongshan Bay and Central Lake and the date is obvious earlier than that in others subregions in Taihu Lake. The annual initial blooming date (about 120th days) in Western Coast is as similar as the date in 2010 and 2009. The latest end blooming date went to the 350th days and that spatial area is Gongshan Bay and Central Lake. Combined with the sustainability index (Figure 2 l), it shows that the blooming appeared in January, 2011 and December, 2011.
3.3 Intermonth Variation
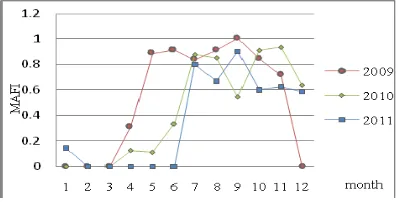
remote sensing is easily influenced by cloud and rain, the effective monitoring days and algal bloom days by Monitoring was very different in each month in 2009, 2010 and 2011. In order to get comparable index to reflect the intermonth variation, the month algae bloom frequency index (MAFI) was used as a reference standard.
The figure 3(a) shows that the variation monthly of algae bloom frequency about 2009, 2010 and 2011. The three lines all formed the four stages: operation of low level, rising phase, high shock, and fall period. In the period of high shock, there are two peaks and a rock bottom, and the difference of peak and the bottom is proportional to the month of the bottom. There are also some obvious differences in the annual variation. It is not same about the time node of low level and rising phase stages. The peak and bottom of the high shock appear in different month. At the fall period, the line in 2009 fall fast so as to form the normal distribution, but the lines in 2009 and 2010 are still at a higher level in spite of falling. The January no zero value of the line in 2011 could be seen the extension of the fall period in 2010(the figure2 k shows the spatial space).
a. variation monthly about 2009, 2010 and 2011
b. the intermonth variation during 1998 to 1999 Figure 3 the month algae bloom frequency index from 2009 to 2011 in Taihu Lake
Figure 5 reflects the annual variation of MAFI from 2009 to 2010 years. Obviously, the Curve of 2009 has formed a blooming cycle just only in the twelve month of 2009 year (Some research material suggests that blooming cycle in 2008 and 2007 is similar to the situation in 2009) (Ma R et al, 2008; Duan H et al, 2009; Ma R et al, 2010). The blooming cycle in 2010 had extended to the January, 2011. Similarly, the value of December, 2011of Curve not fall to zero, which could show that the blooming cycle had extended to the January, 2012(In fact, the existing monitoring results in January, 2012 show that the booming had happened).
3.4 The Time variation of algae booming in the
Subregion
Through the statistics of EBD and IBD using zoning methods, it is easy to obtain the date of the first EBD and the last IBD and the average of EBD and IBD in the subregion (figure 4). The figure shows that the latest end blooming date in any subregion is more than 350th days, which can reflect the general phenomenon that the blooming circle is beyond a year. The spasial distrubution subregion of the earlier initial blooming date(8th days) is at the Central Lake, Meiliang Bay and Gongshan Bay in 2011, that proof the existing of lag trend in the blooming circle in recent years.
a. the time variation of algae booming in the
Subregion of Taihu Lake in 2009
b. the time variation of algae booming in the
Subregion of Taihu Lake in 2010
c. the time variation of algae booming in the
Subregion of Taihu Lake in 2011
Figure 4 the monthly algae bloom duration of each subregion from 2009 to 2011 in Taihu Lake
Note: In the diagram, the top and low of each rectangle stand for the
average of EBD and IBD in the subregion. The top and low of each
vertical line indicate the date of the first EBD and the last IBD in this
subregion.
4. CONCLUSION
technology of extracting information in this paper. The algae bloom frequency index (AFI) and algae bloom sustainability index (ASI) is important criterion which can show the interannual and inter-monthly variation in the whole area or the subregion of Taihu Lake. Utilizing the AFI and ASI from 2009 to 2011, it found some phenomena that: 1) the severity of booming generally decreased from the north and west to the East and South of Taihu Lake. 2) There are the annual periodical changing rules of cyanobacterial blooms. The circle this cycle includes four stages, that is operation of low level, rising phase, high shock and fall period. 3) The phenomenon that “beyond a year” in blooming circle appears in 2010 and 2011 which could indicate the change of external environment.
5. ACKNOWLEDGMENTS
We are grateful for the financial support provided by International Institute for Earth System Science, Nanjing University, and NASA for providing the MODIS surface reflectance daily level 2 products, and Nanjing Institute of Geography & Limnology, Chinese Academy of Sciences for providing the blooming monitoring data in Taihu Lake from 2009 to 2011.
REFERENCES
Guo H, 2000. Theory and application of radar observations [M].Beijing: Science Press.
Liao M, Lin H, 2003. INSAR - principle and signal processing [M]. Beijing: the Mapping Publishing Company.
Oliver R L, Gang G, 2000. Freshwater blooms [C]. The Ecology of Cyanobacteria. The Netherlands: Kluwer Academic Publishers: 149-94.
Dekker A G, 2001. Imaging spectrometry of water. In: Meer FD, Jong SM eds. Imaging spectrometry: Basic principles and prospective applications [J]. Kluwer Academic: 307-359.
Huang J, Zhao R,1999. Satellite remote sensing monitoring algae booming in Taihu Lake [J], Remote sensing information (4):43-44.
Head, R. and R. Harris, 1999. A high frequency time series at Weathership M, Norwegian Sea, during the 1997 spring bloom: the reproductive biology of Calanus finmarchicus. Marine Ecology Progress Series. 176: p. 81-92.
Ma R et al, 2008. Spatio-temporal distribution of cyanobacteria blooms based on satellite imageries in Lake Taihu, China. Journal of Lake Sciences (6): p.687-694.
Duan, H et al, 2009. Two-Decade Reconstruction of Algal Blooms in China’s Lake Taihu. Environmental Science & Technology. 43(10): p. 3522-3528.
Liu J et al, 2011. Characteristics of cyanobacteria bloom granding and its temporal and spatial variation in Taihu Lake. Resource and Environment in the Yangtze Basin [J]. (2): p156-160.
Jin Y et al, 2009. Application of EOS/MODIS Data for Research of Cyanobacteria Bloom Spatio-temporal Distribution in Taihu Lake [J]. Environmental Science and Technology (S2): p 9-11.
Qin, B. Q., P. Z. Xu, Q. L. et al, 2007.Environmental issues of Lake Taihu, China. Hydrobiologia 581: 3–14.
Guo, L, 2007. Doing battle with the green monster of Taihu Lake. Science, 317, 1166.
Yang, M, J. W. Yu, Z. L. Li, Z. H. Guo, M. Burch & T. F. Lin, 2008. Lake Taihu not to blame for Wuxi’s woes. Science 319: 158–158.
Liu J et al, 2011. Risk evaluation method of cyanobacteria bloom hazard in Taihu Lake[J]. China Environmental Science, (3): P 498-503.
Zhang, Y., et al, 2011. Temporal and spatial variability of chlorophyll concentration in Lake Taihu using MODIS time-series data. Hydrobiologia. 661(1): p. 235.
Duan, H., et al., 2009. Two-Decade Reconstruction of Algal Blooms in China’s Lake Taihu. Environmental Science & Technology, 43(10): p. 3522-3528.
Kong W et al, 2009. Monitoring Cyanobacterial Blooms Using MODIS Images in Taihu Lake, China [J]. Remote sensing information (4): p80-84.
Ma R er al, 2010. The environmental remote sensing of Lake water[M].Beijing: Science Press.
Hu C, Carder K L, 2000. Muller-Karger F E. Atmospheric Correction of SeaWiFS Imagery over Turbid Coastal Waters:: A Practical Method [J]. Remote Sensing of Environment, 74(2): 195-206.
Hu C, 2009. A novel ocean color index to detect floating algae in the global oceans [J]. Remote Sensing of Environment, 113(10): 2118-29.