APPLICATION OF THE TERRA MODIS SATELLITE DATA FOR ENVIRONMENTAL
MONITORING IN WESTERN SIBERIA
I.G. Yashchenkoa, T.O. Peremitinaab*
a
Institute of Petroleum Chemistry SB RAS, 4, Akademichesky Ave., 634055, Tomsk, Russia - [email protected] bDept. of Data Processing Automation Tomsk State University of Control Systems and Radioelectronics, 74, Vershinina Str.,
634034, Tomsk, [email protected]
Special Sessions, SpS 8
KEY WORDS: Environment, Satellite Images, Geographic Information Systems, Oil Fields.
ABSTRACT:
Using the MODIS thematic products, the status of vegetation of oil producing areas in Western Siberia for the period 2010-2015 is monitored. An approach for estimating the impact of various factors on the ecology of oil producing areas using the NDVI coefficient and remote sensing data on the status of vegetation is proposed. The approach is tested within four technologically-disturbed lands – four oil fields, Krapivinskoye, Myldzhenskoye, Luginetskoye, and Urmanskoye in Tomsk region. The territory of the Oglatsky Status Nature Reserve of regional importance is investigated as a reference area.
Introduction
Due to intensive industrial production of oil, the oil producing industry has a significant direct and indirect impact on the environment. Oil and petroleum products are dangerous environmental pollutants and exert a detrimental effect on all links of the biological chain. Soil contamination at a concentration of 80-100 g/kg creates a critical situation, in which the vegetation is not renewed. Especially vulnerable in this respect are the wetland ecosystems in Western Siberia. Local in situ observations cannot provide a comprehensive, integrated assessment of the ecological status of the oil-producing areas, so the use of satellite remote sensing data (RSD), ensuring a nearly continuous monitoring of the atmosphere, land and water surfaces, is very important. The aim of the work is to consider a possibility of using Terra MODIS satellite data for on-line environmental monitoring of oil-producing areas of Western Siberia.
Experimental site
In recent years, West Siberia, whose industry is being intensively developed, has been characterized by deteriorating environmental conditions (Polishchuk, 2014). A number of cities and urban regions of Western Siberia can be referred to the zones of ecological disaster. Its main reason is a discrepancy between the scale of anthropogenic impact on the environment and measures for its conservation, reclamation, and protection. In practice, this is illustrated by ever increasing territories occupied by oil field on the one hand, and increased volumes of oil and gas production from the reservoirs depleted by 50%, on the other hand, the use of outdated technologies, and the presence of dangerous nuclear and chemical production. Among the factors complicating the situation is a disregard of sustainability of natural landscapes to anthropogenic influences, which is closely related to the specific features of the zone of permafrost and to climatic conditions of dispersion of air pollutants in the atmosphere (Altunina, 2014).
In assessing the environmental status in the fields different methods of data acquisition are used. In Western Siberia, due to the remoteness of the areas affected by oil producing
companies, the most promising approach to on-line monitoring of vegetation is the use of satellite imagery (SI).
The Scientific Research Information Centre Institute of Petroleum Chemistry SB RAS has formed a collection of satellite images and MODIS data (Moderate-resolution Imaging Spectroradiometer Moderate Resolution Imaging Spectroradiometer) from the experimental site in Western Siberia for the period 2000 - 2015. Thematic MODIS products were manufactured by foreign experts relying on processing the satellite imagery data from the Terra MODIS satellite and digital elevation models. The MODIS satellite images are widely applied for the study of the atmosphere, water, and land. Terra MODIS is viewing the entire Earth's surface every 2 days, acquiring data in 36 spectral bands within the range
0.405-14.385 µm with a resolution of 250-1000 m, which provides simulation of the global and regional scenes. The purpose of the MODIS system is to collect data for calibrated global interactive models of the Earth as a single system. In the future, the use of interactive models is expected to predict global changes in the environment due to anthropogenic influences. It should be noted that the MODIS products are freely available and allow quickly assessing the status of the environment. In particular, the data from MOD13Q1 product (for the period within 10.06.2015 - 06.26.2015) necessary for this investigation were already available on 1 July 2015.
Remote sensing data processing and analysis
It is often necessary to form so-called ‘index’ images in order to use the spectral information. Based on the combination of the brightness values in certain channels, which provide data for highlighting the object under study, and a calculation of the spectral index of this object from these values, an image is generated using the index value in every pixel, which makes it possible to highlight this object or estimate its status. The image corresponding to the index value for each pixel is generated via combination of the brightness values in certain channels, which provide information for highlighting the object under study and
the calculation of these values ‘spectral index’ of object.
Spectral indices used for the study and assessment of the vegetation status have been referred to as vegetation indices. The International Archives of the Photogrammetry, Remote Sensing and Spatial Information Sciences, Volume XLI-B6, 2016
XXIII ISPRS Congress, 12–19 July 2016, Prague, Czech Republic
This contribution has been peer-reviewed.
The Vegetation Index is the index calculated as a result of manipulations with different spectral ranges (channels) from which the remote sensing data were taken. It is related to the vegetation parameters in a particular image pixel. Its efficiency is determined by the characteristics of reflection. These indices are mainly derived empirically.
The most popular and commonly used index of NDVI – the Normalized Difference Vegetation Index –was first described in 1973. It provides a straightforward indication of the amount of photosynthetically active biomass (generally referred to as vegetation index) and is the most common index for solving problems using quantitative assessment of vegetation. It is calculated by the following formula:
)
1
(
RED
NIR
RED
NIR
NDVI
where NIR is the reflectance in the near infrared spectrum; RED is the reflectance in the red region of the spectrum. NDVI is calculated using two most stable sections of the spectral reflectance curve of vascular plants (Estel, 2015). The maximum absorption of solar radiation by chlorophyll of higher vascular plants lies in the red spectral region (0.6-0.7 mm) while the region of maximum reflection of cellular structures of the leaf is in the infrared (0.7-1.0 microns) region. In other words, a high photosynthetic activity (generally associated with dense vegetation) gives a lower reflection in the red and a higher in the infrared region spectrum.
In order to compare the values of the NDVI index to the vegetation status, use is made of a standardized scale that determines the index values in the range from -1 to 1. It was found that for dense vegetation the value of NDVI ≥ 0.7 and for the sparse vegetation its values range from 0.3 to 0.5. For bare soil, NDVI = 0.025, for man-made materials and coatings, industrial soil NDVI becomes negative and approximately equal to -0.5. Typically, the problems related to mapping the vegetation species distribution areas are solved, using an indicated scale from 0 and higher, since the NDVI values for vegetation cannot be negative.
In this work, we used the thematic Terra MODIS product −
MOD13Q1 16-Day Vegetation Indices with the resolution 250 m, containing the values of the normalized vegetation index (NDVI), averaged over 16 days. The analysis of the NDVI values makes it possible to identify the problem areas with depressed vegetation, allowing one to make the most optimized decisions to improve the ecological status of the territory. Using statistical processing of the historical data on the NDVI values, in addition to determining the amount of a biomass one can also highlight the areas with depressed vegetation. NDVI is often used as a tool in more complicated types of analysis, based on which a series of maps of productivity of forest and agricultural lands, landscapes and natural zones and soils could be made, as well as other ecological and climatic maps. Using this index, it is also possible to obtain numerical data to be used for estimating and forecasting the forest yields and productivity, biodiversity, the degree of disturbance and damage from various natural disasters, technological accidents, etc.
Characteristics of the condition of the vegetation cover and its variation using the normalized difference vegetation index
As an example of Terra-MODIS satellite data use for environmental monitoring of the oil-producing areas, the
territories of four oil fields − Krapivinskoye, Myldzhinskoye,
Luginetskoye and Urmanskoye (Figure 1), located in Tomsk region were analyzed. An area of 100 thousand hectares belonging to the Oglatsky State Natural Reserve of regional significance was investigated as a reference territory. The main
assets of this reserve are the forest stands of the Kargasoksky district of Tomsk region, with mixed forests predominating. Using an ArcGis geoinformation system, the average NDVI value for the period from 2010 to 2015 was calculated from the thematic MOD13Q1 product data for the territories of four fields and that of the Oglatsky Reserve.
Figure 1. Experimental area
MODIS grid with separate elements, four of which, sectors 21-02, 22-21-02, 21-03 and 22-03 (where the first pair of digits indicates the number of elements in the horizontal axis and the second pair – the number of the element in the vertical axis), cover the territory of the Tomsk region completely. The oil fields and the reference site (reserve) are located in sector 22-03. Due to this fact the analysis of the MOD13Q1 thematic product was performed for this sector of the grid during a 6-year period from 2010 to 2015. The images for this analysis were formed on a 16-day basis from June 10 to June 26 of each year.
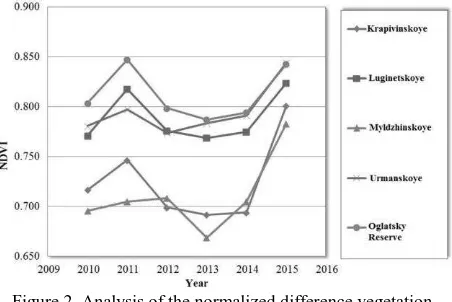
Figure 2. Analysis of the normalized difference vegetation index values
As can be seen from Figure 2, the maximum value, NDVI = 0.847, corresponds to that for the reference site (the Oglatsky Reserve) in 2011. It is worth noting that for all the investigated areas the trend of the curves is the same - high values in 2011 and 2015 and minimum - in 2010 and 2013, except for the Myldzhinskoye field. For instance, in 2010 this trend can be accounted for a high-level, large-area flooding in Tomsk region, which contributed to a natural wash-off of the oil from the oil-polluted soils and a mature vegetation cover in the following year.
The relatively low NDVI values calculated for the year 2013 might be due to the fact that the summer of 2013 began with an invasion of the cold arctic air, and the resulting low temperatures and abundant precipitation in June 2013 delayed the development of vegetation. The average temperature in June
2013 were found to be + 13 ... +15 °C, which is 1 ... 2 °C below
the norm, and 7 ... 8 °C lower than the average in 2012. The International Archives of the Photogrammetry, Remote Sensing and Spatial Information Sciences, Volume XLI-B6, 2016
XXIII ISPRS Congress, 12–19 July 2016, Prague, Czech Republic
This contribution has been peer-reviewed.
For a more detailed analysis of the resulting data, the NDVI values were presented in the form of linear trends. These plots revealed that the values of NDVI obtained in 2015 for vegetation of the Urmanskoye field were practically the same as those of the reference site. Commissioned in 2006, this oil field belongs to the comparatively young fields in Tomsk region. Earlier (Altunina, 2014) we observed a trend of variation in the number of emergency failures and the area of contaminated lands as a function of the year when oil production was started in this field.
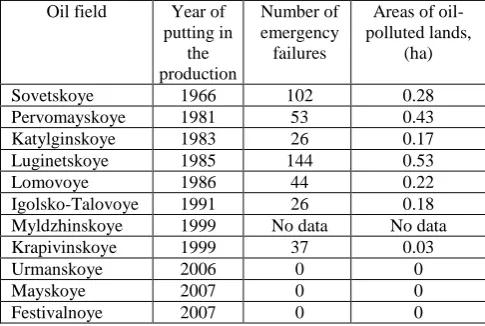
It was established that soil and water contamination is due to the high accident rate in the older deposits, which predominate in the territory of Tomsk region. In 2012, 601 emergency equipment failures were recorded at the oil and gas sites of Tomsk region, (including 423 − in the oil pipelines, 176 −in the water supply lines, and 2 – in gas lines). The majority of failures in oil and water pipelines was due to pipe corrosion and increased exploitation rate. Table 1 shows the number of failures at the oil-producing facilities, and the areas of contaminated lands. The results are listed both for some of the old oil fields, whose service exceeds 20-50 years, and for the young Urmanskoye, Mayskoye, and Festivalnoye fields, which were put into operation in 2006-2007.
Oil field Year of putting in
the production
Number of emergency
failures
Areas of oil-polluted lands,
(ha)
Sovetskoye 1966 102 0.28
Pervomayskoye 1981 53 0.43
Katylginskoye 1983 26 0.17
Luginetskoye 1985 144 0.53
Lomovoye 1986 44 0.22
Igolsko-Talovoye 1991 26 0.18
Myldzhinskoye 1999 No data No data
Krapivinskoye 1999 37 0.03
Urmanskoye 2006 0 0
Mayskoye 2007 0 0
Festivalnoye 2007 0 0
Table 1. Number of emergency failures and areas of oil-polluted lands in the oil fields of Tomsk region in 2012
The analysis of the number of failures and the area of contaminated lands was performed for the territory of the Luginetskoye oil field from 2009 to 2014. It was found that the maximum number of accidents during the above period occurred in 2012 (144 failures) and the minimum number (69 cases), which is consistent with the variations in NDVI values for vegetation within the Luginetskoye oil field. In particular, the status of vegetation from 2012 to 2014 was the worst and the index values were minimal, while since 2014 the index doubled with decreasing the number of accidents. It was the large area of contamination, which, starting from 2012 and especially in 2013 (maximum contaminated area 0.69 ha), affected the vegetation status in those years: the lowest NDVI values were in 2013. In 2014 there were fewer accidents and smaller contaminated land areas, which consequently affected the value of the index it increased in 2015. Thus, we have shown a direct correlation between the number of accidents, the
area of oil pollution and the status of vegetation on the territory of an oil-producing enterprise.
The lowest value of the index (NDVI = 0.669) was calculated for the vegetation in the territory of the Myldzhinskoye gas-condensate field in 2013. To our knowledge, there are no data on the accidents on the territory of this field. We believe that the territory of the Myldzhinskoye field requires a more detailed study using satellite images of higher spatial resolution to identify the factors that caused the decrease in the index in 2013. In general, for the territories of all the fields studied, there is an increase in the index since 2014, suggesting a good (unsuppressed) status of vegetation and an improved environmental situation.
Conclusion
The use of remote sensing data to solve environmental problems allows monitoring the vegetation status of inaccessible oil and gas producing areas of Western Siberia. This monitoring is based on an integrated approach. In order to analyze the landscape status of the territories of oil producing enterprises, the climatic factors, the number of crashes, and the area of contaminated lands have been taken into account. In 2013, an application of the Terra MODIS satellite data for the environmental monitoring of oil-producing areas of four oil fields of Tomsk region allowed determining the suppressed vegetation status of the territories of the Krapivinskoye, Luginetskoye, and Myldzhinskoye oil fields and identifying its improvement with time throughout the territories under study. A comparative analysis was performed of the calculated values of the vegetation index for the oil fields with those of the reference vegetation status of the Oglatsky State Natural Reserve in Tomsk region.
The application of satellite data allows mapping inaccessible marshland and their spatial analysis, which is very useful in a timely estimation of the environmental situation and solves the problems of elimination and prevention of environmental pollution.
ACKNOWLEDGEMENTS
This article is designed as part of the national project of the Ministry of Education and Science of the Russian Federation № 3653 "Models, algorithms and software to support decision-making in risk management in the socioeconomic and industrial-technological system".
REFERENCIES
Polishchuk, Yu., Tokareva, O., 2014. The use of satellite images for ecological estimate of flare firing of gas at oil fields of Siberia. Atmospheric and Oceanic Optics, 27(7), pp. 647-651.
Altunina, L., Svarovskaya, L., Alekseyeva, M., Yashchenko, I., 2014. Integrated Assessment of Anthropogenic Contamination of Oil-Producing Territories in Western Siberia. Petroleum Chemistry, 54(3), pp. 234-238.
Estel, S., Kuemmerle, T., Levers, C., Hostert, P., Alcántara, C., Prishchepov, A., 2015. Mapping farmland abandonment and recultivation across Europe using Modis NDVI time series. Remote sensing of environment, 163, pp. 312-325.
The International Archives of the Photogrammetry, Remote Sensing and Spatial Information Sciences, Volume XLI-B6, 2016 XXIII ISPRS Congress, 12–19 July 2016, Prague, Czech Republic
This contribution has been peer-reviewed.