BALANCED VS IMBALANCED TRAINING DATA: CLASSIFYING RAPIDEYE DATA
WITH SUPPORT VECTOR MACHINES
M. Ustuner a, F. B. Sanli a, *, S. Abdikan b
a Department of Geomatics Engineering, Yildiz Technical University, Istanbul, Turkey - (mustuner, fbalik)@yildiz.edu.tr b Department of Geomatics Engineering, Bulent Ecevit University, Zonguldak, Turkey - sabdikan@beun.edu.tr
Commission VII, WG VII/4
KEY WORDS: Land cover classification, Imbalanced training data, Support Vector Machines, RapidEye, Agriculture
ABSTRACT:
The accuracy of supervised image classification is highly dependent upon several factors such as the design of training set (sample selection, composition, purity and size), resolution of input imagery and landscape heterogeneity. The design of training set is still a challenging issue since the sensitivity of classifier algorithm at learning stage is different for the same dataset. In this paper, the classification of RapidEye imagery with balanced and imbalanced training data for mapping the crop types was addressed. Classification with imbalanced training data may result in low accuracy in some scenarios. Support Vector Machines (SVM), Maximum Likelihood (ML) and Artificial Neural Network (ANN) classifications were implemented here to classify the data. For evaluating the influence of the balanced and imbalanced training data on image classification algorithms, three different training datasets were created. Two different balanced datasets which have 70 and 100 pixels for each class of interest and one imbalanced dataset in which each class has different number of pixels were used in classification stage. Results demonstrate that ML and NN classifications are affected by imbalanced training data in resulting a reduction in accuracy (from 90.94% to 85.94% for ML and from 91.56% to 88.44% for NN) while SVM is not affected significantly (from 94.38% to 94.69%) and slightly improved. Our results highlighted that SVM is proven to be a very robust, consistent and effective classifier as it can perform very well under balanced and imbalanced training data situations. Furthermore, the training stage should be precisely and carefully designed for the need of adopted classifier.
1. INTRODUCTION
With the increasing number of earth observation satellites and recent advancement in remote sensing data analysis, there has been a tremendous increase in earth observation applications ranging from environmental monitoring and mapping, climate dynamics up to the disaster monitoring and risk assessment (Khatami et al., 2016).Remote sensing provides crucial and efficient information about the earth’s land cover in local or global scales accurately and temporally hence these information is important for policy and decision makers on many socioeconomic and environmental issues (Townshend, 1992; Kavzoglu, 2009).
Due to the rapid population growth and global climate change, the sustainable management of agricultural as well as natural resources are becoming crucial for countries regarding to increasing necessity of food and water (Forkuor et al., 2014; Kim and Yeom, 2015). Spectral context of remote sensing data offers many unique determiners such as near-infrared band or vegetation indices for the vegetation, forestry and agricultural applications (Kim and Yeom, 2015). Crop monitoring is one of the common applications of remote sensing as it provides many important input parameters for crop yield estimation. Accurate crop identification is significant for national food policy and sustainable crop production in local scale (Forkuor et al., 2014; Wang et al., 2015). Therefore the number of earth observation satellites incorporating the sensor sensitive to chlorophyll content of vegetation as well as its related environmental applications have been increasing over the last few years (Omer et al., 2015; Gärtner et al., 2016). As an such example of recently launched satellite Sentinel-2A (2015) which is a European high resolution and multispectral imaging system offers 13-multispectral bands with spatial resolutions of 10,20
and 60 meters including three different red-edge and one near-infrared bands as those are particularly useful for agricultural, ecological, and forestry applications (Immitzer et al., 2016). RapidEye imagery which is high resolution imaging system incorporating red-edge and near-infrared bands sensitive to vegetation context is particularly preferred on this study because the study area is mainly covered the agricultural fields. The contribution of red-edge band over the agricultural areas for the classification as well as on feature extraction have been tested and proved in many studies (Schuster et al., 2012; Adelabu et al., 2014)
(Foody et al., 2006; Waske et al., 2009). Classification of imbalanced data set is one of the challenging problems in pattern recognition and remote sensing community. Handling the problem of classification with imbalanced data within remote sensing was investigated in some studies by resampling training data set and multiple classifiers (classifier ensembles) or SVM classification (Trebar and Steele, 2008; Waske et al., 2009; Mohd Pozi et al., 2015). SVM, is one of the popular machine learning algorithms, is commonly used and still has been explored in remote sensing community by reasons of handling the high dimensionality problem with small training data set and achieving the high classification accuracy (Melgani and Bruzzone, 2004; Foody et al., 2006).
This paper aims to evaluate the how much the classifiers have been influenced with imbalanced training data for mapping the crop types and comparative performance for each classifiers with RapidEye imagery.
2. STUDY SITE AND DATA COLLECTION
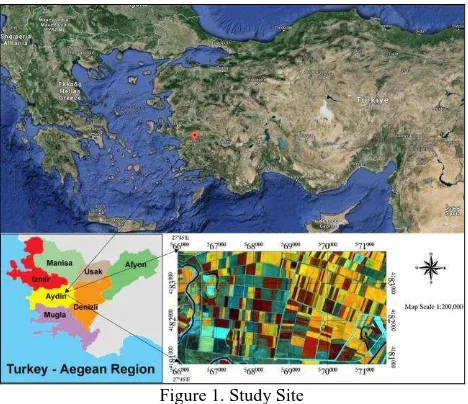
The study area is located in Aydin, a province of southwestern Turkey, where Mediterranean climate is dominant. Ideal climatic conditions as well as soil characteristics provide the fertile lands to the region hence one of the major sources of income over the region is agriculture (Figure 1). The study site is dominantly covered by cultivated areas.
Figure 1. Study Site
RapidEye, a commercial earth observation system, is particularly designed for vegetation, forestry and agricultural applications as it incorporates the red-edge band sensitive to chlorophyll content. It provides high resolution five spectral bands from 400 nm to 850 nm. RapidEye imagery (RapidEye Level 3A products are radiometric, sensor and geometrically corrected data by the provider of RapidEye imagery. (BlackBridge, 2013). Ground truth data was collected by soil scientists through in situ surveys at the acquisition date of imagery. These data is used for both classification process and testing the accuracy of classified images.
3. METHODOLOGY
Learning stage of supervised classifiers is dominantly dependent on the characteristics of training data and its adaptation with input imagery and implemented classifiers. At this point, training set has key importance because it should be fully representative of the land use/cover classes and well-adapted to the classifier. In particular, the distribution of sample pixels plays a significant role on classification performance, especially for parametric classifiers such as maximum likelihood (Lu and Weng, 2007; Kavzoglu, 2009). To test the influence of balanced and imbalanced training datasets on image classification accuracy, three different supervised classification methods (SVM, ML and ANN) have been implemented for mapping the crop pattern. Two different balanced datasets and one imbalanced dataset have been used in classification stage.
3.1 Training Data Design
In practical situations, we might have imbalanced training samples due to the difficulties to obtain ground data. Training stage has significant role on supervised learning of classification algorithms. In this study, three different sets of training samples, of two balanced and one imbalanced, have been created to evaluate the impacts on image classification within three different algorithms. Training Set1 and Set 2 have 70 pixels and 100 pixels for each class, respectively. Set3 has different number of pixels for each class as seen in Table 1.
Table 1.Training set size
3.2 Image Classification
Machine learning algorithms such as support vector machines and artificial neural networks have been widely used and tested many times in remote sensing from optical to radar data for image classification in past decades (Pal et al., 2013). Relatively newer classification algorithms such as extreme learning machine (ELM) (Pal, 2009), relevance vector machines (RVMs) (Demir and Erturk, 2007), incremental import vector machines (I2VM) (Roscher et al., 2012) and rotation-based SVM (RoSVM) (Xia et al., 2016) have been introduced into remote sensing community for data classification purposes and tested fewer times compared to common ones. Rather than classification method by itself, input imagery and training set have more significance for obtaining high accuracy as each method is based on supervised learning (Kavzoglu, 2009).
Maximum Likelihood classification is the most conventional classification method used in remote sensing and based on Baye's theorem. This method takes into consideration mean vector and covariance matrix of sample pixels for a class and calculate the probability of pixel to assign into a particular Class/Number of samples Balanced Imbalanced
Classes Set 1 Set 2 Set 3
First crop corn 70 100 70
Second crop corn 70 100 56
Well-developed cotton 70 100 47
Moderate-developed cotton 70 100 76
Weak-developed cotton 70 100 31
Wet soil 70 100 104
Moist soil 70 100 20
Dry soil 70 100 83
class. Pixel is labelled to the particular class of highest belonging probability or likelihood (Kavzoglu and Colkesen, 2009; Mather and Koch, 2011).
Artificial Neural Network classification has been extensively used in remote sensing area as an alternative to the statistical classification methods over the last decades. ANN models try to behave like neural system of human brain and neuron is the fundamental unit of the network. A simple neural network model contains at least three types of layers (input, hidden and output). Backpropagation algorithm which is the most commonly used algorithm is used for supervised learning. Design of the neural network system and optimization of training parameters such as learning rate are quite important on learning stage. (Benediktsson et al. 1990; Kavzoglu and Mather, 2003; Kavzoglu, 2009)
Support Vector Machines, a popular and powerful kernel-based classification algorithm, has been extensively and successfully implemented in remote sensing for classification and regression problems. This method aims to define the optimal hyperplane separating two classes with maximum margin width. The underlying reason of SVM’s popularity for classification is achieving the high classification accuracy with a small number of training data and able to outperform than other conventional methods such as ANN and ML classification. If it was not possible to separate two classes by linearly, SVM utilizes kernel functions to separate classes in higher dimensional space. Kernel functions need user-defined parameters and choice of suitable kernel type and corresponding parameters have a great impact of the performance of SVM (Melgani and Bruzzone, 2004). In this study, Radial Basis Function (RBF) as a kernel type was implemented and optimum parameters for RBF kernel have been determined by using grid search method as 0.2 and 300 for kernel width and penalty parameter, respectively. Only basic information for each method is provided here and reader comparatively assessed on how classification performance was changed by increasing the number of training samples for per class.
4.1 Experimental Results
Figure 2 demonstrates the overall classification accuracies of ML method by different training sets (set1, set2 and set3).
90,94
Figure 2. ML classification and training set
When increased the number of training samples for per class
Figure 3. ANN classification and training set
Figure 3 summarizes the performances of ANN classifications by balanced and imbalanced training sets. The increase of pixel samples per class has resulted in a reduction of classification accuracy from 91.56% to 90.63% as overall accuracy. The overall accuracy was reduced by 3.1 % when imbalanced data was used as an input for classification (Figure 3).
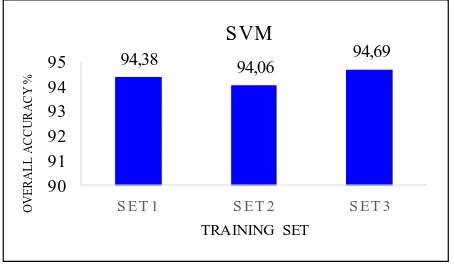
94,38 94,06 94,69
Figure 4. SVM classification and training set
There is no significant impact on the classification accuracy by different training sets however slightly reduced when the training samples for per class were increased (from set1 to set2). The classification accuracy is slightly increased when imbalanced data was an issue (from 94.38% to 94.69%). SVM is the most determined classification method within classification accuracy on different training sets.
In all cases, SVM outperformed all other methods and received highest classification accuracy of 94.69% of overall accuracy. Moreover in all cases (by utilization of set1, set 2 or set 3), ANN outperformed ML within overall classification accuracy and obtained the 91.56% of overall accuracy at maximum. ANN and ML were negatively affected by use of imbalanced training data in resulting of reduction in classification accuracy by 5% and 3.1% of overall accuracy, respectively, however SVM was not affected significantly and classification accuracy was slightly increased. (Figure 5).
Individual Class Accuracies (%) for Set 3
Class SVM ANN MLC
1 98.25 92.98 78.95
2 97.78 84.44 100.00
3 91.89 75.68 75.68
4 100.00 100.00 100.00
5 76.92 84.62 69.23
6 82.35 76.47 76.47
7 93.75 84.38 78.13
8 97.44 97.44 92.31
9 100.00 95.00 90.00
Classes: 1: First crop corn, 2: Second crop corn, 3: Well-developed cotton, 4: Moderate Well-developed cotton, 5: Weak developed cotton, 6: Wet soil, 7: Moist soil, 8: Dry soil, 9:Water body
Table 2. Individual class accuracies
Individual class accuracies by using of imbalanced training set for each classification method were reported in Table 2. The highest accuracies for individual class category are given in bold in Table 2. Most of the crop types were classified more accurately by SVM than ANN and MLC however in some particular classes such as second crop corn and weak developed cotton, MLC and ANN obtained highest classification accuracy, respectively. Moderate developed cotton was classified in 100% accuracy by all methods (Table 2). SVM is the one single method that can classify the water body with 100% classification accuracy in our experimental study. Even though MLC has the lowest ranking on overall classification accuracy among the methods for training set 3, it classified second crop corn most accurately.
Figure 6. Thematic maps of ML
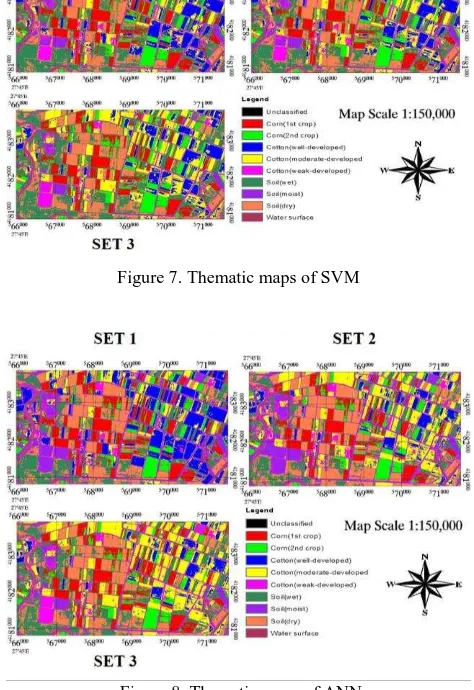
Thematic maps produced by ML, SVM and ANN can be seen at Figure 6, Figure7 and Figure8, respectively.
Figure 7. Thematic maps of SVM
Figure 8. Thematic maps of ANN
5. CONCLUSIONS
ACKNOWLEDGEMENTS
Authors gratefully acknowledge to Prof. Dr. Yusuf Kurucu and Dr. Ing M. Tolga Esetlili, Ege University, Turkey for providing free access to satellite imagery and their assistance in the interpretation of the experimental results. The authors would also like to acknowledge Dr. Helmi Zulhaidi Mohd Shafri, Universiti Putra Malaysia (UPM) for his insightful comments for the manuscript.
REFERENCES
Adelabu, S., Mutanga, O., & Adam, E., 2014. Evaluating the impact of red-edge band from Rapideye image for classifying insect defoliation levels. ISPRS Journal of Photogrammetry and Remote Sensing, 95, 34-41
Benediktsson, J.A., Swain, P.H., & Ersoy, O.K., 1990. Neural Network Approaches versus Statistical Methods In Classification Of Multisource Remote Sensing Data. IEEE Transactions on Geoscience and Remote Sensing, 28, 540-552
Demir, B., & Erturk, S., 2007. Hyperspectral Image Classification Using Relevance Vector Machines. IEEE Geoscience and Remote Sensing Letters, 4, 586-590
Foody, G.M., Mathur, A., Sanchez-Hernandez, C., & Boyd, D.S., 2006. Training set size requirements for the classification of a specific class. Remote Sensing of Environment, 104, 1-14
Forkuor, G., Conrad, C., Thiel, M., Ullmann, T., ve Zoungrana, E., 2014. Integration of Optical and Synthetic Aperture Radar Imagery for Improving Crop Mapping in Northwestern Benin, West Africa. Remote Sensing, 6, (7), pp. 6472-6499
Gärtner, P., Förster, M., & Kleinschmit, B., 2016. The benefit of synthetically generated RapidEye and Landsat 8 data fusion time series for riparian forest disturbance monitoring. Remote Sensing of Environment, 177, 237-247
Immitzer, M., Vuolo, F., & Atzberger, C., 2016. First Experience with Sentinel-2 Data for Crop and Tree Species Classifications in Central Europe. Remote Sensing, 8, 166
Kavzoglu, T., & Mather, P.M., 2003. The use of backpropagating artificial neural networks in land cover classification. International Journal of Remote Sensing, 24, 4907-4938
Kavzoglu, T., 2009. Increasing the accuracy of neural network classification using refined training data. Environmental Modelling & Software, 24, 850-858
Kavzoglu, T., & Colkesen, I., 2009. A kernel functions analysis for support vector machines for land cover classification. International Journal of Applied Earth Observation and Geoinformation, 11, 352-359
Khatami, R., Mountrakis, G., & Stehman, S.V., 2016. A meta-analysis of remote sensing research on supervised pixel-based land-cover image classification processes: General guidelines for practitioners and future research. Remote Sensing of Environment, 177, 89-100.
Kim, H.-O., ve Yeom, J.-M., 2015. Sensitivity of vegetation indices to spatial degradation of RapidEye imagery for paddy
rice detection: a case study of South Korea. GIScience & Remote Sensing, 52, (1), pp. 1-17
Lu, D., & Weng, Q., 2007. A survey of image classification methods and techniques for improving classification performance. International Journal of Remote Sensing, 28, 823-870
Mather, P.M., & Koch, M., 2011. Classification. Computer Processing of Remotely-Sensed Images (pp. 229-284): John Wiley & Sons, Ltd
Melgani, F., & Bruzzone, L., 2004. Classification of hyperspectral remote sensing images with support vector machines. IEEE Transactions on Geoscience and Remote Sensing, 42, 1778-1790
Mohd Pozi, M.S., Sulaiman, M.N., Mustapha, N., & Perumal, T., 2015. A new classification model for a class imbalanced data set using genetic programming and support vector machines: case study for wilt disease classification. Remote Sensing Letters, 6, 568-577
Omer, G., Mutanga, O., Abdel-Rahman, E.M., & Adam, E., 2015. Performance of Support Vector Machines and Artificial Neural Network for Mapping Endangered Tree Species Using WorldView-2 Data in Dukuduku Forest, South Africa. IEEE Journal of Selected Topics in Applied Earth Observations and Remote Sensing, 8, 4825-4840
Pal, M., 2009. Extreme‐learning‐machine‐based land cover classification. International Journal of Remote Sensing, 30, 3835-3841
Pal, M., Maxwell, A.E., & Warner, T.A., 2013. Kernel-based extreme learning machine for remote-sensing image classification. Remote Sensing Letters, 4, 853-862
Roscher, R., Förstner, W., & Waske, B., 2012. I2VM: Incremental import vector machines. Image and Vision Computing, 30, 263-278
Schuster, C., Förster, M., & Kleinschmit, B., 2012. Testing the red edge channel for improving land-use classifications based on high-resolution multi-spectral satellite data. International Journal of Remote Sensing, 33, 5583-5599
Townshend, J.R.G., 1992. Land cover. International Journal of Remote Sensing, 13, 1319-1328
Trebar, M., & Steele, N., 2008. Application of distributed SVM architectures in classifying forest data cover types. Computers and Electronics in Agriculture, 63, 119-130
Wang, D., Zhou, Q., Su, Y., & Zhongxin, C., 2015. Advances in research on crop identification using SAR. In, Agro-Geoinformatics (Agro-geoinformatics), 2015 Fourth International Conference on (pp. 312-317)
Waske, B., Benediktsson, J.A., & Sveinsson, J.R., 2009. Classifying Remote Sensing Data with Support Vector Machines and Imbalanced Training Data. In J.A. Benediktsson, J. Kittler & F. Roli (Eds.), Multiple Classifier Systems: 8th International Workshop, MCS 2009, Reykjavik, Iceland, June 10-12, 2009. Proceedings (pp. 375-384). Berlin, Heidelberg