ASSESSMENT OF A STATIC MULTIBEAM SONAR SCANNER FOR 3D SURVEYING IN
CONFINED SUBAQUATIC ENVIRONMENTS
E. Moisana,b∗, P. Charbonniera, P. Fouchera, P. Grussenmeyerb, S. Guilleminb, O. Samatc, C. Pag`esc
a
Cerema Est, Laboratoire de Strasbourg, 11 rue Jean Mentelin, B.P. 9, 67035 Strasbourg, France
{Emmanuel.Moisan, Pierre.Charbonnier, Philippe.Foucher}@cerema.fr b
ICube Laboratory UMR 7357, Photogrammetry and Geomatics Group, INSA Strasbourg, 24 Boulevard de la Victoire, 67084 Strasbourg, France -{pierre.grussenmeyer, samuel.guillemin}@insa-strasbourg.fr
c SUB-C MARINE, 18 Alfred Nobel - BP 24, 69320 Feyzin, France -{os, cp}@subcmarine.com
Commission V, WG V/3
KEY WORDS:3D modelling, accuracy assessment, Mechanical Sonar Scanner, Terrestrial Laser Scanner
ABSTRACT:
Mechanical Scanning Sonar (MSS) is a promising technology for surveying underwater environments. Such devices are comprised of a multibeam echosounder attached to a pan & tilt positioner, that allows sweeping the scene in a similar way as Terrestrial Laser Scanners (TLS). In this paper, we report on the experimental assessment of a recent MSS, namely, the BlueView BV5000, in a confined environment: lock number 50 on the Marne-Rhin canal (France). To this aim, we hung the system upside-down to scan the lock chamber from the surface, which allows surveying the scanning positions, up to an horizontal orientation. We propose a geometric method to estimate the remaining angle and register the scans in a coordinate system attached to the site. After reviewing the different errors that impair sonar data, we compare the resulting point cloud to a TLS model that was acquired the day before, while the lock was completely empty for maintenance. While the results exhibit a bias that can be partly explained by an imperfect setup, the maximum difference is less than 15 cm, and the standard deviation is about 3.5 cm. Visual inspection shows that coarse defects of the masonry, such as stone lacks or cavities, can be detected in the MSS point cloud, while smaller details, e.g. damaged joints, are harder to notice.
1. INTRODUCTION
In this contribution, we propose to evaluate the capacities of a Mechanical Sonar Scanner (MSS) for underwater surveying in a confined environment, by comparing the 3D model of a canal lock, provided by the sonar device, to a reference model obtained with a Terrestrial Laser Scanner (TLS).
3D mechanical sonar scanning is an emerging technology that produces 3D point clouds in a similar manner as TLS. In this work, we consider a Blueviewr(www.blueview.com) BV5000 scanner. It is composed of an underwater measuring device (a multibeam echosounder, MBES) and a tiltable mechanical rota-tion system that enables sweeping the scene around. The sys-tem may be placed on a tripod and operated from the floor of the canal, or hung upside-down for scanning from the surface.
To our best knowledge, only a few papers address the problem of evaluating the metrological capacities of such a system in op-erating conditions. We may cite (Rondeau et al., 2012) and (Rondeau et al., 2015) for MBES in dynamic applications and (Lesnikowski and Rush, 2012) for a point-wise evaluation of the BV5000. In (Moisan et al., 2015), we outlined a qualitative anal-ysis of the difficulties relative to the use of a MSS in a canal. In the present paper, we propose a qualitative and quantitative assessment of the measuring abilities of a MSS based on a com-parison between the point clouds obtained using a MSS and a TLS.
More specifically, we took the opportunity provided by the plete emptying of a canal lock for maintenance to make its com-prehensive survey using a TLS (namely, the Faror Focus 3D X330). Since the model accuracy is better than the centimeter,
∗Corresponding author
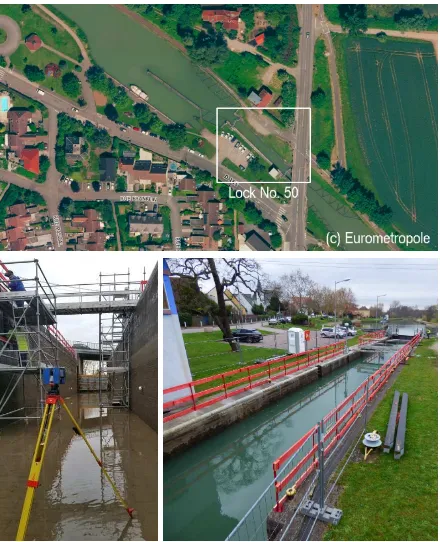
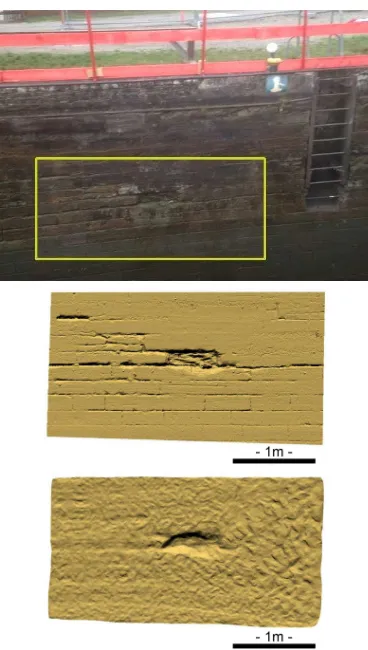
Figure 1. Top: aerial view of lock No. 50 on the Marne-Rhine canal. Bottom left: view of the lock during maintenance opera-tions and 3D TLS surveying of the chamber; bottom right: after refilling.
counter-the site, which implies unfavourable incidence angles. When sur-veying from the surface, the scanning positions were accurately measured using a total station, which makes the registration and geo-referencing tasks easier.
The rest of the paper is organized as follows. In Sec. 2, we give more details about the experimental setup. The construction of the 3D MSS model is described in Sec. 3. Qualitative and quan-titative analyses are given in Sec. 4. Finally, Sec. 5 concludes the paper.
2. EXPERIMENTAL SETUP
The experimental site is a lock (number 50) of the Marne-Rhine Canal, operated by Voies Navigables de France (VNF). Located in north eastern France, this 313 km long canal opened in 1853 connects the Marne river, in Vitry-le-Franc¸ois, with the Rhine, in Strasbourg. The dimensions of its 154 locks are governed by the Freycinet gauge: minimum 38.5 m long, 5.05 m width and 2.5 m draught. Lock No. 50 is located in Souffelweyersheim, in the vicinity of Strasbourg. It has a rise of about 1.6 m and its chamber is indeed a little wider than the gauge: 43.2 m long, 5.2 m wide and more than 2.6 m draught (which corresponds to a sidewall height of 5.1 m). In December 2015, the lock was closed with cofferdams and completely drained, for maintenance operations and 3D surveying (Fig. 1).
The TLS survey was carried out by the INSA Strasbourg team on December 1 (some complementary scans were taken on the next day, after scaffolding disassembly). Six scans were taken from the bottom of the empty lock and height, from the top, using a Faro Focus 3D X330. Spherical targets (see image (a) on Fig. 2 on the following page) were carefully placed around the environ-ment to facilitate registration of the scans, which was done within the Faro Scene framework with sub-centimeter accuracy. The re-sulting model will be considered as a reference for the rest of the study. A sample model of the top structure of the lock is shown on Fig. 2b.
The MSS survey was conducted by the Sub-C marine company on December 4, immediately after refilling the lock. The cham-ber was then almost in the same state as during the TLS survey. The only noticeable difference is that the bottom door was open for the TLS survey and closed for the MSS one. The water is rather turbid, as may be seen on the photographs, and the mea-sured sound speed was about 1434 m.s−1.
The characteristics of the BlueView BV5000 used in this exper-iment are given in Tab. 1. The frequency of the emitted sound wave (1.35 MHz) is well suited to the dimensions of the sur-veyed structure. As proposed in (Lesnikowski and Rush, 2012), some hollow metallic spheres could have been used as reference
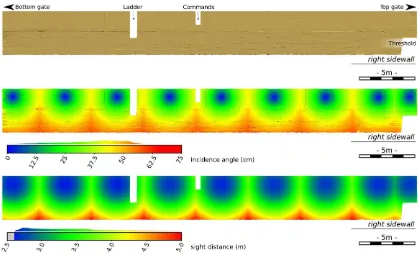
Scans were taken every 5 m along the lock, which provided 9 point clouds. At each scanning position, the sonar head rotated 360◦around its vertical axis, with 3 successive tilt angles: 15◦, -15◦, -45◦. As shown on Fig. 3 on the next page, this config-uration leads to a maximum incidence angle of 75◦and a maxi-mum sight distance of 5 m. We note that placing the sonar deeper would limit these angles and distances, leading to more favorable acquisition geometries. Moreover, a set of three “free” (i.e. not localized) scans were performed from the canal floor, with the BV5000 placed on a tripod. Fig. 2d shows a crude model of the top structure of the lock, obtained after a manual registration of several raw MSS scans.
3. MODEL ALIGNMENT AND GEO-REFERENCING
In this section, we introduce a geometric method for registering the 3D underwater model. The full model is built from acqui-sitions collected by the MSS device at 9 upside-down scanning positions. We propose a two-step registration process.
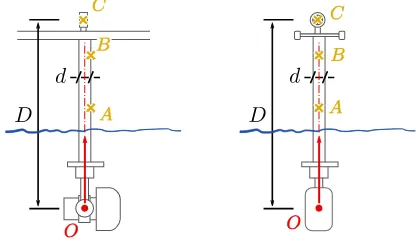
First, the orientation of the metallic pole, corresponding to the ro-tation axis of the sonar, and the scanner positionOare computed for each scan. For this purpose, we rely on the positions of three points (A,BandCon Fig. 4) obtained by tacheometric survey, as described in Sec. 2. Moreover, we use a geometrical surveying of the rigid system comprising the prism, the metallic pole and the sonar. In particular, since distancesDanddare measured be-forehand, elementary calculations provide the orientation of the rotation axis.
Figure 4. View of the rigid system used for sonar acquisitions, (left) perpendicularly to the sight direction of the total station and (right) in the sight direction. A geometrical survey of the system is carried out beforehand, providing distancesdandD. For each scanning position, pointsAandB, located in the middle of the metallic pole, and pointC(prism center) are surveyed.
(a) (b)
(c) (d)
Figure 2. (a) extremity of the empty lock (near the top gate); (b) corresponding TLS model; (c) view of the ladder supporting the fixation of the MSS (pole) and a tacheometric prism (the tacheometer is visible on the background); (d) MSS model (manually processed).
Figure 5. Horizontal rotations of the point clouds for horizontal alignment. (Left) the longitudinal axis of each scan is defined us-ing PCA. (Middle) each scan is given the same orientation. Note that the rotation anglesαiare different. (Right) the point clouds are aligned by applying a rotation with a common angleβ. Scan centersOiremain fixed during the whole process.
In our approach, we assume that the canal lock is symmetric with respect to a vertical plane. This plane defines the longitudinal axis of the lock, which can be computed for each point cloud us-ing Principal Component Analysis (PCA). Hence, the horizontal orientation problem is reduced to aligning the longitudinal axis of the different scans (whose center positions are known) by ap-plying rotations, as explained on Fig. 5. First, the axis of the different point clouds are rotated by an angleαi, in such a way that their resulting orientations are identical. Note that this ori-entation is arbitrarily defined (see Fig. 5-middle). Secondly the axis of the scans are aligned by applying a rotation by a common angleβ, as shown on Fig. 5-right.
Theβangle can be determined from any couple of scans,(Si, Sj), using a simple geometric construction that exploits two invari-ants: the distance between scan origins (OiandOj) and the or-thogonal distance betweenOj and the axis of symmetry of the corresponding scan,Sj. In practice, we compute such angles for several couples and takeβas their mean.
As the experimental results show (see Sec. 4), the proposed method yields satisfactory results. However, improvements might be ex-pected by refining the registration using a global technique such as the Iterative Closest Point (ICP) method (Besl and McKay, 1992). It might be important, in that case, to weight the 3D points according to their incidence angle or sight distance, in order to take into account the noise and loss of resolution effects that can be observed, specially in narrow environments (Moisan et al., 2015).
4. EXPERIMENTAL RESULTS
Before we study the quality of the sonar model with respect to the reference laser one, from both a quantitative and a qualitative point of view, it might be useful to get some insight on the differ-ent perturbations that impair sonar data, especially for the readers who are not familiar with this kind of 3D imaging technique.
experimental setup and the characteristics of the surveyed object.
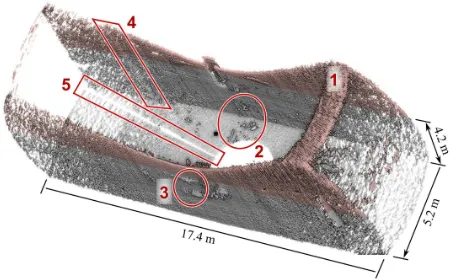
In the first place, many artifacts are due to reflections of the signal on the water surface. These points (No. 1) are coloured in salmon on Fig. 6. Provided that the water level is known, which requires some external means, for example ladders as in (Moisan et al., 2015) or tacheometry in the present case, these points can be eas-ily removed from the point cloud. Artifacts due to reflections on other surfaces (typically, the walls) can also be removed manually using the approximate shape of the lock chamber. Other artifacts are due to acoustic phenomena in the water column and result in “phantom” objects (see No. 2 on Fig. 6) or in systematic pat-terns when signal backscatters from surface (see No. 3 on Fig. 6). In the present work, all these artifacts were manually processed prior to registering the point clouds.
The granular aspect of the MSS output becomes more and more visible as the distance from the source increases. This is also no-ticeable in both horizontal and vertical cross-sections (Fig. 7 on the next page). The increasing imprecisions may be explained by the inherent noise of sonar data, and by the fact that the footprint size of the signal increases with the distance due to the narrow-ness of the canal, which yields more and more unfavorable in-cident angles (Moisan et al., 2015). To remove this granularity, specific filtering algorithms have to be used. In this paper, we use a simple meshing following the method described in (Moisan et al., 2015), but only for visualizing details (Sec. 4.3).
Some artifacts seem to be related to the mechanical sweeping system. For example, we notice that some profiles, correspond-ing to successive horizontal acquisition angles, are quite similar (see No. 4 on Fig. 6). A possible explanation is that the rota-tive mechanism temporarily blocks while the system carries on incrementing the value of the acquisition angle. This error im-pairs the geometry of the point clouds. For example, the sidewall point cloud on Fig. 7 on the following page shows anomalous cur-vatures. Fig. 7 also provides ana posteriorijustification of our choice of implementing scanning positions every 5 meters, which allows truncating the model before the geometric effects become preeminent.
Another defect that may impair the geometry of the point cloud is an erroneous tilt angle assignment (Lesnikowski and Rush, 2012). This error is noticeable when vertical cross sections of TLS and MSS point clouds are compared (see Fig. 7). Indeed, in the sonar point cloud, sidewalls seem to lean inside the lock while they appear vertical in the TLS model. It would be possi-ble to post-process the data to compensate this effect. However, it was not done here because an accurate calibration of the tilt an-gle would require using the TLS point model, which would then deprive us of any reference for further quality assessments.
Figure 6. Rendering of a raw sonar output (from a single scanning position). 1: artifacts due to surface reflections (coloured in salmon). 2: acoustic anomalies in the water column acquisition. 3: acoustic phenomena due to signal backscattering. 4: acquisition anomaly probably due to a temporary blocking of the horizontal rotation system. 5: acquisition lack.
Figure 7. (a) Vertical and (b) horizontal cross-sections of the MSS (blue) and TLS (green) point clouds. Black dots show the sonar head position.
unexplained, have variable angular size, but they generally occur at the same horizontal acquisition angle. We note that similar lacks can be observed on Fig. 4.9, p. 74 in (Thomas, 2011).
4.2. Model assessment
In Sec. 4.1, we have reviewed the main artifacts that impair the raw MSS data and how they were (or were not) taken into account prior the registration was performed. The 3D model of the lock chamber, obtained using the methodology proposed in Sec 3 is shown on Fig. 8 on the next page. A quantitative assessment of this model is now presented. It is based on the distances between the MSS model and the reference TLS model. Since it is based on geo-referenced models (without extra adjustment), this evalu-ation concerns both the quality of the MSS data and the efficiency and robustness of the registration method.
The proposed study is essentially a cloud-to-mesh comparison. Such an approach is well suited to our application, since the lock
chamber is a topologically simple object, with smooth surfaces and almost no occlusions. In such conditions, the meshing pro-cess is rather straightforward. We use the 3DReshaperr soft-ware from Technodigit to obtain the reference mesh from the TLS point cloud. The cloud-to-mesh comparison is performed with CloudCompare, which uses an algorithm inspired from METRO (Cignoni et al., 1998). Since no reference is available for the floor of the lock, two separate evaluations are carried out, using the models of each sidewall.
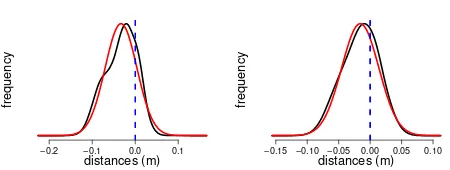
The results of these distance computations are summarized in Tab. 2. Positive distances correspond to vectors pointing inward the lock chamber (i.e. MSS points that are closest to the center of the canal than their TLS corresponding points). The histograms of Fig. 9) show that the distance distributions are close to the Gaussian. But, their mean is not null. This indicates the presence of a bias due to possible systematic errors.
Figure 10. Front view of distances between MSS cloud and TLS mesh for (top) the left sidewall and (bottom) the right sidewall
Figure 11. Front view of distances between TLS cloud, with1◦simulated tilt error, and TLS mesh for the left sidewall.
−0.2 −0.1 0.0 0.1 distances (m)
frequency
−0.15 −0.10 −0.05 0.00 0.05 0.10 distances (m)
frequency
Figure 9. Statistical distributions of (MSS) cloud to (TLS) mesh distances (black curve) with Gaussian fits (red curve) for (left) left sidewall and (right) right sidewall
left side right side
mean -3.3 -1.6
standard deviation 3.7 3.0
max 7.7 6.5
min -14.4 -10.6
Table 2. Analysis of distance distributions (in cm)
In-deed, the calibration of the tilt angle should be reconsidered. In order to verify this assumption, a simulation of a1◦tilt error has been done using TLS data. The spatial distribution of simulated distances, shown on Fig. 11 on the previous page is similar to the one obtained with MSS data (in particular for the left wall, where the narrowing error has less impact).
This study shows that the outcome distances range from -14.4 to 7.7 cm. The distance mean (considering both sidewalls simul-taneously) is -2.4 cm and the standard deviation 3.5 cm. These results might be enhanced by improving the registration method, or by correcting some effects (tilt offset) after calibration using the TLS model, or by refining the experimental setup (mechani-cal rotation system, position of the MSS) and performing a new survey.
4.3. Examining details
The third study is focused on the capacity to distinguish details on the structure in the MSS model. To this aim, we consider two parts of the lock chamber. The first one is located on the left sidewall. In this area, a rubber stone (approximative size: 60×20×10cm) is lacking and masonry joints are damaged (the grouting lacks are about 5 cm wide and deep). The corresponding part of the 3D MSS model built from upside-down scans (see Fig. 12) is extracted and meshed for visualization.
The second area is the lock threshold that has been acquired with the MSS placed on a tripod on the lock floor, nearly 5 m away from the target, in almost the same position as a previous TLS acquisition (see Fig. 13). In this area, a spall in the threshold creates a cavity (approximative size: 50×100×15cm) and joint damages are also visible. A meshing of this particular MSS model is also performed.
These examples visually demonstrate that important defects of the masonry, such as rubble stone lack or cavities can be detected in the MSS point cloud. Nevertheless, smaller details, such as damaged masonry joints, are harder to notice.
5. CONCLUSION
In this paper we have reported on the experimental assessment of a Mechanical Scanning Sonar, the BV5000, for 3D surveying in a canal lock. The proposed scanning methodology is based on several acquisitions from the surface, which allows a rough positioning of the scans. We introduced a geometric method for estimating the last missing angle and then, registering the scans to obtain a 3D model of the lock chamber. We proposed a quali-tative and quantiquali-tative assessment of the resulting 3D underwater point cloud, using a meshed model derived from TLS scans as a reference. This study allowed us to quantify the overall precision and level of detail that are accessible with this kind of technique. In particular, while the measuring performance of MSS are rather coarse, they can be appropriate for detecting defects of a decimet-ric size.
Our study also shed light on several possible optimizations, that could lead to improved performance. Firstly, to access a better level of detail, noise should be suppressed and precision should be enhanced. To this aim, modifications of the setup may be envisioned. For example, reducing the inter-scan distances and immersing the MSS a little deeper would lead to more favor-able sight distances and incidence angles. This would result in smaller footprint sizes and hence, in a better resolution. More-over, the noise level could be lowered by applying suitable sonar data denoising methods when processing the MSS raw outputs.
Figure 12. Front views of a piece of sidewall obtained from TLS (top) and MSS (bottom) scans taken upside-down from the water surface.
This work was funded by the Cerema under PhD Grant No. 64 and supported by the Cerema research program APHOGEOPHY funded by the General directorate for infrastructure, transport and the sea (DGITM, French Ministry of Ecology, Sustainable Devel-opment and Energy). The authors also thank Voies Navigables de France (VNF) for their support.
REFERENCES
Besl, P. and McKay, N. D., 1992. A method for registration of 3-D shapes.IEEE Transactions on Pattern Analysis and Machine Intelligence, 14(2), pp. 239–256.
Cignoni, P., Rocchini, C. and Scopigno, R., 1998. METRO: mea-suring error on simplified surfaces. Computer Graphics Forum, 17(2), pp. 167–174.
tructure first inspection supported by an integrated multibeam echosounder MBES/ LiDAR system. In: Proceedings of the CDA annual conference, Canadian Dam Association, Saskatoon, Canada.
Rondeau, M., Stoeffler, C., Brodie, D. and Holland, M., 2015. Deformation analysis of harbour and dam infrastructure using marine GIS. In:U.S. Hydro 2015 Conference, The Hydrographic Society of America (THSOA), Washington, DC, USA.