SEMI-AUTOMATIC BUILDING MODELS AND
FAÇADE TEXTURE MAPPING FROM MOBILE PHONE IMAGES
J. Jeong ,T. Kim
Dept. of Geoinformatic Engineering, Inha University, 100 Inharo, Namgu, Incheon, Korea [email protected]. [email protected]
Commission III, WG III/4
KEY WORDS: Building extraction, stereo matching, 3D reconstruction, rendering, texture mapping
ABSTRACT:
Research on 3D urban modelling has been actively carried out for a long time. Recently the need of 3D urban modelling research is increased rapidly due to improved geo-web services and popularized smart devices. Nowadays 3D urban models provided by, for example, Google Earth use aerial photos for 3D urban modelling but there are some limitations: immediate update for the change of building models is difficult, many buildings are without 3D model and texture, and large resources for maintaining and updating are inevitable.To resolve the limitations mentioned above, we propose a method for semi-automatic building modelling and façade texture mapping from mobile phone images and analyze the result of modelling with actual measurements. Our method consists of camera geometry estimation step, image matching step, and façade mapping step. Models generated from this method were compared with actual measurement value of real buildings. Ratios of edge length of models and measurements were compared. Result showed 5.8% average error of length ratio. Through this method, we could generate a simple building model with fine façade textures without expensive dedicated tools and dataset.
1. INTRODUCTION
3D urban modelling has been studied for long time in photogrammetry. It was used for various applications like urban planning, environment, construction and tourism. In these days demands are rapidly moving to may public fields.
According to these change some problems were occurred in current methodologies. Currently, urban modelling is heavily relying on photogrammetric mapping and needs long working time, highly qualified expert and expensive equipment. To overcome these weaknesses, many researches were carried out about 3D urban mapping. Suveg and Vosselman (2004) developed automatic urban modelling method with aerial photo and map and they reconstruct over 75% of building in photo and the accuracy of the reconstruction was good enough for mapping purpose. Schwalbe et al (2005) made automatic urban modelling method with aerial laser scanner data and 2D GIS data. They reconstruct 40~50% building in complex city, and reconstruct 100% building in new-built residential area. And Verma et al (2006) made automatic building detection and modelling from aerial LIDAR data.
These methods make precision building models automatically but some limitations remain. First, these still needs some expensive source data like aerial photos. This derives long update period and insufficient number of building models. And they do not have enough building façade texture despite that public’s needs are focused on façade information. Therefore, in this paper we propose a new semi-automatic method to make 3D urban model. Our goals are as follows.
1. Easy and low cost
2. Sufficient façade information 3. Appropriate visible quality
To achieve these goals, we have to select low cost source data which can get enough façade data and enough parameter
specification to apply photogrammetric theory. We also have to select proper modelling and processing algorithm.
We select smart phones which are commercialized widely and can achieve high resolution image easily. From our previous research (Ahn et al., 2014), photogrammetric possibility of smart phone images were verified.
We try to design our algorithm appropriate to the current specification of smartphones: their camera quality, processing power and orientation accuracy. We get a 3D point cloud with stereo matching algorithm developed in-house. We assume user input to define the boundary of building façade and confine building models as a simple cube model. Building models generated from this method will be compared with the actual length ratio of the real buildings.
2. METHODOLOGY
For modelling buildings from a smart phone camera, a user must take two images of a building of interest. A user needs to locate the camera so that each image contains a full view of two building facades. After this step, we design the algorithm as the following steps: camera geometry estimation, epipolar resampling, ROI input from a user, 3D point cloud generation, and 3D building modelling. Each will be explained below..
2.1 Camera geometry estimation
To estimate camera geometry between two images, we use relative orientation with Coplanarity constraint. As shown in Fig 1, this constraint states that two focal points of stereo images and tie points from each image constitute one plane on some model space.
We use SIFT algorithm which developed in computer vision, well known for feature extraction and feature matching algorithm, to generate tie points in stereo images. With (1) we
The International Archives of the Photogrammetry, Remote Sensing and Spatial Information Sciences, Volume XLI-B3, 2016 XXIII ISPRS Congress, 12–19 July 2016, Prague, Czech Republic
This contribution has been peer-reviewed.
can calculate relative x, y, z, w, p, k with linearized form of Coplanarity constraint by least square estimation.
Figure 1. Coplanarity constraints
We generate dense 3D point cloud’s coordinates with modified relaxation matching. Before matching, we eliminate Y parallax by epipolar resampling to find candidate point for matching easily. We adopt epipolar resampling based on the two rotations in (2).
Figure 2. Epipolar resampling rotations
T
With these processes, we can get a stereo image pair without Y-parallax.
2.3 Get ROI from user
As mentioned above, our model has a constraint of a simple cube shape. This constraint makes process efficiently. Related to this constraint, we get user input about model’s boundary in image to reduce our processing time. With this information we can make façade image for 3D model, limit relaxation matching bounds, and estimate building planes from 3D point clouds after matching. named as MDR (Multi-Dimensional Relaxation).
In this matching, we use a number (p in Fig 3) of patches with different sizes and shapes instead of one correlation patch. We calculate correlation value p times on every n candidates along an epipolar line. We accept a candidate as ‘match’ if the candidate has a largest number of patches with maximum correlation value.
Figure 3. MDR matching
So we calculate p*n times in every candidate. And it could make overhead in calculating. To cover this overhead, we adopt pyramid matching scheme in matching to reduce match processing time by constraint candidates’ boundary in small scale images. After match each candidates we calculate 3D point cloud’s model coordinates.
2.5 3D building modelling
To build 3D building model we estimate 3D planar equation for each façade defined from user’s input. We use 3D point clouds data generated from MDR for fitting 3D facade planes. We used the RANSAC algorithm to remove some outliers in match results.
We then adjust two fitted planes to a cube shape. This process is to overcome some boundary misalignment errors between the two planes and some angular errors. After that, we could make a cube model in the model space. At last we attach façade information which we got user’s ROI input. After these processes we still have some insufficient data about opposite sides of buildings. We handle this problem by simply attaching same façade on opposite sides.
The International Archives of the Photogrammetry, Remote Sensing and Spatial Information Sciences, Volume XLI-B3, 2016 XXIII ISPRS Congress, 12–19 July 2016, Prague, Czech Republic
This contribution has been peer-reviewed.
3. EXPERIMENTS
3.1 Experiments design
For experiments described in this paper, we took two stereo pairs, one for an artificial cube-shaped box in our laboratory and one for a real building in outdoor. We selected the first case to check distortion in the model generated from the proposed method with an ideal box shape. We selected the second to check the proposed method’s applicability in cost, information and visible quality’s aspect. The two cases are shown in Fig 4.
Figure 4. Artificial and Real buildings used in experiments
We implemented the while process as an Android application (‘The Builder’) and installed in a real smart phone. Fig 5 shows the display screen of the application. The left image is a UI of image gallery showing images taken from The Builder. The middle shows ROI region defined by a user. The right shows the result of 3D building model generated. The 3D model generated can be rendered by user.
Figure 5. 3D building modelling application UI
3.2 Results
First we calculated relative orientation parameters after automatic tiepoint generation. The results are summarized below. Since we estimate the orientation in a dimension-less, relative scale, we set Tx as 100.
Parameter Box Real Building
Tx 100 100
Ty -10.9448 0.7358
Tz 25.6546 -35.5194
Omega(rad) 0.03858 -0.01251
Phi(rad) 0.09986 0.04171
Kappa(rad) 0.05932 -0.00551
Table 1. Calculated relative orientation parameters
We generated epipolar resampled images with the calculated relative orientation parameters, as shown in the left and middle images in Fig 6. Additionally we transformed the ROI region
user provided within the original image onto the epipolar images (the right images in Fig 6).
Figure 6. Epipolar resampled stereo images and ROI
With these epipolar resampled images and ROI, we applied MDR and generated 3D point clouds, as shown in Fig 7.
Figure 7. 3D point clouds from MDR
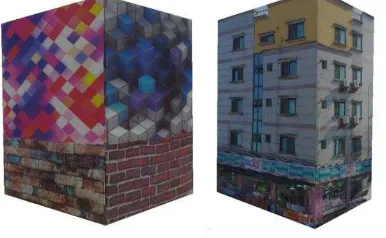
As we can see in Fig 7, we could get dense point clouds from mobile phone stereo images. After that, we applied the planar fitting process to fit each façade plane onto the model space. After these processes, we produce façade planes with 3D model coordinates and ROI regions with texture maps. By combining these planes as orthogonal condition, we could get semi-automatic 3D building models. These are shown in Fig 8.
Figure 8. Model extracted from stereo image
The International Archives of the Photogrammetry, Remote Sensing and Spatial Information Sciences, Volume XLI-B3, 2016 XXIII ISPRS Congress, 12–19 July 2016, Prague, Czech Republic
This contribution has been peer-reviewed.
To estimate the accuracy of the models generated by our method, we compared the ratio of our models’ length, width and height against the real ratio. Note that the 3D building models generated are only in the model space and that we cannot estimate the real dimension of buildings.
Box Ratio (X : Y : Z)
Model 0.74 : 0.82 : 1
Measurement 0.72 : 0.75 : 1
Error (%) 2.7 : 8.2 : 0
Building Ratio(X : Y : Z)
Model 0.50 : 0.74 : 1
Measurement 0.48 : 0.66 : 1
Error (%) 4.0 : 10.8 : 0
Table 2. Errors in length ratio
Table 2 shows the accuracy of our proposed method for the two cases. The accuracy of the box was better than that of the real building. In all cased, buildings with relative scale accuracy of 10% were achieved. In the two cases, we observe the accuracy degradation in Y scale. We are currently studying the cause of this degradation.
Qualitatively, using smartphone image and semi-automatic method we could generate building models easily and with low cost. The existing photogrammetric models are far more sophisticated. But the model generated here can have finer texture maps observable in street-level view point.
4. CONCLUSION AND FUTURE WORKS
By using our proposed method we could make 3D building model with easy and cheap way then the existing methods. And also we can get enough façade data from street view. And as we can see in Table 2, our models have small errors of 10% in length ratio.
For future research, we aim to achieve our two goals. First we will make more precise models, which do not have accuracy degradation in a particular direction, and more complicated models then a cube model, which have planes more than two. Second we will make the whole process in real-time. Currently we can generate the models within 2 minutes from user’s ROI input. We will optimize the whole process and minimize 3D point cloud density for proper planar fitting so that users may not notice delay due to processing.
REFERENCES
Suveg, Vosselman., 2004. Reconstruction of 3D building models from aerial images and maps. In: ISPRS Journal of Photogrammetry & Remote Sensing 58 , Vol.58, Issues 3-4, pp. 202-224.
Schwalbe, Maas, Seidel., 2005. 3D building model generation from airborne laser scanner data using 2D GIS data and orthogonal point cloud projections. In: ISPRS Workshop “Laser scanning 2005”, Enschede, the Netherlands, V/3, WG III/3, III/4, pp. 209-214
Verma, Kumar, Hsu., 2006. 3D building Detection and modeling from LIDAR data. In: 2006 IEEE Computer Society Conference on Computer Vision and Pattern Recognition(CVPR’06) Volume:2, pp. 2213-2220
H Ahn., 2006. 3D Accuracy analysis of mobile phone-based stereo images. In: Journal of Broadcast Engineering Volume:19, No 5, pp. 667-686
The International Archives of the Photogrammetry, Remote Sensing and Spatial Information Sciences, Volume XLI-B3, 2016 XXIII ISPRS Congress, 12–19 July 2016, Prague, Czech Republic
This contribution has been peer-reviewed.