LAND COVER CLASSIFICATION FROM FULL-WAVEFORM LIDAR DATA BASED
ON SUPPORT VECTOR MACHINES
M. Zhou a, *, C.R.LI a, L. Ma a, H.C. Guan a
a
Key Laboratory of Quantitative Remote Sensing Information Technology, Academy of Opto-electronics, Chinese Academy of Sciences, Beijing, China- (zhoumei, crli, malian) @aoe.ac.cn, guanhongcan14@ mails.ucas.ac.cn
Commission III, WG III/2
KEY WORDS: LiDAR, Support Vector Machines (SVM), Full-Waveform, Land Cover Classification, Waveform decomposition, Feature extraction
ABSTRACT:
In this study, a land cover classification method based on multi-class Support Vector Machines (SVM) is presented to predict the types of land cover in Miyun area. The obtained backscattered full-waveforms were processed following a workflow of waveform pre-processing, waveform decomposition and feature extraction. The extracted features, which consist of distance, intensity, Full Width at Half Maximum (FWHM) and back scattering cross-section, were corrected and used as attributes for training data to generate the SVM prediction model. The SVM prediction model was applied to predict the types of land cover in Miyun area as ground, trees, buildings and farmland. The classification results of these four types of land covers were obtained based on the ground truth information according to the CCD image data of Miyun area. It showed that the proposed classification algorithm achieved an overall classification accuracy of 90.63%. In order to better explain the SVM classification results, the classification results of SVM method were compared with that of Artificial Neural Networks (ANNs) method and it showed that SVM method could achieve better classification results.
* Corresponding author
1. INTRODUCTION
In the last decade, Light Detection And Ranging (LiDAR) has become an important source for acquisition of the 3D information of targets. It has been widely applied in many fields of remote sensing, such as, environment monitoring, disaster assessment, land cover classification. According to land cover classification, the traditional LiDAR usually uses 3D coordinates information of targets since it can only records several echoes and obtain limited information about the targets. Compared to the traditional LiDAR system, full-waveform LiDAR systems can record the entire backscattered waveform of the targets. The waveform features reflecting the properties of targets can be retrieved from the waveforms and are now extensively used for a large variety of land cover classification (Mallet and Bretar, 2009; Heinzel and Koch, 2011). This paper aims to study the land cover classification using full-waveform LiDAR data.
Some scholars have studied land cover classification based on full-waveform features. In 2008, Straub et al. presented a processing procedure for automated delineation and classification of forest and non-forest vegetation which was solely using full waveform laser scanner data as input. An overall accuracy of 97.73% was reached. However, only forest and non-forest vegetation were classified (Straub et al., 2008). In 2008, Reitberger et al. described an unsupervised species classification method based on features that were derived by waveform decomposition of full waveform LiDAR data. The classification grouped the data into two clusters (deciduous, coniferous), which leaded to an overall accuracy of 80 % in a leaf-on situation. The presented results clearly showed the
potential of full waveform data for the comprehensive analysis of tree structures (Reitberger et al., 2008). In 2010, various statistical waveforms parameters, such as standard deviation, skewness, kurtosis and amplitude were used as inputs to an unsupervised classification method, Kohonen's Self-Organizing Map (SOM), to separate vegetation (trees and grass) and non-vegetation (pavement and roof) surfaces. However, there was no quantitative evaluation of the classification results (Zaletnyik et al., 2010). These studies were based on the unsupervised classification methods, but the supervised classifiers were preferred since they offer a higher flexibility. In remote sensing field, Support vector machines (SVM), which is a supervised classifier, has been used for classification under different applications, multispectral measurements, DEM Generation from Aerial LiDAR Data, Synthetic Aperture Radar (SAR) images. Thus it has played a major role in classification problems (Yang and Lunetta, 2012). Some scholars have investigated the potential of full-waveform data for land cover classification using the SVM classification method. In 2009, Bretar showed that LiDAR amplitude and width contained enough discriminative information on bad lands to be classified in land, road, rock and vegetation. A 3-D land cover classification was performed by using a SVM classifier. However, the classification accuracy was only 79.1% when the amplitude, width and Digital Terrain Model (DTM) information were combined (Bretar et al., 2009). In 2011, Mallet et al. used a SVM classifier to label the point cloud according to various scenarios based on the rank of the features. The results showed that echo amplitude, cross section and backscatter coefficient significantly contributed to the high classification accuracies (around 95%). However, only three land cover types (building,
ground and vegetation) were classified. And adding redundant features in a same set prevented from concluding on the contribution of each feature (Mallet et al., 2011). In 2015, Tseng et al. combined LiDAR waveform data, orthoimage data and the spatial features of waveform data with SVM to classify the land cover point clouds. However, only by using fused waveform and orthoimage information, the highest overall accuracy could be achieved in land cover point clouds classification (Tseng et al., 2015).
In this paper, a classification method based on multi-class SVM using full waveform features, i.e. distance, intensity, FWHM and back scattering cross section was presented to predict the types of land cover in Miyun area as ground, trees, buildings and farmland, and the method was compared to ANNs. The remainder of this paper was organized as follows: In section 2, waveform processing methodology, including waveform decomposition, features extraction was introduced. Then multi-class SVM multi-classifier theory was presented. In section 3, the workflow of SVM classification method was introduced. Four land cover types in Miyun area were classified based on SVM and the results were compared to the ANNs in this part. The conclusions were given in section 4.
2. THEORY 2.1 Waveform processing methodology
Full-waveform LiDAR system records the entire backscattered waveform signal from targets, which is actually a sum of partial scattering response signals convolved with the scanner's system waveform. Thus it not only provides 3D point clouds, but also obtains abundant information of the targets. In the workflow of processing full waveform data, waveform decomposition is the most important step.
2.1.1 Waveform decomposition
The waveform decomposition includes these parts: pre-processing of waveform data, waveform decomposition, and components detection.
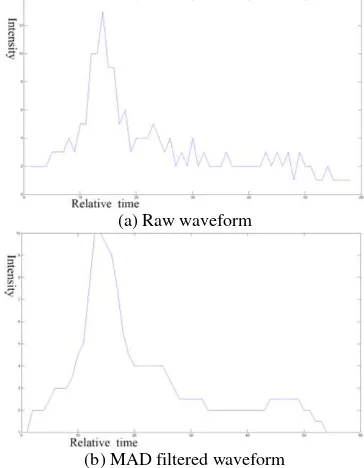
Before waveform decomposition, the noise of the waveforms needs to be removed. The widely used filtering methods include Wiener filter and Gaussian smoothing. However, the Wiener filter is very sensitive to noise (Jutzi and Stilla, 2006). For the Gaussian smoothing, it is difficult to select an appropriate kernel width for each echo pulse reflected from the complex terrain. By analysing the characteristics of the waveform intensity, Median Absolute Deviation (MAD) method was used for waveform filtering and had great effect on original waveform (Persson and Mallet, 2005). Figure 1 shows the raw waveform of an echo and the waveform filtered by MAD. It can be seen that MAD method has certain smooth effect on the raw echo waveform.
Since the transmitted laser pulse is modulated as Gaussian pulse, and the scattering of laser pulse for most targets can be approximated by a Gaussian reflection, so the backscattered waveform component can be modeled as a Gaussian function. Indeed, most waveforms can be very similar to an ideal Gaussian function whereas other laser impulse responses are slightly asymmetric. Consequently, it may not be an accurate representation that using a sum of Gaussians to approximate the waveforms which depends on the targets. Therefore, generalized Gaussian function was used for waveform modeling in this paper which could better represent the backscattered patterns from different targets. In this way, fitting of asymmetric, peaked
or flattened echoes located both in different areas could be waveform decomposition procedure, the loss of components severely constrains the performance of subsequent targets information extraction. Focusing on the problem above, an enhanced component detection algorithm, which combines Finite Mixed Method (FMM), Levenberg-Marquardt (LM ) algorithm and Penalized Minimum Matching Distance (PMMD) has been proposed (Zhou et al., 2013).
(a) Raw waveform
(b) MAD filtered waveform
Figure 1. Raw waveform and the filtered waveform
2.1.2 Waveform features extraction
The waveform features can be determined through the component parameters. In this paper, the extracted waveform features include distance, intensity, FWHM and back scattering cross section. The distance indicates the distance from laser transmitter to the target, which is determined by estimating the positin of the waveform component. Ideally the peak position is considered as component position and the time lag is used to calculate the distance (Mallet and Bretar, 2009). Intensity is a combination of emitted energy, distance, atmosphere attenuation and reflective capability of illuminated targets. In practice, the echo amplitude is most commonly regarded as intensity (Wagner et al., 2008). The FWHM denotes the extension of waveform in the incident direction, which is shown in Figure 2. It is closely related to the geometry of targets, terrain slope and targets material (Wagner et al., 2006). The backscattering cross section delineates the backscattering ability of the targets and is a comprehensive indicator of distance, intensity and FWHM (Wagner, 2010).
Some factors, such as angle of incidence, atmospheric, range, surface characteristics, etc., have influence on the waveform
features. Therefore, these features can hardly be used without radiometric calibration (Lehnera and Briesea, 2010). To reduce such influence and further improve the effectiveness of waveform features for land cover classification, this work has made a comprehensive correction over the extracted waveform features. The detailed methodology was introduced in published article (Zhou et al., 2015).
Figure 2. The diagram of intensity and FWHM
2.1.3 Classification capability analyse of waveform features
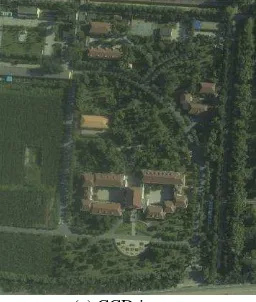
Then classification capability of the extracted waveform features for different land cover types was analyzed. The CCD image and pseudo color maps illustrating the values of extracted features, shown as Figure 3, were given and clearly illustrated the certain ability of each feature to distinguish different kinds of land cover types. Figure 3 (a) is the CCD image of the corresponding region. Figure 3 (b) representing distance, which directly indicate the relative elevation of full-waveform component, is generally applied to distinguish targets with different elevation, such as buildings and ground, farmland and trees. As illustrated in Figure 3 (c), the intensity implies the backscattering ability of targets on the laser pulse and is generally applied to distinguish targets with different reflectivity, such as farmland and ground, trees and buildings etc. Figure 3 (d) delineates FWHM signifying the extension on laser pulse in the incident direction for the targets is generally applied to distinguish targets with different surface morphology, such as ground and farmland. Figure 3 (e) is the backscattering cross section, which denotes the interception ability of the laser pulse for different targets, is the comprehensive reflection of component distance, intensity and FWHM. It has certain distinguish ability for targets with different height, reflectivity, and surface morphology. It can be concluded that the four waveform features have certain ability for classifying different land cover types.
(a) CCD image
(b) Distance
(c) Intensity
(d) FWHM
(e) Back scattering cross section
Figure 3. The CCD image and pseudo color maps according to the values of waveform features
2.2 Multi-class SVM Classifier
SVM is a supervised classifier. For supervised classification algorithm, classification usually involves separating data into two sets that are training and testing sets, respectively. Every instance in the training set comprises one "target value" (i.e. the class labels) and several "attributes" (i.e. the features or
observed variables). In this paper, the attributes are the extracted waveform features including distance, intensity, FWHM of the waveform and back scattering cross section, as described in Section 2.1.2. Based on the training data, the goal of SVM is to produce a model that predicts the target values (class labels) of the test data given only the test data attributes. In our experiments, the model was used to discriminate the four classes of interest: buildings, trees, farmland and ground. For SVM based binary-class classification, given a training set
of instance-label pairs (
x
i ,y
i), i=1, 2…l, where n following optimization problem (Chang and Lin, 2013):w,b, regarded as the penalty parameter of the error term. Due to the possible high dimensionality of the vector variable w, usually we solve the following dual problem:
1 two parameters C and γfor SVM using RBF kernel. In order to find the best C and γ for a given problem, parameter searching is required. A grid-search using cross validation is applied here. In x-fold cross-validation, the training set is divided into x subsets which have the same size. Sequentially x-1 data subset is used to train the model which can test the remaining one data subsets. Various pairs of (C, γ) values growing exponentially (grid-search) are tried and the one with the best cross-validation accuracy is selected to be the model.
SVMs are designed to solve binary problems. When having n
≥3 classes of interest, various approaches are possible to address the problem, usually combining a set of binary classifiers. In this paper, we use the "one-against-one" approach, in which classification a voting strategy, is used to determine the multi-classes: For each instance, k (k-1)/2 binary classifiers are invoked (k: number of classes), each classifier votes for one class, and the final label is taken to be the class with most votes(Hsu and Lin, 2002). In case that several classes have identical votes, though it was not a good strategy, we simply select the one with the smallest index.
3. EXPERIMENT AND ANALYSIS 3.1 Experiment data
The captured data of Miyun area, in Beijing, was used in this paper. The full-waveform LiDAR data was acquired by the LiteMapper 5600 airborne LiDAR system and CCD images were acquired by DigiCAM-H/22 Hasselblad. The experimental area of Miyun data set was about 14 km2, the flying height was about 700m, the average density of the point clouds was 4points/m2, and typical land covers were buildings, trees, farmland, ground, etc. In this paper, a piece of experimental area was selected to study the SVM classification using extracted waveform features. The size of the selected area was about 330m x 390m, containing about 338174 points. The CCD image of the selected area was shown in Figure 3 (a).
3.2 Experiment procedure
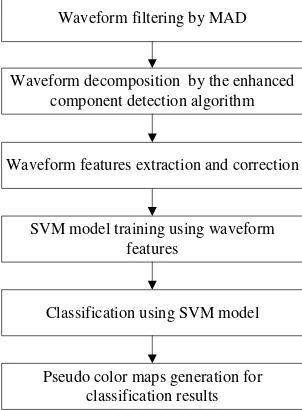
The flow chart of the experiment is shown in Figure 4. Firstly, the returned waveforms were filtered by MAD as mentioned above. Then waveforms were decomposed using the enhanced component detection algorithm. Features including distance, intensity, FWHM and back scattering cross section were extracted and corrected. These features would be the attributes of instance for denoting the waveform reflected from a type of land cover.
Secondly, multi-class SVM model was generated to classify the land cover types. Then the received waveforms reflected from typical land cover were divided into ground, trees, buildings and farmland. In this paper, 1000 features vectors for each typical land cover type were selected as the training data to generate SVM model according to the CCD image of the experiment region. Based on the SVM procedure mentioned in section 2.2, the selected data were trained for ten times, and the SVM model with highest cross-validation accuracy would be selected as the model to predict the land cover types of Miyun area. Finally, the pseudo color classification image depicting the values of land cover types of Miyun area was generated and the results were evaluated.
Waveform filtering by MAD
SVM model training using waveform features
Classification using SVM model
Pseudo color maps generation for classification results
Waveform decomposition by the enhanced component detection algorithm
Waveform features extraction and correction
Figure 4. Flow chart for land cover classification of Miyun area based on full-waveform LiDAR data
3.3 Experiment results
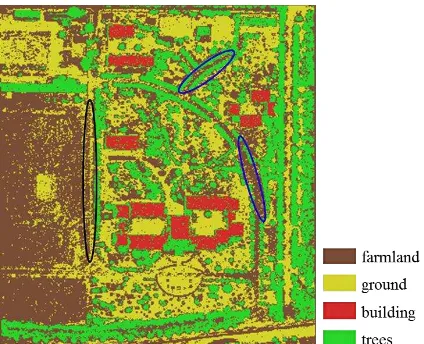
The classification result of Miyun area using corrected features based on the SVM method is given in Figure 5. The corresponding CCD image was shown in Figure 3 (a). The brown area, the yellow area, the red area and the green area respectively represent farmland, ground, building and trees. It can be seen that by using full-waveform features we can effectively distinguish different types of land cover. 5248 instances of these four land cover types, except the training data, were selected to calculate the classification accuracy, as shown in Table 1. The ground truth information was acquired manually according to CCD image data of the experiment region. The confusion matrix for the classification results of these four land cover types of Miyun area was obtained and shown in Table 1. The overall classification accuracy using corrected features reached 90.63% and the classification Kappa was 0.8741.
Figure 5. Land cover classification results of Miyun area based on SVM method
Truth
C Classification Buildings Ground Trees Farmland Total
Buildings 1106 0 28 0 1134
Ground 10 1437 78 153 1678
Trees 94 12 937 0 1043
Farmland 33 36 48 1276 1393
Total 1243 1485 1091 1429 5248
Table 1. Confusion matrix of the classification results based on SVM method
In this paper, SVM classification method was used. In order to better interpret the SVM classification results, nonlinear Artificial Neural Networks (ANNs) was also applied to classify the land cover types in Miyun area, and the classification results of these two methods were compared. ANNs imitate the brain‟s model of an interconnected system of neurons, enabling computers to detect patterns and to learn complex relationships within data (Anderson, 1995). Usually, ANNs basically provide a „black box‟ model. ANNs used in this paper consisted of a single hidden layer and was trained for 500 cycles by back propagation with a learning rate of 0.2. The classification result is shown in Figure 6, the brown area, the yellow area, the red area and the green area respectively represent farmland, ground, buildings and trees. The confusion matrix for the classification results was obtained and shown in Table 2. The overall classification accuracy reached 87.69% and the classification Kappa was 0.8349.
Figure 6. Land cover classification results of Miyun area based on ANNs method
Truth
C Classification Buildings Ground Trees Farmland Total
Buildings 1097 0 22 0 1119
Ground 0 1242 5 92 1339
Trees 135 1 926 0 1062
Farmland 11 242 138 1337 1728
Total 1243 1485 1091 1429 5248
Table 2. Confusion matrix of the classification results based on ANNs method
3.4 Analysis
The overall classification accuracy using SVM method was 90.63%, while it was 87.69% by using ANNs. It can be seen that SVM classification method can indeed produce higher accuracy. From Figure 5 and Figure 6, we can see that some area on the left side of the Figure was “ground” in fact; however it was classified to be “farmland” by ANNs, as the black ellipse shows. Some areas on the right side of the Figure were
“ground” in fact; however it was also classified to be
“farmland” by ANNs, as the blue ellipses show. Additionally, the most confusion in prediction by SVM method was between
“building” and “tree”, “farmland” and “ground”, as shown in the fourth row and the second column, and the third row and the fifth column in Table 1. This was possibly resulted from the similar distance of “building” and “tree”, “farmland” and
“ground”. Prediction errors were also generated from “tree” and
“farmland”, as shown in the fifth row and the fourth column in Table 1, which was because “tree” and “farmland” had similar properties.
4. CONCLUSIONS
In this paper, the returned waveforms were filtered by MAD and waveform decomposition was implemented using the enhanced component detection algorithm. Then waveform features including distance, intensity, FWHM and back scattering cross section were extracted and corrected. The classification ability of corrected features was also clearly analysed. Multi-class SVM model was generated to classify the types of land cover in Miyun area as ground, trees, buildings and farmland. Classification results showed that the classification accuracy reached 90.63% and the classification Kappa was 0.8741. Furthermore, the SVM classification was compared to classical ANNs, and it showed that SVM method could achieve better classification results.
In future work, the further improvement in land cover classification may be achieved by using more waveform features. The weight of the features will be studied.
ACKNOWLEDGEMENTS
The work is supported by the National High Technology Research and Development Program (863Program) (Grant No.2015AA123801) and National Natural Science Foundation of China (Grant No. 40901177).
REFERENCES
Anderson, J.A., 1995. An Introduction to Neural Networks. MIT Press, Cambridge, MA.
Bretar, F., Chauve, A., Bailly, J. S., Mallet, C., Jacome, A., 2009. Terrain surfaces and 3-d land cover classification from small footprint full-waveform lidar data: application to badlands. Hydrology & Earth System Sciences Discussions, 13(8), pp. 1531-1544.
Chang, C., and Lin, C., 2013. “LIBSVM: a Library for Support Vector Machines”, http://www.csie.ntu.edu.tw/~cjlin/papers/ libsvm. pdf
Chauve, A., Mallet, C., Bretar, F., Durrieu, S., Deseilligny, M.P., Puech, W., 2007. Processing full-waveform lidar data: modeling raw signals. International archives of photogrammetry, remote sensing and spatial information sciences , Espoo, Finland, pp.102-107.
Chehata, N., Li, G., Mallet, C., 2009. Airborne lidar feature selection for urban classification using random forests. Geomatics & Information Science of Wuhan University, 38, pp. 207-212.
Heinzel, J., Koch, B., 2011. Exploring full-waveform lidar parameters for tree species classification. International Journal of Applied Earth Observation & Geoinformation, 13(1), pp.152-160.
Hsu, C., Lin, C., 2002. A comparison of methods for multiclass support vector machines. IEEE Trans.Neural Networks, 13(2), pp.415-425.
Jutzi, B., Stilla, U., 2006, Range determination with waveform recording laser systems using a Wiener Filter. Isprs Journal of Photogrammetry & Remote Sensing, 61(2), pp.95-107.
Lehnera, H., Briesea, C., 2010. Radiometric calibration of full-waveform airborne laser scanning data based on natural surfaces. Years Isprs Advancing Remote Sensingence Pt, 38(1), pp.360-365.
Mallet, C., Bretar, F., 2009. Full-waveform topographic lidar: state-of-the-art. Isprs Journal of Photogrammetry & Remote Sensing, 64(6), pp.1–16.
Mallet, C., Bretar, F., Roux, M., Soergel, U., Heipke, C., 2011. Relevance assessment of full-waveform lidar data for urban area classification. Isprs Journal of Photogrammetry & Remote Sensing, 66(6), pp.S71–S84.
Persson, A., Mallet, C., 2005. Visualization and Analysis of Full-Waveform Airborne Laser Scanner Data. Remote Sensing and Spatial Information Sciences, 36(Part 3/W19), pp.103-108.
Reitberger, J., Krzystek, P., Stilla, U., 2008. Analysis of full waveform lidar data for tree species classification. Photogrammetrie–fernerkundung–geoinformation, 74(5), pp. 337-349.
Straub, C., Weinacker, H., Koch, B., 2008. A Fully Automated Procedure for Delineation and Classification of Forest and Non-Forest Vegetation Based on Full Waveform Laser Scanner Data. In International Archives of the Photogrammetry, Remote Sensing and Spatial Information Sciences; ISPRS: Vienna, Austria, 37, pp. 1013-1019.
Tseng, Y.H., Wang, C.K., Chu, H.J., Hung, Y.C., 2015. Waveform-based point cloud classification in land-cover identification. International Journal of Applied Earth Observation and Geoinformation, 34(1), pp.78-88.
Wagner, W., 2010. Radiometric calibration of small-footprint full-waveform airborne laser scanner measurements: basic physical concepts. Isprs Journal of Photogrammetry & Remote Sensing, 65(6), pp.505-513.
Wagner, W., Hyyppä, J., Ullrich, A., et al., 2008b. Radiometric calibration of full-waveform small-footprint airborne laser scanners. International Archives of Photogrammetry, Remote Sensing and Spatial Information Sciences, 37 (Part 1), pp.163– 168.
Wagner, W., Ullrich, A., Ducic, V., Melzer, T., Studnicka, N., 2006. Gaussian decomposition and calibration of a novel small footprint full-waveform digitising airborne laser scanner. Isprs Journal of Photogrammetry & Remote Sensing, 60(2), pp.100-112.
Yang, S., Lunetta, R. S., 2012. Comparison of support vector machine, neural network, and cart algorithms for the land-cover classification using limited training data points. Isprs Journal of Photogrammetry & Remote Sensing, 70, pp.78-87.
Zaletnyik, P., Laky, S., Toth, C., 2010. Lidar waveform classification using Self-organizing map. ASPRS 2010 Annual Conference.
Zhou, M., Liu, M., Zhang, Z., Ma, L., Zhang, H., 2015. The research of land covers classification based on waveform features correction of full-waveform LiDAR. SPIE Remote Sensing. International Society for Optics and Photonics, Toulouse, France, 2015.96431P-1.
Zhou, M., Liu, M., Zhang, Z., Wang.J, 2013. Enhanced Component Detection Algorithm of Full-Waveform LiDAR Data. International Archives of the Photogrammetry, ISPRS Hannover Workshop, 2013, V. XL-1/W1, 389-392.