MONITORING PHENOLOGY OF FLOODPLAIN GRASSLAND AND HERBACEOUS
VEGETATION WITH UAV IMAGERY
W.K. van Iersela*, M.W. Straatsmaa, E.A. Addinka, H. Middelkoopa a
Utrecht University, Department of Physical Geography, Faculty of Geosciences, Heidelberglaan 2, 3584 CS Utrecht, the Netherlands - ([email protected])
KEY WORDS: river floodplains, vegetation height, land cover, multi-temporal data, aerial photography, UAV, DSM
ABSTRACT:
River restoration projects, which aim at improved flood safety and increased ecological value, have resulted in more heterogeneous vegetation. However, they also resulted in increasing hydraulic roughness, which leads to higher flood water levels during peak discharges. Due to allowance of vegetation development and succession, both ecological and hydraulic characteristics of the floodplain change more rapidly over time. Monitoring of floodplain vegetation has become essential to document and evaluate the changing floodplain characteristics and associated functioning. Extraction of characteristics of low vegetation using single-epoch remote sensing data, however, remains challenging. The aim of this study was to (1) evaluate the performance of multi-temporal, high-spatial-resolution UAV imagery for extracting temporal vegetation height profiles of grassland and herbaceous vegetation in floodplains and (2) to assess the relation between height development and NDVI changes. Vegetation height was measured six times during one year in 28 field plots within a single floodplain. UAV true-colour and false-colour imagery of the floodplain were recorded coincidently with each field survey. We found that: (1) the vertical accuracy of UAV normalized digital surface models (nDSMs) is sufficiently high to obtain temporal height profiles of low vegetation over a growing season, (2) vegetation height can be estimated from the time series of nDSMs, with the highest accuracy found for combined imagery from February and November (RMSE = 29-42 cm ), (3) temporal relations between NDVI and observed vegetation height show different hysteresis behaviour for grassland and herbaceous vegetation. These results show the high potential of using UAV imagery for increasing grassland and herbaceous vegetation classification accuracy.
1. INTRODUCTION
River floodplains are be used for different - often spatially conflicting - purposes, such as water conveyance and storage during peak discharge, nature development, agricultural practices and recreation. Restoration projects of floodplain ecology have resulted in a more natural and heterogeneous floodplain vegetation (Göthe et al., 2015). These have enhanced ecological value and biodiversity of the floodplains, but developing natural vegetation also results in increasing hydraulic roughness, which lowers the conveyance capacity and increases flood risk. Moreover, due to vegetation development and succession, both ecological and hydraulic characteristics of the floodplain change more rapidly over time. To document and evaluate these floodplain characteristics, monitoring of floodplain vegetation has become essential. However, reported land cover classifications showed low accuracies for grassland and herbaceous vegetation, due to the spectral and structural similarity of these vegetation types (Geerling et al., 2007; Straatsma et al. 2008, Knotters and Brus, 2013).
Until now vegetation classification based on remote
sensing data has mainly been performed with datasets collected at a single moment (Xie et al., 2008). The increased availability of Unmanned Aerial Vehicles (UAV) allows low-cost production of high-resolution orthophotos and digital surface models (DSMs). Multi-temporal imagery may reveal new possibilities to identify vegetation-type specific seasonal or year-to-year changes, and may be used as input for improving classification methods.
From false colour imagery live vegetation can be observed, often by calculating the Normalized Difference Vegetation Index (NDVI). Vegetation health, and therefore NDVI, and vegetation height are expected to behave differently over a growing season. During spring, when the vegetation height is not yet at its maximum, NDVI may already be near its maximum value. During the end of summer and autumn the NDVI is expected to decrease due to senescence of the vegetation, while vegetation most likely will maintain its height until its becomes damaged by wind, water or fauna during late autumn or winter.
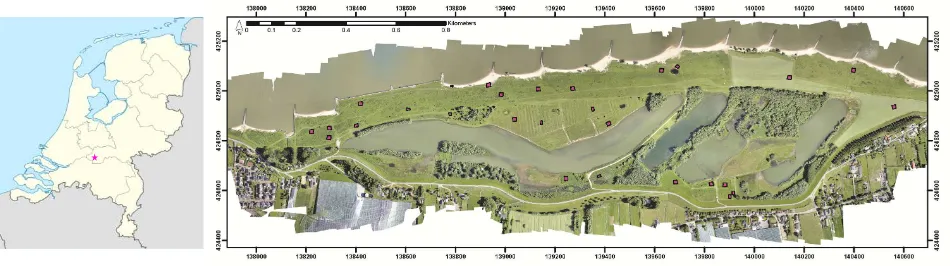
Figure 1. Location of study area in the Netherlands (left). Orthophoto of Breemwaard in June with fieldplots in magenta (right).
The International Archives of the Photogrammetry, Remote Sensing and Spatial Information Sciences, Volume XLI-B7, 2016 XXIII ISPRS Congress, 12–19 July 2016, Prague, Czech Republic
This contribution has been peer-reviewed.
The aim of this study was to (1) evaluate the performance of multi-temporal, high-spatial-resolution UAV imagery for extracting temporal vegetation height profiles of grassland and herbaceous vegetation in floodplains and (2) to assess their relation with NDVI changes during the year.
2. STUDY AREA
We studied the Breemwaard floodplain, sized 116 ha, in the Netherlands. Approximately 30% of the area is used as hayfield and is mown several times per year. Several parts of the floodplain are managed privately and are used for grazing ponies, as willow fields, or as reed fields. The remaining part is a nature area that is managed by the state forestry and grazed by cows and ponies. The areas fenced off for cattle within the nature area have developed into riparian woodland. This variability in management of the area has resulted in heterogeneous vegetation types and structure, which made it ideal for classification experiments of riparian vegetation.
3. METHODS
Within the area, 28 field plots (15x15m2) with different types and structures of low vegetation were selected. During field surveys, average height (Hv,observed) and density (Dv) of the vegetation in the plots were measured six times, at time intervals of six to ten weeks. During each field survey, the entire study area was recorded with true-colour and false-colour imagery at 5-cm resolution from a UAV. The UAV images were used to create a point cloud DSM of the study area for each survey using the Structure-from-Motion (SfM) method (Lucieer et al., 2014). True colour DSMs were used to derive the predicted vegetation height (Hv,predicted). The false colour DSMs were used to derive the Normalized Difference Vegetation Index (NDVI) with the near-infrared and blue band. For each plot, we compared Hv,observed with the following plot level statistics: the 95th percentile from the normalized DSMs (nDSM), and the average NDVI value. To determine the height of the vegetation above the terrain from the imagery, we normalized the DSM of each survey with the DSM of February 2015. Thereby, we implicitly assumed that the February DSM represents the Digital Terrain Model (DTM), which is reasonable for herbaceous vegetation in leaf-off conditions. The DTM of February was denoised by gridding the initial point cloud obtained from the SfM preprocessing to a 0.2 m resolution grid. Average spacing of the initial point cloud was 0.08 m.
4. RESULTS AND DISCUSSION
4.1 Vegetation height and NDVI over time
The results show that the temporal trend for Hv,predicted and NDVI value over the growing season is similar to the trend observed in the field. An example can be seen for a grassland and herbaceous plot in figure 2. Hv,predicted of the herbaceous vegetation in plot 20 (p20) is closely following Hv,observed between April and September, but afterwards starts to be underpredicted (November and February). This decline in prediction accuracy coincides with a decrease in NDVI. The observed behaviour for herbaceous vegetation is not visible in grassland vegetation. Remarkably, the over-prediction of Hv,observed in plot 4 (p4) in September coincides with its peak in NDVI.
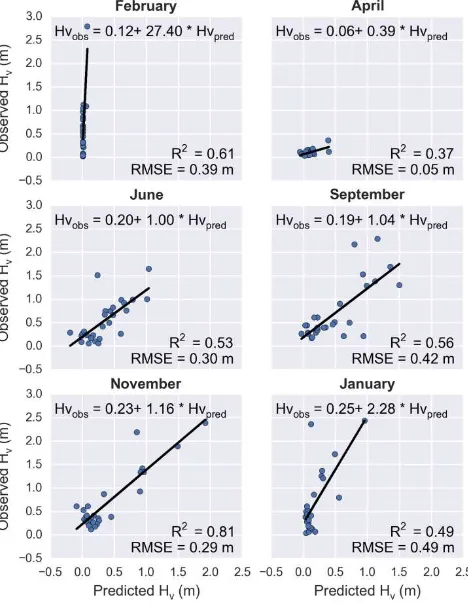
4.2 Linear regression
The linear regression between the Hv,observed and the Hv,predcited shows large variations in accuracy for the six different surveys (figure 3). The Hv,predicted for February was close to zero, because the February DSM was also used to create the February nDSM. The slopes of the regression functions for June, September and November are close to one. This confirms the vertical accuracy of UAV remotely-sensed nDSMs is high enough to obtain temporal height profiles of the low vegetation during leaf-on conditions. During leaf-off conditions in February, April and January, however, the height of upper vegetation layer can often not be derived from the UAV imagery and is underestimated, most likely due to low leaf area of the vegetation in these months.
Figure 2. Time series of a grassland plot 4 and herbaceous plot 20 indicated on the orthophoto in figure 1.
Figure 3. Linear regression of predicted H
v and observed Hv for each timestep.
The International Archives of the Photogrammetry, Remote Sensing and Spatial Information Sciences, Volume XLI-B7, 2016 XXIII ISPRS Congress, 12–19 July 2016, Prague, Czech Republic
This contribution has been peer-reviewed.
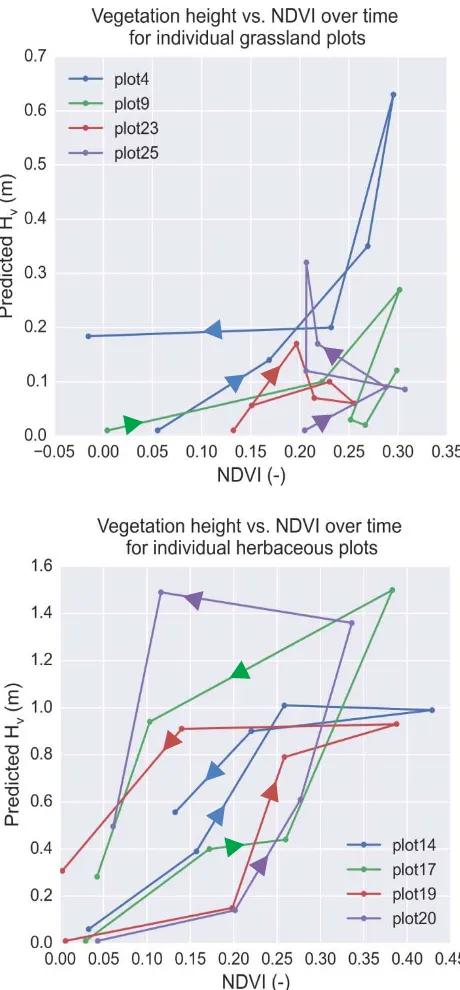
4.3 Hysteresis in NDVI and vegetation height
The hysteresis described in the introduction can be observed from figure 4. Note that the y-axis is Hv,observed to exclude prediction errors in height. For grassland the increase in NDVI clearly precedes the increase in height, but the decrease in height takes place simultaneously with the decrease in NDVI. For herbaceous vegetation, the first phase is the decrease in height due the shift from high senescent vegetation to low new vegetation accompanied by an increase in NDVI. In most plots, the subsequent increase in height and NDVI takes until September. The final phase shows an overall decrease in NDVI, while the vegetation height remains at almost its maximum value.
5. DISCUSSION AND CONCLUSIONS
The normalisation with the February DSM likely introduces some errors, because in winter there is still senescent vegetation present, which obstructs the observation of the actual ground surface. To estimate this error the February 2015 DSM can be normalized with the digital elevation model (DEM) of February 2015 obtained with LiDAR. This will be studied in the near future. We conclude:
• Vertical accuracy of UAV remotely sensed nDSMs is high enough to obtain temporal height profiles of low vegetation over the growing season.
• Observed vegetation height can be determined from the nDSM derived vegetation height in leaf-on conditions via linear regression (R2 = 0.53-0.81, RSME = 29-42 cm).
• The NDVI and observed vegetation height show hysteresis for herbaceous vegetation, but no clear hysteresis for grassland vegetation.
• These results showed high potential for increasing the classification accuracy of low floodplain vegetation.
ACKNOWLEDGEMENTS
This study was conducted as part of the RiverCare program funded by STW, project number: 13518. In addition, the authors would like to thank the state forestry (Staatsbosbeheer) for its permission to fly with the UAV in the area.
REFERENCES
Göthe, E., Timmermann, A., Januschke, K. & Baattrup-Pedersen, A. (2015). Structural and functional responses of floodplain vegetation to stream ecosystem restoration. Hydrobiologia, 769(1), pp. 1-14
Xie, Y., Sha, Z. & Yu, M. (2008). Remote sensing imagery in vegetation mapping: a review. Journal of plant ecology, 1(1), pp. 9-23.
Geerling, G. W., Labrador‐Garcia, M., Clevers, J. G. P. W., Ragas, A. M. J. & Smits, A. J. M. (2007). Classification of floodplain vegetation by data fusion of spectral (CASI) and LiDAR data. International Journal of Remote Sensing, 28(19), pp. 4263-4284.
Lucieer, A., De Jong, S. M. & Turner, D. (2014). Mapping landslide displacements using Structure from Motion (SfM) and image correlation of multi-temporal UAV photography. Progress in Physical Geography, 38, pp. 97–116
Figure 4. Hysteresis of H
v,predicted and NDVI for grassland (top) and herbaceous (bottom) vegetation. Each graph starts in February 2015 and ends in January 2016, arrows indicate direction of time.
The International Archives of the Photogrammetry, Remote Sensing and Spatial Information Sciences, Volume XLI-B7, 2016 XXIII ISPRS Congress, 12–19 July 2016, Prague, Czech Republic
This contribution has been peer-reviewed.