Estimating legume N
2
fixation in grass-clover mixtures of a grazed
organic cropping system using two
15
N methods
Finn P. Vinther
a,∗, Erik S. Jensen
1 baDanish Institute of Agricultural Sciences, Department of Soil Science and Plant Physiology, Research Centre Foulum, P.O. Box 50,
DK-8830 Tjele, Denmark
bPlant Ecosystems and Nutrient Cycling, Plant Biology and Biogeochemistry, Risø National Laboratory, DK-4000 Roskilde, Denmark
Received 14 January 1999; received in revised form 3 June 1999; accepted 17 August 1999
Abstract
The input of Nitrogen (N) through symbiotic N2fixation (SNF) in grass-clover mixtures was determined in an organic
cropping system for grazing during 3 years. The mixture of perennial ryegrass (Lolium perenne L.) and white clover (Trifolium
repens L.) was established by undersowing in spring barley (Hordeum vulgare L.) and maintained subsequently for two
production years. Dinitrogen fixation was determined using the15N isotope dilution techniques and two labelling procedures. Using either pre-labelling of the soil with immobilisation of the15N by addition of a carbon source before establishment of
the grass-clover mixture or adding the15N labelled ammonium to the established crop, resulted in similar estimates of the proportion of N derived from the atmosphere (pNdfa). However, the average coefficient of variance of the pNdfa values was significantly lower with the pre-labelling immobilisation method. The proportion of fixed N in the clover varied between 0.70 and 0.99 with the lowest values in the beginning and at the end of the growing season. The total amount of N fixed in the above-ground plant parts of the grass-clover mixture varied between 10.0 and 23.5 g N m−2per year. The total input from
N2fixation in the rotation was between 30 and 50 g N m−2per year (above-ground plant parts only). This variation could be
ascribed to differences in climatic conditions during the 3 years. The amount of N in grass-clover residues incorporated in the soil after the second production year ranged between 19.6 and 29.6 g N m−2, of which 52–66% was estimated to be derived from fixation. The amount of atmospherically derived N actually entering the soil in the grazed cropping system is discussed. ©2000 Published by Elsevier Science B.V. All rights reserved.
Keywords: Dinitrogen fixation;15N isotope dilution; Ryegrass-clover mixtures;15N immobilisation method; Denmark
1. Introduction
Symbiotic N2 fixation (SNF) in legumes is a
fun-damental process for maintaining soil fertility and the
∗Corresponding author. Tel.:+45-89991861; fax:+45-89991619.
E-mail address: [email protected] (F.P. Vinther).
1Present address. Agroecology, Department of Agricultural
Sci-ences, Royal Veterinary and Agricultural University, DK-2630 Taastrup, Denmark
continued productivity of organic cropping systems. The amount of N2 fixed and the N contribution from
leguminous crops are influenced by a number of envi-ronmental factors, including soil type, nutritional sta-tus of soil, species and varieties, water availability and temperature as well as soil and crop management (Ledgard and Steele, 1992; Jensen et al., 1997). The complex interactions among these factors need further study to achieve predictable and sustainable outcomes from the crops in organic farming systems.
Estimates of SNF are influenced by the method of measurement used. The soil is typically labelled with
15N by adding labelled nitrate or ammonium to the
standing crop grass-clover crop. Inaccuracies in 15N isotope dilution estimates arise from poor matching of reference and legume crop, coupled with the decline in15N enrichments of plant available soil N (Witty, 1983; Witty and Ritz, 1984; Giller and Witty, 1987). Stabilising the 15N enrichment of the plant available N over time could potentially contribute to improved estimates of fixation.
The primary objective of this work was to esti-mate the input of symbiotically fixed N2 into an
or-ganic cropping system via a grass-clover mixture and to evaluate its importance for the N supply of crops in the rotation. The study included an evaluation of
15N isotope dilution methods for estimating SNF in
grass-clover mixtures.
2. Materials and methods
2.1. Soil and cropping system
The experiment was carried out at the experimental farm Foulumgaard at Research Centre Foulum in Den-mark (9◦35′E; 56◦30′N). The soil is a sandy loam with
7.5% clay (<2mm), 9.5% silt (2–20mm), 45.5% fine sand (20–200mm), and 34.5% coarse sand (>200mm), 1.6% total C, 0.14% total N, and pH(CaCl2) of 5.6.
The cropping system was a 6 year crop rotation with fodder beets (Betae vulgaris L. cv. ‘Magnum’), spring barley (Hordeum vulgare L. cv. mix. ‘Alexis’, ‘Ariel’, ‘Lenka’ and ‘Etna’) undersown with a mix-ture of perennial ryegrass (Lolium perenne L. cv. mix. ‘Sisu’, ‘Merlinda’, ‘Borvi’ and ‘Tivoli’) and white clover (Trifolium repens L. cv. ‘Milkanova’), first year grass-clover, second year grass-clover, barley and pea (Pisum sativum L. var Odin) in mixture, and winter wheat (Triticum aestivum L. var. Obelisk). The 1- and 2-year grass-clover fields were grazed by young cattle at a stocking rate of 10–12 animals ha−1. Each year
one cut for silage was removed before cattle-grazing. The undersown grass-clover mixture was grazed dur-ing the autumn after harvest of the barley crop. Plots for SNF measurements were placed in an area of the fields excluded from cattle grazing.
The crop rotation was established in 1986 and has been managed according to the principles for organic
farming, which implies that pesticides and industrially synthesised fertilizers have not been used over a 10 years period. Nitrogen and other nutrients are applied in farmyard manure or slurry and in deep litter. Two levels of animal manure were used: 0.8 and 1.2 animal units (a.u.). The only N2fixing crop that received
ma-nure was grass-clover undersown to barley. Shortly be-fore sowing, animal manure and deep litter was applied and incorporated into the soil in amounts correspond-ing to approximately 150 and 225 kg total N ha−1for
the two fertilisation levels, respectively. The experi-mental fields were irrigated at a water deficit corre-sponding to 60% of plant available water. In 1994, 1995, and 1996 barley with undersown grass-clover re-ceived 80, 70, and 40 mm, and the first and the second year grass-clover 135, 97, and 96 mm, respectively.
2.2. Methods of15N labelling for determination of
N2fixation
Two methods for15N labelling of the soil were used for determining N2fixation in the grass-clover mixture
from 1994 to 1996. In 1994 plots of 1 m2were estab-lished for15N labelling the standing crops of 1 and 2 year perennial ryegrass-clover mixtures. On 20 April, the plots were supplied with 1 g N m−2as ammonium
sulphate [(15NH4)2SO4] with 3 at.%15N excess. The
plots with undersown ryegrass-white clover mixture were labelled by applying15N together with sucrose in order to immobilise the15N to obtain a more stable
15N enrichment of the soil N pool over time, arising
from remineralisation of immobilised15N. Also on 20 April, two days after sowing grass-white clover un-dersown to barley, plots of 1 m2 were established to which 1.5 g N m−2was applied as (15NH4)2SO4with
30 at.%15N excess together with 15 g sucrose-C m−2 solution distributed evenly over the entire micro-plot area. In 1995 labelled plots were prepared in a sim-ilar way, but ammonium sulphate with 6.2 at.% 15N excess solution was also applied to swards of one and 2-year ryegrass-white clover.
In 1995 the ryegrass-white clover undersown in bar-ley was labelled as in 1994 (30 at.% (15NH4)2SO4+
sucrose). In 1996 the 1-year ryegrass-white clover sward was labelled with 6.2 at.%15N excess.
growing seasons to a height of 2–3 cm above soil surface, separated into grass and clover, and dried at 80◦C overnight.
2.3. Nitrogen incorporated into the soil
Shortly before the second year grass-clover sward was ploughed under in the spring of 1995, 1996 and 1997, samples were taken for determination of dry matter and total N. Four turves from each of the two animal manure treatments were taken. Each turf mea-sured 20 cm×20 cm and included soil to approxi-mately 20 cm depth.
Soil was washed from the turves, which were then separated into above-ground plant material and roots. It was not possible to separate grass and clover roots. The dry matter production and total N content was determined by elemental analysis after drying the fractions at 80◦C overnight.
2.4. Analysis and calculations
SNF was determined using the 15N isotope dilu-tion method with ryegrass from the grass-clover mix-ture as the reference plant. The content of total N and
15N in the dried plant material was determined on a
N-analyzer coupled online to an isotope ratio mass spectrometer (Carlo Erba-Finnigan) as described by Jensen (1991). The15N natural abundance of the soil was 0.3663 at. 15N and this value was used for cor-recting the15N abundance of plant samples for back-ground. The proportion of N derived from the atmo-sphere was calculated using the following equation (Fried and Middelboe, 1977):
The amount of N2 fixation was estimated as
SNF=total clover N×pNdfa.
Analysis of variance was carried out using the GLM procedure in SAS (SAS Institute, 1989). Least signif-icant difference (LSD) was used to compare means, when differences were found to be significant at the
P=0.05 level.
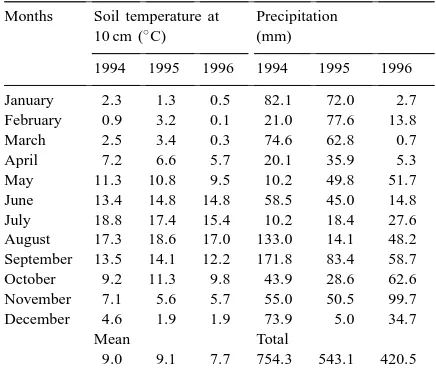
Table 1
Soil temperature and precipitation during the 3 years of the inves-tigation
Months Soil temperature at Precipitation 10 cm (◦C) (mm)
1994 1995 1996 1994 1995 1996 January 2.3 1.3 0.5 82.1 72.0 2.7
The 3 years of investigation varied considerably with respect to both soil temperature and precipitation (Table 1). The average soil temperature was 1.3–1.4◦C
lower in 1996 than in the previous 2 years. The lower average temperature in 1996 was primarily because of a cold spring with monthly temperatures 1–3◦C lower than in 1994 and 1995. The total precipitation as well as the distribution differed significantly among the 3 years of investigation. The total precipitation in 1996 comprised only 56% of that in 1994, and in 1996 nearly 25% of the total precipitation fell in the month of November, whereas nearly 50% of the total precip-itation in 1994 fell during the months of August and September. Furthermore, the first 4 months of 1996 were very dry. During these 4 months, the accumu-lated precipitation was 22.5 mm compared with 198.3 and 248.3 mm during the same periods of 1994 and 1995, respectively.
3.2. Effects of manure application
(P-value) ranged from 0.23 to 0.45. As a consequence, the results from these two treatments were pooled at each harvest.
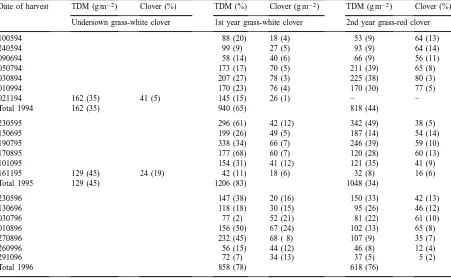
3.3. Dry matter production of grass-clover mixtures
The total dry matter (TDM) production varied considerably during the 3 years of investigation. The annual dry matter production ranged from 618 to 1206 g m−2and it was greatest in 1995 (Table 2).
The time course of the dry matter production followed a similar pattern during the three grow-ing seasons. The highest rates of DM production of the grass-clover mixtures were found during May–July ranging between 4 and 12 g m−2 per day, followed by rates between 3 and 7 g m−2 per day during July–September. Rates were lowest in September–November (4 to 1 g m−2per day).
The proportion of clover in the harvested crop grad-ually increased during the growing season to reach maximum values in August and then declined in
sub-Table 2
Total dry matter (TDM) production (g m−2) and proportion of clover (%) during the years 1994–1996. Data represent mean of 8
replicates±s.d. in parenthesis
Date of harvest TDM (g m−2) Clover (%) TDM (%) Clover (g m−2) TDM (g m−2) Clover (%)
Undersown grass-white clover 1st year grass-white clover 2nd year grass-red clover
100594 88 (20) 18 (4) 53 (9) 64 (13)
240594 99 (9) 27 (5) 93 (9) 64 (14)
090694 58 (14) 40 (6) 66 (9) 56 (11)
050794 173 (17) 70 (5) 211 (39) 65 (8)
030894 207 (27) 78 (3) 225 (38) 80 (3)
010994 170 (23) 76 (4) 170 (30) 77 (5)
021194 162 (35) 41 (5) 145 (15) 26 (1) – –
Total 1994 162 (35) 940 (65) 818 (44)
230595 296 (61) 42 (12) 342 (49) 38 (5)
150695 199 (26) 49 (5) 187 (14) 54 (14)
190795 338 (34) 66 (7) 246 (39) 59 (10)
170895 177 (68) 60 (7) 120 (28) 60 (13)
101095 154 (31) 41 (12) 121 (35) 41 (9)
161195 129 (45) 24 (19) 42 (11) 18 (6) 32 (8) 16 (6)
Total 1995 129 (45) 1206 (83) 1048 (34)
230596 147 (38) 20 (16) 150 (33) 42 (13)
130696 118 (18) 30 (15) 95 (26) 46 (12)
030796 77 (2) 52 (21) 81 (22) 61 (10)
010896 156 (50) 67 (24) 102 (33) 65 (8)
270896 232 (45) 68 ( 8) 107 (9) 35 (7)
260996 56 (15) 44 (12) 46 (8) 12 (4)
291096 72 (7) 34 (13) 37 (5) 5 (2)
Total 1996 858 (78) 618 (76)
sequent harvests to reach lowest values at the end of October and early November (Table 2).
3.4. Nitrogen in above ground biomass of grass-clover
Fig. 1. Concentration of total N in clover (d) and grass (j) during 1994 to 1996. Data represent mean of eight replicates±s.d.
3.5. Method for15N labelling of the soil inorganic N
pool
In 1995 and 1996 the two methods for labelling the plant available N with15N were compared. The 15N enrichment of the grass differed significantly depend-ing on the labelldepend-ing method. The grass in pre-labelled plots had an enrichment of 0.68±0.13 at.% 15N
excess in November 1994. In May 1995 the grass enrichment was 0.42±0.04 at.%15N excess and the enrichment remained at a relatively high level through-out the following two growing seasons (Fig. 2). The
15N enrichment in the grass was 0.14±0.02 at.%15N
excess in November 1996 (32 months after applica-tion). In the grass-white clover mixture, in which the soil was labelled with inorganic 15N in the spring of 1995 without the immobilising agent sucrose, the
15N enrichment in the grass declined rapidly and 2
months after application, it was 1.20±0.04 at.%15N excess (Fig. 2). The decrease continued and at the end of the second year (1996), the enrichment was only
slightly greater (0.019±0.002 at.%15N excess) than the enrichment of the clover (0.0017±0.0007 at.%
15N excess). Similarly, the atom % 15N excess in
the grass of the first year grass-white clover in 1996, showed a rapid decline when the soil was labelled with 15N without immobilisation, and a more slow decline when labelled with15N+sucrose (Fig. 2). A half-life of atom %15N excess in the soil inorganic N pool following labelling with or without sucrose could be estimated to approximately 1 year and 1 month, respectively.
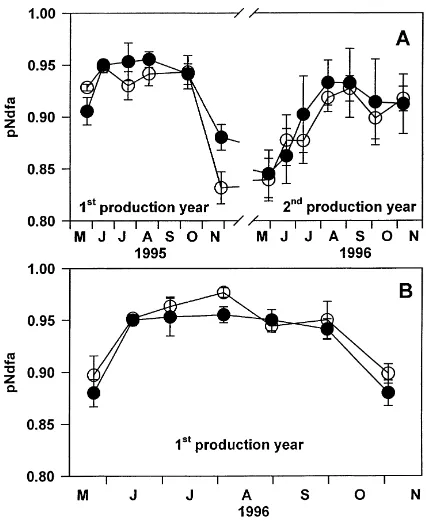
In spite of these differences between the two la-belling methods, there were no significant differences between the pNdfa (Fig. 3). The pNdfa from both methods showed similar seasonal variations with the lowest values early and late in the growing sea-sons. However, the small differences between the
15N enrichment in the grass and in the clover in the
Fig. 2. Atom %15N excess during the growing seasons of 1995 and 1996 in grass labelled with15N-labelled ammonium sulphate only (j) or labelled with 15N-labelled ammonium sulphate+sucrose
(15N-immobilisation method (d)). Data represent mean of eight
replicates±s.d.
without sucrose (Fig. 3). The average coefficient of variance of the pNdfa-values determined using the
15N-immobilisation method was 2.0% which is
sig-nificantly (P≤0.05) lower than 3.3% found in the treatment without sucrose amendment.
Because the two methods (with and without su-crose) resulted in similar estimates, the average pNdfa-value was used for calculations of the amount of N2fixed.
3.6. The pNdfa and amount of N2 fixed in
grass-clover mixtures
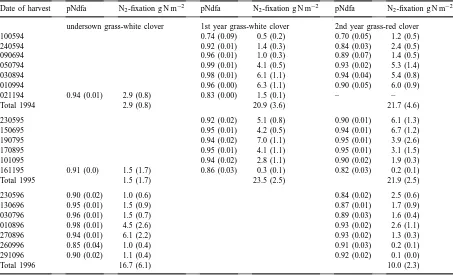
The pNdfa-values ranged between 0.70 and 0.99, with the lowest values in the beginning and at the end of the growing season (Table 3). The lowest values of pNdfa, 0.70 and 0.74, were measured at the first harvest in 1994 in the first year grass-white clover and in the second year grass-red clover, respectively.
Fig. 3. Proportion of N derived from the atmosphere (pNdfa) during the growing seasons of 1995 and 1996 of clover using either labelling with15N-labelled ammonium sulphate only (d) or with 15N-labelled ammonium sulphate+sucrose (15N-immobilisation
method (s)). Data represent mean of eight replicates±s.d.
The total amount of N2 fixed in the undersown
grass-white clover was 2.9 and 1.5 g N m−2 in 1994
and 1995, respectively, and ranged between 10.0 and 23.5 g N m−2per year in the grass-clover mixtures
dur-ing the 3 years of investigation (Table 3). The rates of N2 fixation calculated in terms of mg N fixed per
gram of clover shoot dry weight was 38.6±1.3 for the first and second year mixtures, and 45.0±1.4 for the undersown grass-clover.
3.7. Nitrogen in the grass-clover sward when ploughed under
Table 3
Proportion of N derived from the atmosphere (pNdfa) and amount of N2fixed (g N m−2) during the years 1994–1996. Data represent mean
of 8 replicates±s.d. in parenthesis
Date of harvest pNdfa N2-fixation g N m−2 pNdfa N2-fixation g N m−2 pNdfa N2-fixation g N m−2
undersown grass-white clover 1st year grass-white clover 2nd year grass-red clover
100594 0.74 (0.09) 0.5 (0.2) 0.70 (0.05) 1.2 (0.5)
240594 0.92 (0.01) 1.4 (0.3) 0.84 (0.03) 2.4 (0.5)
090694 0.96 (0.01) 1.0 (0.3) 0.89 (0.07) 1.4 (0.5)
050794 0.99 (0.01) 4.1 (0.5) 0.93 (0.02) 5.3 (1.4)
030894 0.98 (0.01) 6.1 (1.1) 0.94 (0.04) 5.4 (0.8)
010994 0.96 (0.00) 6.3 (1.1) 0.90 (0.05) 6.0 (0.9)
021194 0.94 (0.01) 2.9 (0.8) 0.83 (0.00) 1.5 (0.1) – –
Total 1994 2.9 (0.8) 20.9 (3.6) 21.7 (4.6)
230595 0.92 (0.02) 5.1 (0.8) 0.90 (0.01) 6.1 (1.3)
150695 0.95 (0.01) 4.2 (0.5) 0.94 (0.01) 6.7 (1.2)
190795 0.94 (0.02) 7.0 (1.1) 0.95 (0.01) 3.9 (2.6)
170895 0.95 (0.01) 4.1 (1.1) 0.95 (0.01) 3.1 (1.5)
101095 0.94 (0.02) 2.8 (1.1) 0.90 (0.02) 1.9 (0.3)
161195 0.91 (0.0) 1.5 (1.7) 0.86 (0.03) 0.3 (0.1) 0.82 (0.03) 0.2 (0.1)
Total 1995 1.5 (1.7) 23.5 (2.5) 21.9 (2.5)
230596 0.90 (0.02) 1.0 (0.6) 0.84 (0.02) 2.5 (0.6)
130696 0.95 (0.01) 1.5 (0.9) 0.87 (0.01) 1.7 (0.9)
030796 0.96 (0.01) 1.5 (0.7) 0.89 (0.03) 1.6 (0.4)
010896 0.98 (0.01) 4.5 (2.6) 0.93 (0.02) 2.6 (1.1)
270896 0.94 (0.01) 6.1 (2.2) 0.93 (0.02) 1.3 (0.3)
260996 0.85 (0.04) 1.0 (0.4) 0.91 (0.03) 0.2 (0.1)
291096 0.90 (0.02) 1.1 (0.4) 0.92 (0.02) 0.1 (0.0)
Total 1996 16.7 (6.1) 10.0 (2.3)
approximate ratio between root and above ground dry matter was 10 : 1. The concentration of total N was slightly higher in the roots of the grass-red clover sward than in roots of the grass-white clover sward, resulting in total amounts of N incorporated into the soil ranging between 19.6 and 29.6 g N m−2.
4. Discussion
The total dry matter production of a grass-clover crop depends on a number of factors, such as soil type,
Table 4
Total dry matter (TDM) and total N (0–20 cm) incorporated into the soil following ploughing of a second year grass-clover sward. Data represent mean of eight replicates±s.d. in parenthesis
Year Crop TDM (g m−2) Total N (%) Total N (g m−2)
Roots Above ground Roots Above ground Roots Above ground Total 1995 grass red clover 457 (78) 305 (33) 2.00 (0.64) 3.48 (0.28) 9.0 (2.6) 10.7 (1.5) 19.6 (3.0) 1996 grass white clover 1310 (190) 121 (29) 1.43 (0.40) 3.59 (0.33) 18.2 (3.5) 4.4 (1.1) 22.6 (2.9) 1997 grass white clover 1455 (543) 136 (31) 1.75 (0.51) 3.69 (0.41) 24.6 (8.2) 5.0 (1.2) 29.6 (8.7)
1995. Additionally, the precipitation was more opti-mally distributed over the growing period in 1995 than in 1994 and in 1996, resulting in total dry matter yields in 1996, which were only about half of those in 1995. In several studies the effects of using15N in combi-nation with an immobilizing agent, such as sucrose, or other methods of causing a slow-release of15N over time, have been evaluated (e.g., Witty, 1983; Boddey et al., 1984; Giller and Witty, 1987; Viera-Vargas et al., 1995). Incorporation of the fertiliser with a readily available carbon source is likely to result in a more stable enrichment of available soil-N with time, so that the enrichment of N taken up by reference plants is less influenced by the time at which they absorb N from the soil. Errors often result from dif-ferences in the pattern of N uptake between reference and N2-fixing plants (Witty, 1983; Giller and Witty,
1987). In an examination of different fertilizer for-mulations, Witty and Ritz (1984) found that15N salts added together with an easily available carbon source was the most flexible and successful method of stabil-ising the enrichment of available soil N, both in field and pot experiments. Witty (1983) already concluded that the addition of 15N fertiliser together with an available carbon source, which lead to a more stable soil enrichment, will give a more accurate isotope dilution based estimate of N2-fixation. In the present
study estimates of N2 fixation were not significantly
different between the two methods used, i.e.,15N with and without a carbon source. However, it was found that the addition of a carbon source was a stabilizing factor for the enrichment of the soil N, especially in the second year of measurements.
When N2-fixation estimates are made using
differ-ent methods of15N application it is important to dis-tinguish between the real effects of fertiliser uptake on growth and N2fixation of the crop and errors
aris-ing from mismatcharis-ing of reference plants (Giller and Witty, 1987). The fertiliser effect is of special im-portance when15N is applied after emergence of the crop or applied to the standing crop. In this study the proportion of N derived from the atmosphere (pNdfa) was relatively low at the beginning of the growing pe-riod in comparison with the values obtained during the summer months. The low values in the early pe-riod could be a real effect of fertiliser uptake, arising from differences in the pattern of nitrogen uptake be-tween the ryegrass and clover, or be the result of the
relatively low soil temperatures (5–10◦C) in the early spring when the nitrogenase enzyme system is oper-ating at suboptimal conditions. Decreasing tempera-tures may also explain why the pNdfa again tended to decrease during the autumn.
The estimates of annual biological N2-fixation in
the grass-clover crops in the present investigation var-ied from 10.0 and 23.5 g N m−2per year, correspond-ing to 100 and 235 kg N ha−1. However, it is difficult to compare the result of total symbiotic N2 fixation
among different studies because of different cropping systems, soil types, climatic conditions, etc., whereas rates of N2fixation in terms of mg N fixed per gram
of legume dry weight can be calculated and compared. This calculation has been made in many studies, e.g., Boller and Nösberger (1987); Ledgard et al. (1987, 1990); Kristensen et al. (1995); McNeill et al. (1998), who found that 30–46 mg N was fixed per gram of white clover shoot dry weight. Similarly, e.g., Brink (1990), Ledgard et al. (1990); Nesheim and Øyen (1994) found that 24–36 mg N was fixed per gram of red clover shoot dry weight. These values accord with the results of the present study.
An estimate of the input of atmospherically derived N incorporated into the soil is valuable for the evalu-ation of the fertiliser effect on subsequent crops and the potential risk for leaching of the possible nitro-gen surplus in the soil. It was not possible to separate the below ground plant material into grass and clover roots. Therefore, the amount of atmospherically de-rived N incorporated into the soil was estimated from the total N measurements assuming that the distribu-tion between grass and clover roots corresponded to the average distribution of the above-ground plant ma-terial. Furthermore, the authors assumed that 30% of the grass root N had been transferred from clover, i.e., derived from the atmosphere (Boller and Nösberger, 1987; Ledgard, 1991; Høgh-Jensen and Schjørring, 1997). With these assumptions it was estimated that 13.0, 12.0 and 15.3 g atmospherically derived N m−2 was incorporated into the soil in the spring of 1995, 1996 and 1997, respectively. The amount of fixed N in the plant material below harvest or grazing height, i.e. stolons and roots, may contribute considerably to the total amount of N2fixation, and it has been shown
that the total N2 fixation can be estimated as fixed
which was incorporated into the soil corresponded to the N2fixation in stolons and roots during the
previ-ous growing season, the ratio between total N2fixation
and N2 fixation in harvested plant material was 1.6,
1.5, and 2.5 in 1994, 1995, and 1996, respectively. This study demonstrated that large amounts of N enter an organic farming system via symbiotic N2
fix-ation in clover and that this amount can be estimated easily using simple15N isotope dilution technique by adding the label to the standing crop. This and other studies of N dynamics in grass-clover mixtures of tem-perate cropping systems show that without application of large amounts of plant available N clover will be al-most solely dependent on N2fixation (90–100%)
dur-ing the main part of the growth season. These results can improve the basis for estimating fixed N in sim-ilar systems by more simple (non-isotopic) methods, e.g., such as suggested by Kristensen et al. (1995).
The experiments also highlighted that large amounts of N are incorporated into the soil with the crop residues of a grass-clover mixture after the second production year. Improved knowledge on the fate of this N is required to optimise the management of the fixed N resource and decrease the risk of N leaching.
Acknowledgements
The authors want to thank Merete Brink, Bodil Möllnitz, Hanne Jensen, and Helle Nielsen for techni-cal assistance, and The Ministry for Food, Agriculture and Fisheries for financial support.
References
Boddey, R.M., Chalk, P.M., Victoria, R.L., Matsui, E., 1984. Nitrogen fixation by nodulated soybean under tropical field conditions estimated by the15N isotope dilution technique. Soil
Biol. Biochem. 16, 583–588.
Boller, B.C., Nösberger, J., 1987. Symbiotically fixed nitrogen from field-grown white and red clover mixed with ryegrass at low levels of15N-fertilization. Plant Soil 104, 219–226. Brink, G.E., 1990. Seasonal dry matter, nitrogen, and dinitrogen
fixation patterns of crimson and subterranean clovers. Crop Sci. 30, 1115–1118.
Fried, M., Middelboe, V., 1977. Measurement of amount of nitrogen fixed by a legume crop. Plant Soil 47, 713–715.
Giller, K.E., Witty, J.F., 1987. Immobilized15N-fertilizer sources
improve the accuracy of field estimates of N2-fixation by isotope
dilution. Soil Biol. Biochem. 19, 459–463.
Høgh-Jensen, H., Schjørring, J.K., 1997. Interactions between white clover and ryegrass under contrasting nitrogen availability: N2 fixation, N fertilizer recovery, N transfer, and
water use efficiency. Plant Soil 197, 187–199.
Jensen, E.S., 1991. Evaluation of automated analysis of 15N and total N in plant material and soil. Plant Soil 133, 83– 92.
Jensen, E.S., Høgh-Jensen, H., Jørgensen, F.V., Schjørring, J.K., Vinther, F.P., 1997. Management of biological nitrogen fixation in grass/clover leys. In: Kristensen, N.H., Høgh-Jensen, H. (Eds.), New Research in Organic Agriculture. IFOAM, Tholey-Theley, pp. 89–96
Jørgensen, F.V., Ledgard, S.F., 1997. Contribution from stolons and roots to estimates of the total amount of N2fixed by white
clover (Trifolium repens L.). Ann. Bot. 80, 641–648. Kristensen, E.S., Høgh-Jensen, H., Kristensen, I.S., 1995. A simple
model for estimation of atmospherically-derived nitrogen in grass-clover systems. Biol. Agric. Hortic. 12, 263–276. Ledgard, S.F., 1991. Transfer of nitrogen from white clover to
associated grasses using15N methods in swards grazed by dairy
cows. Plant Soil 131, 223–265.
Ledgard, S.F., Steele, K.W., 1992. Biological nitrogen fixation in mixed legume/grass pastures. Plant Soil 141, 137–153. Ledgard, S.F., Brier, G.J., Littler, R.A., 1987. Legume production
and nitrogen fixation in hill pasture communities. N. Z. J. Exp. Res. 30, 413–421.
Ledgard, S.F., Brier, G.J., Upsdell, M.P., 1990. Effect of clover cultivar on production and nitrogen fixation in clover-ryegrass swards under dairy cow grazing. N. Z. J. Agric. Res. 33, 243–249.
Mallarino, A.P., Wedin, W.F., 1990. Effect of species and proportion of legume on herbage yield and nitrogen concentration of legume-grass mixtures. Grass Forage Sci. 45, 393–402.
McNeill, A.M., Zhu, C., Fillery, R.P., 1998. A new approach to quantifying the N benefit from pasture legumes to succeeding wheat. Aust. J. Agric. Res. 49, 427–436.
Nesheim, L., Øyen, J., 1994. Nitrogen fixation by red clover (Trifolium pratense L.) grown in mixtures with timothy (Phleum pratense L.) at different levels of nitrogen fertilization. Acta. Agric. Scand., Sect. B. Soil Plant Sci. 44, 28–34.
SAS Institute, 1989. SAS/STAT Users Guide, Version 6, fourth edn., vol. 2. Cary, North Carolina, USA.
Viera-Vargas, M.S., de Oliveira, O.C., Souto, C.M., Cadish, G., Urquiaga, S., Boddey, R.M., 1995. Use of different15N labelling
techniques to quantify the contribution of biological N2fixation
to legumes. Soil Biol. Biochem. 27, 1185–1192.
Witty, J.F., 1983. Estimating N2-fixation in the field using 15N-labelled fertiliser: Some problems and solutions. Soil Biol.
Biochem. 15, 631–639.
Witty, J.F., Ritz, K., 1984. Slow-release15N fertilizer formulations
to measure N2-fixation by isotope dilution. Soil Biol. Biochem.