CO
2
exchange at the floor of a boreal forest
Ann-Sofie Morén
a,∗, Anders Lindroth
b,1aDepartment for Production Ecology, Swedish University of Agricultural Sciences, P.O. Box 7042, SE-750 07 Uppsala, Sweden bDepartment of Physical Geography, Lund University, Sölvegatan 13, SE-223 62 Lund, Sweden
Received 26 February 1999; received in revised form 3 November 1999; accepted 16 November 1999
Abstract
Net CO2 exchange at the forest floor in a mixed boreal spruce and pine forest in central Sweden was studied during
1996. Forest floor CO2efflux was measured continuously by means of a ventilated open soil chamber, covering a surface
area of 0.6 m2. The chamber was transparent and thus measured soil respiration by night, and soil respiration reduced by
photosynthetic uptake by forest floor vegetation by day. Maximum nocturnal efflux rates were 0.2–0.7 and daytime rates
were 0.05–0.2 mg m−2s−1. Measured efflux rates were higher than reported in other studies, but have earlier been found to
agree with nocturnal CO2 exchange of the forest ecosystem measured by eddy-covariance technique. Soil temperature at
5 cm explained 49% of the variation in nocturnal soil respiration, while moss and air temperature explained 29 and 17% of
the variation, respectively. For the relationship with soil temperature at 5 cm, base respiration rate and effectiveQ10, derived
from data over the seasonal course, were 0.04 mg m−2s−1and 4.75, respectively. Corresponding figures for the relationship
with air temperature were 0.11 mg m−2s−1and 1.89. Over the 6 months (May–October) covered by measurements, August
had the largest CO2efflux, 0.89 kg m−2and May the smallest efflux, 0.20 kg m−2. During daytime photosynthetic uptake
by forest floor vegetation reduced potential soil efflux through respiration by ca. 20%. On an annual basis total forest floor
respiration was estimated to be 4.5 kg CO2m−2and gross photosynthesis to be 0.7 kg CO2m−2, resulting in a net efflux of
3.8 kg CO2m−2. ©2000 Elsevier Science B.V. All rights reserved.
Keywords:Soil respiration; Net assimilation; Chamber system; Scots pine; Norway spruce
1. Introduction
Soils throughout the world, and boreal forest soils in particular, are currently attracting the attention of the scientific community. One reason for this is that global circulation models (GCM), indicate for a range of CO2emission scenarios, a continuous increase in
temperatures, the largest increases being expected
∗Corresponding author. Tel.:+46-018-67-2559;
fax:+46-018-67-3376.
E-mail addresses:[email protected] (A.-S. Mor´en), [email protected] (A. Lindroth).
1Fax:+46-046-2224011.
at high latitudes. Recent simulations for the period 1990−2050 predict a global warming of 2–3◦C in
winter and 1–2◦C in summer for most of the boreal
region (Greco et al., 1994). Soil respiration and soil organic matter (SOM) decomposition are most sen-sitive to a temperature increase in areas where soil temperatures are low, as is the case in tundra and boreal forests (Lloyd and Taylor, 1994; Kirschbaum, 1995). Therefore, the combination of a large carbon pool in boreal soils (Dixon et al., 1994) and increas-ing temperature, will inevitably increase soil respi-ration rates and SOM decomposition, which might transform many boreal forests into carbon sources (Kirschbaum, 1995). Both Goulden et al. (1998) and
Lindroth et al. (1998) found that boreal forests can already be a source of carbon for substantial periods, which contrasts sharply with the common belief that forests are always carbon sinks (Wofsy et al., 1993; Grace et al., 1995; Goulden et al., 1996a).
Technical developments during the 1990s made it possible to measure the instantaneous exchange of CO2 between the biosphere and the atmosphere
di-rectly, by means of the eddy-covariance technique (e.g. Baldocchi and Meyers, 1991; Grelle and Lindroth, 1996), and at present the technique is widely applied in ecosystem studies (Kaiser, 1998). Data from such studies give, for example, information on the response of ecosystems to climate (cf. Goulden et al., 1997), while the governing processes, such as photosynthe-sis, and soil and woody biomass respiration, can only be studied at smaller spatial scales. In particular, pre-dictions of the exchange of CO2 at ecosystem level
require a mechanistic understanding of the governing processes (Steffen et al., 1998). To increase under-standing of diurnal, seasonal and between-year vari-ation encountered at ecosystem level, measurements must be supplemented by measurements at lower lev-els of scale, in combination with modlev-els which scale compartment fluxes to ecosystem level (e.g. Sellers et al., 1997; Steffen et al., 1998). In particular, com-paratively little attention has been paid to roots and below-ground organisms and their function (Jones et al., 1998). Since photosynthesis and respiration, in boreal ecosystems, are almost equal in absolute terms on an annual basis (e.g. Lindroth et al., 1998) our knowledge of the direct and indirect long-term effects of increasing CO2 concentration and temperature on
boreal forest ecosystems therefore is very uncertain. The efflux of CO2from the soil is in principle the
re-sult of two processes: the production and the transport of CO2. In forest soil, plant roots and soil microbes
are the dominant CO2 producers. Their CO2
produc-tion depends on a number of external factors, such as soil organic content, soil moisture, temperature, oxy-gen supply, CO2 concentration, nutrient availability,
etc., as well as a number of internal factors, such as root biomass, and the size and composition of the mi-crobial population (see e.g. Glinski and Stepniewski, 1985). Transport takes place both under the influence of pressure gradients — mass flow, and concentra-tion gradients — diffusion flow (Glinski and Step-niewski, 1985). Normally, diffusion is believed to be of
far greater significance than mass flow (Simunek and Suarez, 1993). When the water content of a soil is close to saturation, however, the importance of mass flow increases, and at saturation it is more important than the contribution from gas-phase diffusion (cf. Suarez and Simunek, 1993; Freijer and Leffelaar, 1996).
Despite a long history of soil CO2 efflux
measure-ments, this process remains one of the most difficult to measure in an accurate and appropriate manner (see e.g. Norman et al., 1997; Rayment and Jarvis, 1997). The methods available are usually based on one of the four main principles: closed-static and closed-dynamic chamber systems, open-chamber sys-tems and eddy-covariance syssys-tems (e.g. Nakayama, 1990; Norman et al., 1997). Closed-static chambers with chemical traps such as soda lime, have been widely used, but the technique has been shown to be hampered by systematic errors (Janssens and Ceule-mans, 1998). Today, the most common technique employed is probably the closed-dynamic chamber, in which air circulates between the chamber and an external IRGA, and where the increase in CO2
concentration as a function of time is proportional to the CO2 flux. Open-chamber systems and the
eddy-covariance technique are, however, increasingly common, because they can be left unattended for an extended period to observe time courses, temperature responses, etc. (e.g. Iritz et al., 1997; Rayment and Jarvis, 1997). Furthermore, the eddy-covariance tech-nique has the advantage of not affecting the emission of CO2 from the soil, but requires large, uniform
areas with no other sources and sinks between the surface and the measuring height (e.g. Verma, 1990; Baldocchi and Vogel, 1996; Baldocchi et al., 1997).
Many sources of error are associated with chamber design, which may seriously affect the CO2 efflux
rate (see Rayment and Jarvis, 1997). Today there exists no independent method to measure soil CO2
deciduous forest, found that nocturnal ecosystem res-piration was about 65% of scaled chamber measure-ments. In contrast to these two studies, Lindroth et al. (1998), found good agreement, though for a limited period, between nocturnal ecosystem respiration and scaled chamber measurements. The surface area of the chamber is also important, because of the great spatial heterogeneity encountered in forest soils (Rayment and Jarvis, 1997; Norman et al., 1997). To investigate differences between soil chamber systems, Norman et al. (1997) compared six different systems, each of the basic types of system mentioned above being rep-resented. Adjustment factors, to bring all the systems into agreement, varied from 0.93 to 1.45, with an un-certainty of ca. 10–15%. The commercially available LI-6200 (LI-COR, Inc., Lincoln, NE), with a chamber covering a surface area of about 80 cm2, was used as
a reference system. The primary source of variability between chamber systems was associated with spatial heterogeneity. Thus many questions related to mea-surements of soil CO2 remain to be answered. One
of the most crucial questions is which soil-chamber system gives the most accurate measurements; an-other is how to account for the spatial variation of soil CO2 efflux encountered in forest ecosystems.
Furthermore, as addressed by Lavigne et al. (1997), the question also remains whether scaled chamber or eddy-covariance measurements provide more accurate estimates of ecosystem respiration rates.
As indicated above the exchange between soil and atmosphere is a vital field of study. Not the least mea-surement techniques constitute an ongoing challenge to the scientific community. In order to quantify forest floor contribution to total ecosystem CO2 exchange
on daily as well as on a seasonal basis, a recently developed chamber monitoring system was used. The system, which before only was applied over a clay soil, continuously measures CO2and water exchange
at surface areas of 0.6 m2, which is 4–75 times larger than that of the soil chambers commonly used in soil respiration studies (e.g. Mathes and Schriefer, 1985; Goulden and Crill, 1997; Norman et al., 1997). The main aim of the present study was to quantify and model the CO2 exchange at the forest floor of a
bo-real forest in central Sweden. This paper (i) presents the site and measurements made with the chamber, (ii) quantifies the CO2 efflux of the forest floor at
the site and discusses its seasonal variation, (iii)
partitions the net CO2 efflux of the forest floor into
gross photosynthesis and respiration, (iv) quantifies the effect of abiotic environment on the gross photo-synthesis of the forest floor, and (v) discusses advan-tages and disadvanadvan-tages of the system as applied in a boreal forest.
2. Materials and methods
2.1. The experimental site
The measurements were carried out at the central NOPEX site (60◦5′N, 17◦29′E, alt 45 m) ca. 30 km
north of Uppsala, Sweden. The site is at the southern edge of the boreal forest zone. The forest is about 70 years old at the experimental plot, and the crown stra-tum consists mainly of Norway spruce (Picea abies
(L.) Karst.; 66% of the stand basal area) and Scots pine (Pinus sylvestris L.; 33%). Maximum stand height was ca. 23 m. The canopy was almost closed and the projected leaf area index (LAI) was estimated to 5.7 m2m−2 (Morén et al., 2000). The field and
bot-tom layer was sparse and consisted mainly of dwarf shrubs and mosses, whereThuidium tamariscinumand
Hylocomium splendens were the two most frequent mosses. About 65% of the forest floor was covered with varying proportions of moss andVaccinium myr-tillus(L.), approximately 20% was covered by moss, and the remaining 15% was a mosaic ofV. myrtillus
and moss with sphagnum moss and bracken ( Pterid-ium aquilinumL.). The soil was a deep, boulder-rich sandy glacial till. A general description of the site is found in Lundin et al. (2000) and a description of the NOPEX region in Halldin et al. (1999).
2.2. Measurements
The chamber system, which was applied to mea-sure exchange of water and CO2 between the forest
chambers were made from transparent polyethylene film, in the shape of a ‘tunnel’ lying on the ground and with the side towards the soil open to allow free exchange of air between the soil and the interior of the ‘tunnel’. The ground area covered was 0.3 m×2.0 m and the height of the ‘tunnel’ was 0.3 m. One end of the tunnel, the air intake side, was also open while the other end was connected to a fan which continuously sucked air through the ‘tunnel’. After the fan, air was blown through a cylindrical steel tube, ca. 2 m long and with a diameter of 20 cm. A propeller anemome-ter, diameter 19 cm, was mounted inside the tube and functioned as a flow meter. The mean wind speed in the ‘tunnel’ was 0.2–0.3 m s−1and about three times
higher in the tube (cross section area ratio 1 : 3). Since the forest floor was irregular, frames were inserted ca. 5 cm into the ground and the chambers were placed on top of these. To allow for measurements at dif-ferent spots, eight frames were installed before mea-surements started in spring 1996 (Fig. 1). Four of the frames covered spots with moss and a varying cover ofV. myrtillus, while the other four covered spots with a thin moss layer and few dwarf shrubs (Table 1). All measurement locations were situated within a ra-dius of 10 m. Since no rain could reach the soil inside chambers, the soil was manually watered after each rain event, with an amount of water corresponding to the measured precipitation.
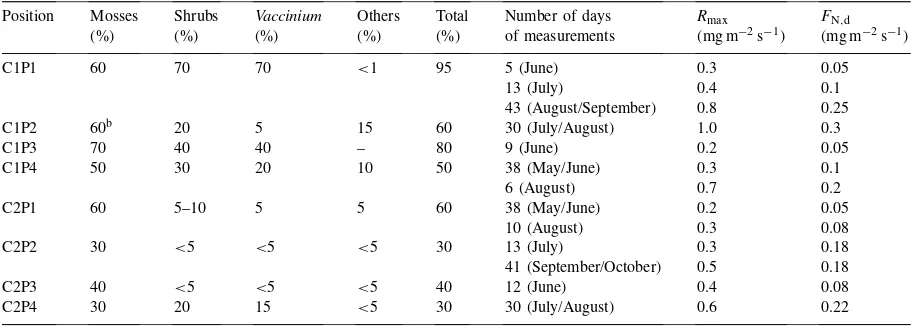
Table 1
Ground vegetation type at the different locations where CO2efflux was measureda
Position Mosses Shrubs Vaccinium Others Total Number of days Rmax FN,d
(%) (%) (%) (%) (%) of measurements (mg m−2s−1) (mg m−2s−1)
C1P1 60 70 70 <1 95 5 (June) 0.3 0.05
13 (July) 0.4 0.1
43 (August/September) 0.8 0.25
C1P2 60b 20 5 15 60 30 (July/August) 1.0 0.3
C1P3 70 40 40 – 80 9 (June) 0.2 0.05
C1P4 50 30 20 10 50 38 (May/June) 0.3 0.1
6 (August) 0.7 0.2
C2P1 60 5–10 5 5 60 38 (May/June) 0.2 0.05
10 (August) 0.3 0.08
C2P2 30 <5 <5 <5 30 13 (July) 0.3 0.18
41 (September/October) 0.5 0.18
C2P3 40 <5 <5 <5 40 12 (June) 0.4 0.08
C2P4 30 20 15 <5 30 30 (July/August) 0.6 0.22
aGround cover is given as per cent of total soil surface for mosses, and shrubs. Shrubs are further divided intoVacciniumand others.
Rmax is the highest respiration rate encountered at night andFN,d is the light-saturated net efflux rate of the forest floor during daytime. bIncluding sphagnum moss.
Fig. 1. Measurement periods for the eight chamber locations.
Air was sampled at the inlet and outlet of each chamber and the differences in water and CO2content
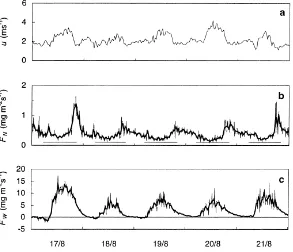
Fig. 2. Instantaneous forest floor water vapour and CO2exchange from 17–21 August 1996 at location C1P4 (see Fig. 1 and Table 1). (a)
Wind velocity,uabove canopy, (b) 5-min (thin line) and half-hourly data (thick line) of forest floor net CO2 exchange,FN, and (c) water
vapour exchange,FW. Horizontal lines in (b) indicate when sun was above horizon.
and H2O exchange of the forest floor was calculated
as the product of the air-flow through the chamber, and the difference in the water vapour or CO2mass
frac-tion in the air, divided by the soil surface area as de-fined by the frames. Climatic variables were recorded for each chamber. A temperature and relative humid-ity probe (Rotronic Instrument Corp., NY, USA) was placed at the outlet of the chamber, a quantum sensor (LI-190SZ, Li-Cor Inc., Lincoln, USA) was placed ca. 5 cm above the chamber and moss temperature was measured inside the chamber by means of two ther-mocouples inserted into the basal part of the moss layer.
Soil temperature and soil-water content were mea-sured by other sub-projects within the same stand. Thermocouples were installed at six depths (5, 10, 20, 30, 50, 80 cm) at six different locations in the stand. Similarly, TDR-probes were installed at three to five depths at six locations, the uppermost level being 10 cm. For a brief description of additional measure-ments, see Lundin et al. (2000).
2.3. Analysis of data and modelling
In the following, the measured net CO2 efflux of
the forest floor is denoted by FN. During night FN
represents CO2produced by root, microbial, and
for-est floor vegetation respiration, and is referred to as respiration,R. During day CO2is used by the
photo-synthesising vegetation within chambers, and thereby
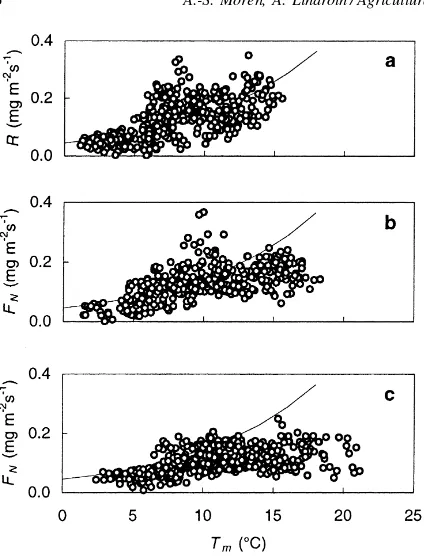
Fig. 3. Instantaneous net forest floor CO2exchange,FN, at location
Fig. 4. Instantaneous net forest floor CO2exchange,FN(at night
respiration,R, only), at location C1P4, averaged over 30 min for the period 10 May–13 June 1996 plotted against (a) moss temperature, Tm, for incident light, PPFD, below 3mmol m−2s−1, (b)Tm, for
PPFD in the range 3–30mmol m−2s−1, and (c) Tm, for PPFD
above 30mmol m−2s−1.
the resulting net efflux is lower than had there been no vegetation within the chambers:
FN =R−FG (1)
whereFGis the gross forest floor exchange and should
equal photosynthetic uptake, but does not include the loss of carbon during dark respiration. CO2 efflux
from the soil is considered positive and CO2uptake by
forest floor vegetation negative.
Measured net CO2 efflux showed relatively large
variability, and the scatter — in contrast to the water-exchange measurements (Fig. 2c) — was most pronounced at night (Fig. 2b). The scatter was con-siderably reduced by calculating 30-min mean val-ues. Peaks of varying size, apparently independent of temperature, sometimes appeared in the evening around sunset, and a smaller peak was also occa-sionally recognised around sunrise (Fig. 2b). The occurrence of these peaks appeared to be correlated
with changes in atmospheric stability. However, since the mechanisms behind this are not known, it was de-cided to omit such data from the analysis at temporal resolutions of less than 1 day. Thus for analysis of respiration rates, i.e., night-time data, data were con-sidered only from midnight and until the photosyn-thetic photon flux density, PPFD, measured at ground level, reached 3mmol m−2s−1, whereas no data were excluded when daily totals were considered.
To characteriseFN at different chamber locations
and times of season, the highest respiration rate en-countered at night, Rmax, and the ‘light-saturated’
net efflux rate of the forest floor during daytime,
FN,d, were estimated. For each measurement period
(Fig. 1, Table 1), the instantaneous FN was plotted
against PPFD (Fig. 3), andRmax was defined as the
value at the upper end of the frequency distribution (95%). During daytime, FN varied with PPFD, but
was less variable at higher PPFD (Fig. 3) and showed reduced range of values when PPFD was greater than 50mmol m−2s−1. The ‘saturation’ threshold varied with measurement location. The mean value of FN
above this ‘saturation’ threshold was taken as a rep-resentative daytime efflux,FN,d.
To modelFN, net fluxes were separated into
respira-tory and gross CO2exchange. To estimate respiration
rate, a relationship was established between respira-tion and temperature,T:
R=R0expkT (2)
whereR0andkare fitting parameters: R0is the base
respiration rate andkis related toQ10, the factor by
which a reaction increases for an increase of 10◦C in
temperature. Temperature affects the respiration pro-cess per se, and it also affects the population size of respiring roots and micro-organisms. Further, the vol-ume of space beneath the chamber changes through-out the season as the water table changes. In order to strictly follow the definition ofQ10, such a value
should be obtained from the changes in CO2efflux
typ-ically occurring over the course of a day (e.g. Rayment and Jarvis, 1997). However, temperature changes of the upper soil horizons over such a short time interval are usually too small to allow a correct and accurate estimate ofQ10andQ10in this study is, therefore,
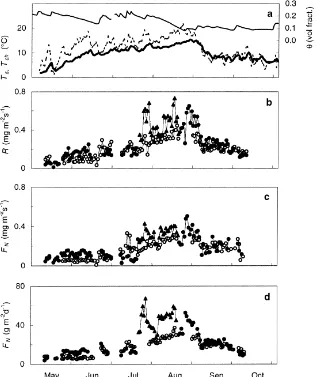
Fig. 5. Seasonal variation of forest floor CO2exchange. (a) Daily averages of soil temperature,Ts, at 5 cm depth (thick line), air temperature,
Ta, at 8.5 m (dotted line), and soil water content,θ, (thin line), (b) average night-time, (c) average day-time, and (d) daily totals of forest
floor CO2 efflux, which during day corresponds to respiration reduced by photosynthetic uptake,FG (Eq. (2)), and during night only
respiration,R. Filled circles are measurements made at locations C1P1, C1P3 and C1P4, filled triangles measurements at location C1P2, and open circles measurements made at locations C2P1–C2P4.
FG was calculated by rearranging (Eq. (1)) (cf.
Goulden et al., 1997). Because data were noisy and the nocturnal temperature range was often small, even for periods of several weeks, temperature response functions were difficult to establish for single mea-surement periods (Eq. (2)). Therefore all available data were used, and two groups established. Data from spot C1P2, were treated separately because of higher fluxes (Table 1), and because those measure-ments were representative of only a very small part
of the stand. The other group contained data from the other seven spots.
3. Results
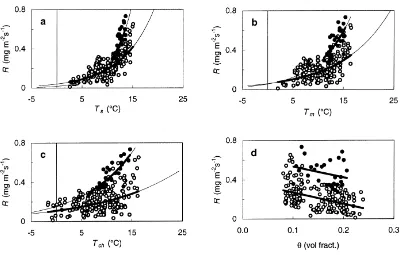
Fig. 6. Mean night-time respiration rates,R. (a) Respiration plotted against soil temperature at 5 cm,Ts. The best fit for open circles was
R=0.0401 exp(0.1559Ts),Q10e=4.8,R2=0.49,n=195, whereQ10e is an effectiveQ10, see text; (b) Respiration plotted against moss
temperature,Tm. The best fit for open circles wasR=0.0599 exp(0.1067Tm),Q10e=2.9,R2=0.29,n=195; (c) Respiration plotted against chamber temperature,Tch. The best fit for open circles wasR=0.1092 exp(0.0638Tch),Q10e=1.9,R2=0.17,n=195; and (d) Respiration plotted against soil water content at 10 cm. The fit for open circles wasR= −0.9024θ+0.3341,R2=0.16,n=195. Thick solid lines are regression lines and thin solid lines are extrapolations of the regression lines. Open circles show respiration rates at locations C1P1, C1P3, C1P4 and C2P1–C2P4. Filled circles show respiration rates at location C1P2.
shrubs began to photosynthesise (Fig. 3), and the system apparently was light-saturated at PPFD above 50mmol m−2s−1. The effect of photosynthesis was clearly seen whenFNwas plotted against temperature
for different PPFD classes. At night, FN showed an
exponential increase (Fig. 4a). At PPFD in the range 3−30mmol m−2s−1 (Fig. 4b), photosynthesis clearly affected FN, and at PPFD above 30mmol m−2s−1 (Fig. 4c), a temperature response only was seen at temperatures below 10◦C.
Average nocturnal respiration rates and the daytime net CO2 exchange of the forest floor were at their
lowest in May, increased through June and July, max-imum in August and decreased in September and Oc-tober (Fig. 5a–c). The increase was slow throughout May to the middle of July, and was followed by a more rapid increase from July before reaching the maximum in August. The corresponding temperature increase, on the other hand, was faster in May and first half
of June and was slower from mid-June until August. From August until September, both nocturnal respira-tion and daytime net CO2 efflux were more strongly
correlated with temperature. Net CO2efflux,
accumu-lated to diurnal (24-h) values, showed a trend similar to that of the average nocturnal and daytime values (Fig. 5d). Locations with denser vegetation cover had generally higher respiration and net efflux rates, than sparsely vegetated locations. Excluding location C1P2 (Table 1, Fig. 5b–d), the highest average nocturnal respiration rate was 0.65 mg m−2s−1 and the highest daytime efflux rate was 0.51 mg m−2s−1. Similarly, the largest diurnal efflux was 52 g m−2.
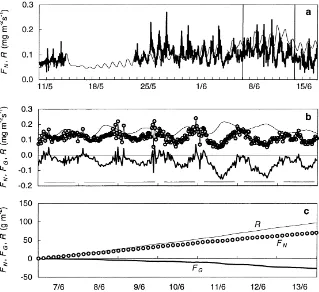
temper-Fig. 7. Measured and modelled instantaneous net forest floor CO2 exchange. (a) Half-hourly average values of net forest floor CO2
exchange,FN, taken as an average of measurements at locations C1P4 and C2P1 (thick line), and modelled respiration (thin line) for 11
May–16 June, (Measured and modelled values during the period 1–13 June, see detail in (b), (b) measuredFN (circles) for 7–13 June
together with modelled respiration,R, (thin line), and gross forest floor exchange,FG, (thick line), and (c) accumulatedR,FN, andFG.
Horizontal lines in (b) indicate when sun was above horizon.
ature explained 61% of the variation in respiration, while soil and moss temperatures both explained 50% of the variation. The relationship with soil temperature at 5 cm gave a base respiration rate of 0.04 mg m−2s−1,Q10e was 4.75, and the respiration
rate at 10◦C was 0.19 mg m−2s−1 (Fig. 6a). Base
respiration rate increased, whileQ10edecreased, with
increasing temperature range; hence with chamber temperature as predictor, the base respiration rate was 0.11 mg m−2s−1 and Q
10e 1.89 (Fig. 6c). The
relationship with soil-water content was weak, and explained only 20% of the variation (Fig. 6d).
To estimate the photosynthetic uptake respiration was modelled as a function of soil temperature at 5 cm (Eq. (2) with parameters according to Fig. 5a). Com-parison with an average of the measurements at loca-tions C1P4 and C2P1 from 11–14 May and from 23
May–16 June, indicated that the base respiration rate, and possibly alsoQ10e, varied throughout the season
(Fig. 7a). From 11–31 May, nocturnal respiration was underestimated by the model as compared to measure-ments when data was available, from 1–13 June mod-elled and measured data agreed, and from 13–16 June the model overestimated respiration (Fig. 7a and b). Because of these discrepancies, photosynthetic uptake was estimated only for the period for which modelled and measured nocturnal fluxes showed good agree-ment (Fig. 7b). During this period, chamber tempera-ture ranged from 6–26◦C, and soil temperature from
7–11◦C.
FG was calculated as the difference between
modelled respiration and measured net CO2efflux (Eq.
(1)), and was at most 0.19 mg m−2s−1 (Fig. 7b). R,
FN and FG, accumulated for the period 7–13 June,
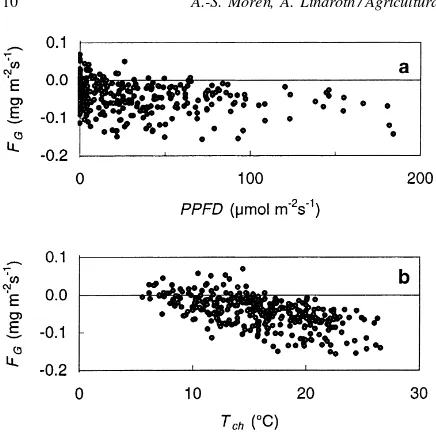
Fig. 8. Estimated instantaneous gross forest floor CO2 exchange,
FG, from Fig. 7b, plotted against (a) incident light, PPFD, and (b)
chamber temperature,Tch for 7–13 June 1996.
of CO2 released through respiration by about 28%
(Fig. 7c). Of the 96.6 g m−2respired, 27.3 g m−2was used in photosynthesis, which resulted in a net CO2
efflux over 7 days of 69.3 g m−2.FG showed a large
scatter, and only a weak light-response (Fig. 8a).
Fur-Fig. 9. Average net forest floor exchange rate, FN, based
on measurements from the two chambers, accumulated per day, and plotted against soil temperature, Ts, at 5 cm.
Regres-sion was made for three periods: 11 May–16 June (circles), FN=5.236+0.483Ts,R2=0.42,n=20; 17 June–8 July (squares), FN= −19.77+3.227Ts,R2=0.24,n=33; 9 July–7 October (tri-angles),FN= −1.046+2.150Ts,R2=0.69,n=43. Arrows indi-cate the seasonal course.
Fig. 10. Net forest floor exchange rate,FN, accumulated from 1
May–31 October 1996. Daily net CO2 efflux,FN, was based on
measurements from the two chambers, accumulated per day and missing data filled in by linear regression with soil temperature, Ts, at 5 cm (cf. Fig. 9). Bars showFN accumulated per month.
thermore,FGincreased as temperature increased. The
temperature optimum was difficult to identify, but the response in relation to chamber temperature appeared to level out at about 18◦C (Fig. 8b).
From 11 May–7 October, chamber measurements covered 96 complete days. Soil temperatures were available for 179 days, from 6 May–31 October. A linear relationship was established between daily accumulated net CO2 efflux of the forest floor and
mean soil temperature. The model was improved by dividing data into three groups, 11 May–16 June, 17 June–8 July and 9 July–7 October (Fig. 9). The third period showed the strongest correlation with tem-perature, describing 69% of the variation in FN. To
cover 6 months, 1 May–31 October,FNwas modelled
from soil temperature where no data were available from soil chambers. Over the 6-month period, about 3.1 kg m−2 of CO
2 was released to the atmosphere.
On a monthly basis,FNwas lowest in May, with 6%
of the totalFN, and highest in August, with 30% of
the 6-month totalFN(Fig. 10).
4. Discussion
4.1. Respiration rates and seasonal variation
in the range 0.05−0.15 mg m−2s−1 at 10◦C (soil
temperatures at 4–10 cm depth). Rayment and Jarvis (1997) found Q10 in the range 1.8–3.8 for soil
tem-peratures at 5 cm depth and Goulden and Crill (1997) and Lavigne et al. (1997) found Q10e in the range
1.7–3.7 for soil temperatures in the range 4–10 cm. Moreover, Pajari (1995) reported average respiration rates in the range 0.006–0.046 mg m−2s−1 for mean air temperatures in the range−17 to 17◦C. The
respi-ration rate of 0.19 mg m−2s−1 atTs=10◦C found in
this study (Fig. 6a), was at the higher end of the range of values encountered in these studies, while theQ10e
value (4.8) was outside the range. Lindroth et al. (1998) showed for the present stand that respiration rates scaled to stand level agreed well with respiration rates measured above the stand. At the ecosystem level, they reported a Q10e of 2.63 and a respiration
rate at 10◦C of 0.19 mg m−2s−1, using air
temper-ature above the canopy as predictor. Corresponding figures for forest floor respiration, with chamber tem-perature as predictor, were 1.89 and 0.21 mg m−2s−1 (Fig. 6c), respectively, indicating a higher base respi-ration rate, but a less steep increase in respirespi-ration rate with increasing temperature. Thus respiration rates reported here were large in comparison with those from other studies, but within reasonable limits in relation to respiration rates at the ecosystem level. As was pointed out by Rayment and Jarvis (1997), com-parison of respiration rates andQ10 values is difficult,
because both depend on the temperature from which they are derived. Derivation of Q10 from air
tem-perature generates a lowerQ10, because of the large
diurnal temperature variation, thanQ10 derived from
soil temperatures, where the range of diurnal varia-tion is smaller (Fig. 6a–c). Therefore modelling of the respiration component of stand fluxes requires that
Q10 or Q10e be used with the temperatures at which
they were derived. Other use of Q10 may result in
erroneous estimates of respiration and consequently of photosynthetic uptake.
Some of the scatter in the relationship between respiration and temperature could be explained by seasonal variation in the base respiration rate, and pos-sibly also inQ10e. Lavigne et al. (1997) found
signifi-cant seasonal variation in the respiration–temperature relationship at three boreal forest sites out of six. At the forest ecosystem level, Goulden et al. (1997) found that the base respiration rate varied
throughout the season, while Q10 was constant. In
both cases, seasonal variation was added to an em-pirical model as a day-number dependent parameter. Such a model is a valuable tool for filling in missing data, and for analysing data for the period during which measurements were made, but is of less, or no use for temporal and spatial extrapolation. Goulden et al. (1998) divided soil respiration into shallow and deep-soil respiration. They found a strong correlation both between shallow-soil respiration and the tem-perature of the uppermost soil layers, and between deep-soil respiration and soil temperature at 50 cm. This implies that soil respiration depends on the tem-perature of the whole soil volume, which cannot be described by the temperature of a single layer. It is beyond the scope of this paper to go deeper into these questions but there is no question that there is room for a lot of development in this field of research.
The net CO2 efflux for the forest floor,
accumu-lated from May to October, was ca. 3.1 kg m−2. Dur-ing 1 week in June, photosynthetic uptake reduced simultaneously respired CO2 by ca. 28% (Fig. 7c).
This proportion probably did not remain constant throughout the growing season, but was most likely controlled by day length, and therefore decreased from June to October. Assuming that photosynthetic uptake from May to October reduced, on average, respired CO2 by 20%, respiration would be 3.7 kg
and photosynthetic uptake 0.6 kg. If we further as-sume that the respiration rate of the forest floor during the winter equals the efflux rate at the beginning of May, i.e. 0.05 mg m−2s−1, then the respiration from January to April and November to December would be ca. 0.8 kg m−2 of CO2. Although respiration in
November may be higher, this is probably an over-estimate, because of the low temperatures in winter; chamber measurements in February–March indicated soil CO2efflux for temperatures below 0◦C was less
than 0.05 mg m−2s−1. Nevertheless, this assumption gives a total annual forest floor respiration of 4.5 kg CO2 m−2. This is in agreement with Lindroth et al.
(1998), where the total respiration (soil, branch, and needle) for this forest in 1995 was 5.5 kg m−2 CO
2.
Compared to the mean annual respiration for boreal forests, of 1.2 (range 0.4–2.0) kg CO2m−2 per year,
Lindroth et al. (1998), however, showed that the present forest ecosystem acted, during a 2-year pe-riod, as a source of carbon and not as a sink, contrary to what is usually believed of boreal forests.
4.2. Within-day dynamics
The soil chambers were transparent, and measured CO2 exchange over moss and Vaccinium surfaces.
Therefore, the diurnal variation included photosyn-thetic uptake during daytime. The respiration term was always larger than the uptake term, thus there was a continuous efflux of CO2 from the forest
floor to the atmosphere. Goulden and Crill (1997) found similarly, for feather-moss sites, a continuous efflux of CO2, while sphagnum-moss sites
exhib-ited larger uptake rates, which at mid-day frequently offset respiration rates. Gross mid-day photosyn-thesis ranged from 0.5 to 1.0mmol m−2s−1 at the feather-moss sites and from 0.5 to 2.5mmol m−2s−1 at the sphagnum-moss sites. In the present study, gross mid-day photosynthetic rates for the short pe-riod in June were in the range 0.05–0.19 mg m−2s−1 (i.e. 1.1–4.3mmol m−2s−1) (Fig. 8), in other words, higher rates, but still of the same magnitude as those from the feather-moss and sphagnum-moss sites. In the present stand the dry mass of moss per unit area of ground varied on average between 50−150 g m−2.
Hence, the photosynthetic rate of the moss layer would have to be in the range 7–22, and 29–86 nmol CO2 (g photosynthesising moss)−1 s−1, in order to
correspond to a photosynthetic uptake rate of 0.05 and 0.19 mg m−2s−1, respectively. Stålfelt (1937), as referred to by Kallio and Kärenlampi (1975) found maximum values of net photosynthetic rates in forest mosses in southern Sweden in the range 13–22 nmol CO2g−1s−1. Furthermore, the contribution from the
vascular plants in relative terms can be considerable. Wielgolaski (1975), reported forV. myrtillusleaves a net assimilation rate of 69 nmol CO2g−1s−1.
There-fore, the uptake rate under light-saturated conditions, of 0.19 mg m−2s−1, is not an unrealistic estimate of
gross photosynthesis.
As was pointed out in Section 2 (Fig. 2b), a peak, of varying size and not directly related to temper-ature, often occurred near sunset. Baldocchi et al. (1986), measuring CO2 efflux from a forest floor by
eddy-covariance, similarly found that soil respiration exhibited a burst at dusk, which often was greater than the highest respiration rates measured in the afternoon. A likely explanation for this was thought to be the rapid catabolism of translocated carbohydrate (Edwards and McLaughlin, 1978). Later, Baldocchi and Meyers (1991) suggested that their measure-ments were not reliable, because of non-steady-state conditions caused by a rapid build-up of carbon con-centrations in the trunk space, and should have been discarded. However, it is interesting to note that the two inherently different measurement systems re-vealed a similar diurnal pattern. Since measurements with the soil chamber within 30 cm of the soil surface showed a similar dusk burst of CO2, the phenomenon
cannot satisfactorily be dismissed as the result of unreliable measurements. To improve understanding of within-day CO2 exchange at the forest floor, this
process therefore must be studied further.
4.3. Chamber system
Compared to the static and dynamic chambers com-monly used for soil respiration studies, the continu-ously measuring open-chamber system applied in the present study had several advantages: (i) it could be left unattended for extended periods, (ii) the cham-bers were transparent, which allowed measurement of the net CO2 exchange of the forest floor, and (iii)
the chambers covered a relatively large surface area, thereby minimising ‘edge effects’ and could, in con-trast to small chambers, cover impermeable areas such as rocks or larger roots near the surface (cf. Norman et al., 1997). An advantage of this system, compared to eddy-covariance systems, was that the chambers cov-ered a well-defined surface area, but at the price of slight disturbance of the climate within the chamber. The canopy was, however, practically closed, and the light penetrating to the forest floor only occasionally exceeded 200mmol m−2s−1(Fig. 3), so that temper-ature and the vapour-pressure deficit inside the cham-bers were not noticeably affected. But it remains to study how the chamber design affects natural pres-sure fluctuations, which are of great importance to the transfer of CO2from the soil to the atmosphere (e.g.
5. Concluding remarks
In conclusion, this study has shown that large, con-tinuously measuring soil chambers can satisfactorily be used to measure the CO2 efflux from the forest
floor, and thus can overcome some of the difficulties associated with small chambers. The use of large chambers, however, requires that chambers be care-fully installed, to ensure that there is no other contact between soil air and atmosphere through soil pores, than at the surface covered by the chamber. Soil tem-perature at 5 cm was the best predictor of nocturnal respiration rates, and was used to supply missing data for limited time periods, and to analyse soil respiration measurements. This temperature was also used to fill in gaps in the accumulated net exchange of the forest floor. But since soil respiration is governed by many factors, of which temperature is but one, a single soil temperature is not sufficient to model seasonal and between-year variation in soil respiration rates. There-fore, process-based models are needed. This would require separate measurements of root and microbial respiration and their governing factors. For such a study, the soil chambers would constitute a suitable tool for testing the scaling of mechanistically based soil respiration and photosynthesis models, since they integrate fluxes from relatively large surfaces.
Acknowledgements
We thank Erik Kellner for providing data on soil temperature and soil water content, Jeremy Flower-Ellis for efficient language revision, and two anonymous reviewers for helpful comments to the manuscript. This research was performed within the framework of the NOPEX and EUROFLUX projects. Funding was provided by the Swedish Natural Science Research Council, EU, the Nordic Council of Minis-ters and the Knut and Alice Wallenberg Foundation.
References
Baldocchi, D.D., Meyers, T.P., 1991. Trace gas exchange above the floor of a deciduous forest 1. Evaporation and CO2efflux.
J. Geophys. Res. 96 (D4), 7271–7285.
Baldocchi, D.D., Vogel, C.A., 1996. Energy and CO2flux densities
above and below a temperate broad-leaved forest and a boreal pine forest. Tree Physiol. 16, 5–16.
Baldocchi, D.D., Vogel, C.A., Hall, B., 1997. Seasonal variation of carbon dioxide exchange rates above and below a boreal jack pine forest. Agri. For. Meteorol. 83, 147–170.
Baldocchi, D.D., Verma, S.B., Matt, D.R., Anderson, D.E., 1986. Eddy-correlation measurements of carbon dioxide efflux from the floor of a deciduous forest. J. Appl. Ecol. 23, 967–975. Dixon, R.K., Brown, S., Houghton, R.A., Solomon, A.M., Trexler,
M.C., Wisniewski, J., 1994. Carbon pools and flux of global forest ecosystems. Science 263, 185–189.
Edwards, N.T., McLaughlin, S.B., 1978. Temperature-independent diel variations of respiration rates in Quercus alba and Liriodendron tulipifera. Oikos 31, 200–206.
Freijer, J.I., Leffelaar, P.A., 1996. Adapted Fick’s law applied to soil respiration. Water Resources Res. 32 (4), 791–800. Glinski, J., Stepniewski, W., 1985. Soil Aeration and its Role for
Plants. CRC Press, Boca Raton, FL.
Goulden, M.L., Crill, M.P., 1997. Automated measurements of CO2 exchange at the moss surface of a black spruce forest.
Tree Physiol. 17, 537–542.
Goulden, M.L., Munger, J.W., Fan, S-M., Daube, B.C., Wofsy, S.C., 1996a. Exchange of carbon dioxide by a deciduous forest: response to interannual climate variability. Science 271, 1576– 1578.
Goulden, M.L., Munger, J.W., Fan, S-M., Daube, B.C., Wofsy, S.C., 1996b. Measurements of carbon sequestration by long-term eddy covariance: methods and a critical evaluation of accuracy. Global Change Biol. 2 (3), 169–182.
Goulden, M.L., Daube, B.C., Fan, S.-M., Sutton, D.J., Bazzaz, A., Munger, J.W., Wofsy, S.C., 1997. Physiological responses of a black spruce forest to weather. J. Geophy. Res. 102 (D24), 28987–28996.
Goulden, M.L., Wofsy, S.C., Harden, J.W., Trumbore, S.E., Crill, P.M., Gower, S.T., Fries, T., Daube, B.C., Fan, S.-M., Sutton, D.J., Bazzaz, A., Munger, J.W., 1998. Sensitivity of boreal forest carbon balance to soil thaw. Science 279, 214–217. Grace, J., Lloyd, J., McIntyre, J., Miranda, A.C., Meir, P., Miranda,
H.S., Nobre, C., Moncrieff, J., Massheder, J., Malhi, Y., Wright, I., Gash, J., 1995. Carbon dioxide uptake by an undisturbed tropical rain forest in southwest Amazonia 1992 to 1993. Science 270, 778–780.
Greco, S., Moss, R.H., Viner, D., Jenne, R., 1994. Climatic Scenarios and Socio-economic Projections for IPCC Working Group II Assessment. IPCC-WMO and UNEP, Washington DC. Grelle, A., Lindroth, A., 1996. Eddy-correlation system for long-term monitoring of fluxes of heat, water vapour and CO2.
Global Change Biol. 2, 297–307.
Halldin, S., Gryning, S.E., Gottschalk, L., Jochum, A., Lundin, L.C., van de Griend, A.A., 1999. Energy, water and carbon exchange in a boreal forest — NOPEX experiences. Agric. For. Meteorol., 98–99, 5–29.
Iritz, Z., Lindroth, A., Gärdenäs, A., 1997. Open ventilated chamber system for measurements of H2O and CO2 fluxes
Janssens, I.A., Ceulemans, R., 1998. Spatial variability in forest soil CO2efflux assessed with a calibrated soda lime technique.
Ecol. Letters 1, 95–98.
Jones, T.H., Thompson, L.J., Lawton, J.H., Bezemer, T.M., Bardgett, R.D., Blackburn, T.M., Bruce, K.D., Cannon, P.F., Hall, G.S., Hartley, S.E., Howson, G., Jones, C.G., Kampichler, C., Kandeler, E., Ritchie, D.A., 1998. Impacts of rising atmospheric carbon dioxide on model terrestrial ecosystems. Science 280, 441–442.
Kaiser, J., 1998. New network aims to take the world’s CO2pulse.
Science 281, 506–507.
Kallio, P., Kärenlampi, L., 1975. Photosynthesis in mosses and lichens. In: Cooper, J.P. (Ed.), Photosynthesis and Productivity in Different Environments. Cambridge University Press, Cambridge, London, New York, Melbourne, pp. 393–424. Kirschbaum, M.U.F., 1995. The temperature dependence of soil organic matter decomposition, and the effect of global warming on soil organic C storage. Soil Biol. Biochem. 27 (6), 753–760. Lavigne, M.B., Ryan, M.G., Anderson, D.E., Baldocchi, D.D., Crill, P.M., Fitzjarrald, D.R., Goulden, M.L., Gower, S.T., Massheder, J.M., McCaughey, J.H., Rayment, M., Striegl, R.G., 1997. Comparing nocturnal eddy covariance measurements to estimates of ecosystem respiration made by scaling chamber measurements at six coniferous boreal sites. J. Geophy. Res. 102 (D24), 28977–28985.
Lindroth, A., Grelle, A., Morén, A.-S., 1998. Long-term measurements of boreal forest carbon balance reveal large temperature sensitivity. Global Change Biol. 4, 443–450. Lloyd, J., Taylor, J.A., 1994. On the temperature dependence of
soil respiration. Func. Ecol. 8, 315–323.
Lundin, L.-C., Cienciala, E., Grelle, A., Halldin, S., Hjelm, P., Kellner, E., Lindroth, A., Lundberg, A., Morén, A.-S., Nord, T., Seibert, J., Stähli, M., 1999. Continuous long-term measurements of soil–plant–atmosphere variables at a forest site, Agric. For. Meteorol. 98–99, 53–73
Mathes, K., Schriefer, Th., 1985. Soil respiration during secondary succession: influence of temperature and moisture. Soil Biol. Biochem. 17 (2), 205–211.
Morén, A.-S., Lindroth, A., Flower-Ellis, J., Cienciala, E., Mölder, M., 2000. Branch transpiration of pine and spruce scaled to tree and canopy using needle biomass distributions. Trees, in press. Nakayama, F.S., 1990. Soil respiration. Remote Sensing Rev. 5 (1),
311–321.
Norman, J.M., Kucharik, C.J., Gower, S.T., Baldocchi, D.D., Crill, P.M., Rayment, M., Savage, K., Striegl, R.G., 1997. A
comparison of six methods for measuring soil-surface carbon dioxide fluxes. J. Geophy. Res. 102 (D24), 28771–28777. Pajari, B., 1995. Soil respiration in a poor upland site of Scots
pine stand subjected to elevated temperatures and atmospheric carbon concentration. Plant and Soil 168–169, 563–570. Raich, J.W., Schlesinger, W.H., 1992. The global carbon dioxide
flux in soil respiration and its relationship to vegetation and climate. Tellus 44B, 81–99.
Rayment, M.B., Jarvis, P.G., 1997. An improved open chamber system for measuring soil CO2effluxes in the field. J. Geophys.
Res. 102 (D24), 28779–28784.
Sellers, P.J., Hall, F.G., Kelly, R.D., Black, A., Baldocchi, D., Berry, J., Ryan, M., Ranson, K.J., Crill, P.M., Lettenmaier, D.P., Margolis, H., Cihlar, J., Newcomer, J., Fitzjarrald, D., Jarvis, P.G., Gower, S.T., Halliwell, D., Williams, D., Goodison, B., Wickland, D.E., Guertin, F.E., 1997. BOREAS in 1997: experiment overview, scientific results, and future directions. J. Geophys. Res. 102 (D24), 28731–28769.
Simunek, J., Suarez, D.L., 1993. Modeling of carbon dioxide transport and production in soil 1. Model development. Water Resources Res. 29 (2), 487–497.
Steffen, W., Noble, I., Canadell, J., Apps, M., Schulze, E.-D., Jarvis, P.G., Baldocchi, D., Cias, P., Cramer, W., Ehleringer, J., Farquhar, G., Field, C.B., Ghazi, A., Gifford, R., Heimann, M., Houghton, R., Kabat, P., Körner, Ch., Lambin, E., Linder, S., Mooney, H.A., Murdiyarso, D., Post, W.M., Prentice, I.C., Raupach, M.R., Schimel, D.S., Shvidenko, A., Valentini, R., 1998. The terrestrial carbon cycle: implications for the Kyoto protocol. Science 280, 1393–1394.
Suarez, D.L., Simunek, J., 1993. Modeling of carbon dioxide transport and production in soil 2. Parameter selection, sensitivity analysis, and comparison of model predictions to field data. Water Resources Res. 29 (2), 499–513.
Verma, S.B., 1990. Micrometeorological methods for measuring surface fluxes of mass and energy. Remote Sensing Rev. 5 (1), 99–115.
Wielgolaski, F.E., 1975. Primary production of tundra. In: Cooper, J.P. (Ed.), Photosynthesis and Productivity in Different Environments. Cambridge University Press, Cambridge, London, New York, Melbourne, pp. 75–106.
Wofsy, S.C., Goulden, M.L., Munger, J.W., Fan, S.M., Bakwin, P.S., Daube, B.C., Bassow, S.L., Bazzaz, F.A., 1993. Net exchange of CO2 in a mid-latitude forest. Science 260, 1314–